Lead Acid Battery Analysis using Spectrogram
R. Kasim
1,a, A. R. Abdullah
2,b, N. A. Selamat
3,c,N. A. Abidullah
4,dand T.N.S.T.Zawawi
5,e1,2,3,4,5Faculty of Electrical Engineering
Universiti Teknikal Malaysia Melaka (UTeM) Malacca, Malaysia
[email protected] , [email protected]b , [email protected]c, [email protected], [email protected]
Keywords: Lead acid, Time Frequency Distribution (TFD), Time Frequency Representation (TFR),
instantaneous root mean square (RMS), MATLAB/SIMULINK
Abstract. Battery is an alternative option that can be substituted for future energy demand. Numerous type of battery is used in industries to propel portable power and its makes the task of selecting the right battery type is crucial. These papers discuss the implementation of linear time-frequency distribution (TFD) in analysing lead acid battery signals. The time-time-frequency analysis technique selected is spectrogram. Based on, the time-frequency representations (TFR) obtain, the signal parameter such as instantaneous root mean square (RMS) voltage, direct current voltage (VDC) and alternating current voltage (VAC) are estimated. The parameter is essential in identifying signal characteristics. This analysis is focussing on lead-acid battery with nominal battery voltage of 6 and 12V and storage capacity from 5 until 50Ah, respectively. The results show that spectrogram technique is capable to estimate and identify the signal characteristics of Lead Acid battery.
Introduction
In today’s world, the battery plays a vital role in local energy storage for a wide range of systems. In the aspect of technology, lead acid battery is the oldest type of rechargeable battery. The lead–acid battery was invented in 1859 by French physicist Gaston Planté [1-2]. The lead-acid is the most popular form of energy storage utilized because it has a higher energy density, wide availability and low cost [3].
Many type of battery are used in commerce to propel power and its make the task of selecting the right battery is crucial. Keep in mind that battery is undergo electrochemical process. Hence, it’s a device that is slow to fill, holds relatively little storage capacity and has a defined life span [4]. Normally, the manufacturer has the choices of developing a battery for a long times and low cost, but it will have a limited service life. Therefore, the information of battery such as capacity storage, current and voltage are important in managing the energy consumption of the powered system. The analysis of battery signal is required to provide the right information of the battery [5].
Different methods and analytical techniques have been used to identify battery parameters. For example, M. Daowd et al [6] use standard battery test for parameters estimation were represented with different battery models parameters estimation methods. Besides that, L.W.Yao et al [4] and N.Maubayed et al [1] use an equivalent circuit model to develop lithium Ferro phosphate and lead acid battery to identify the battery parameters. However, this paper looks at use of time frequency analysis technique to analyse battery parameter.
This paper presents time-frequency distribution (TFD) which is spectrogram to analyse signals from charging and discharging of lead acid battery. The signal is generated using MATLAB/SIMULINK software using several standards Simulink blocks. Next, the spectrogram technique is used to represent the signal in time-frequency representation (TFR) to identify and determine the signal parameter. Then, based on the TFR, a set of parameter are calculated such as instantaneous voltage means square (RMS), direct current voltage (VDC) and alternating current
voltage (VAC). This information is used to identify the signal parameter for Lead Acid battery [7].
Lead Acid Battery
The Lead Acid battery is made up of separator plates, lead plates, and lead oxide plates with a 35% sulphuric acid and 65% water solution. This solution is called electrolyte that causes a chemical reaction that produce electrons. When the battery discharges, the electrolyte dilutes and the sulphur deposits on the lead plates, while when it recharged the process reverses and the sulphur dissolves into the electrolyte. They can be recharged when one reverses the chemical reaction; it is what differentiates them from the electric batteries. This paper used lead-acid battery model from MATLAB/SIMULINK to generate signal for battery charging and discharging using equation below [1-2]. exponential zone time constant inverse Ah-1
Parameter Estimation. Parameters of the signal such as instantaneous RMS voltage, direct current voltage (VDC) and alternating current voltage (VAC) are estimated from the time frequency
representation (TFR) to identify the signal information. The information is important to detect the battery signals [8].
Spectogram. Spectogram is one of the time-frequency distributions (TFD) that represents the signal energy with respect to time and frequency. The analysis technique is motivated by the limitation of Fast Fourier Transform (FFT) to cater non-stationary signals whose spectral characteristic change in time. Spectogram can be defined as [9]:
( ), ( ) ( ) j2 f 2.
Instantaneous RMS Voltage. Instantaneous RMS voltage is defined as the RMS voltage at power system frequency [10]. It can be calculated as;
max2max
Where Sx (t, f) is the time-frequency distribution and fmax is the maximum frequency of interest. Direct Current Voltage. The direct current voltage can be calculated as;
2 Altertenating Current Voltage. Instantenous voltage alternating current consists of harmonic and non-harmonic distortion.The VAC can be defined as ;
( )2 ( )2
AC rms DC
V (t)= V t −V t (6)
Results
A simulation model is established using MATLAB/SIMULINK to evaluate the performance of the system. The simulation consists of lead acid battery with voltage at 6 and 12V and various storage capacities in the range of 5 to 50Ah. Figures 1 (a) and (b) shows the voltage charge and discharge with different voltage and capacity.
(a) (b)
Fig. 1 Voltage Charging and Discharging for (a) 6V with 15 Ah (b) 12V with 50Ah
Figures 2 (a) and (b) shows the time and frequency of the lead acid battery signal using spectrogram. The red line represents the highest amplitude and the blue line represent the lowest amplitude. The signal consists of frequency at 0 Hz.
(a) (b)
Fig. 2 Time Frequency Representation (a) 6V with 15 Ah (b) 12V with 50Ah
Refer to figures 5 (a) and (b), the graphs show the value of alternating current (VAC) for Lead
Acid battery. For 6V with 15Ah, the value is 0.5358V while for 12V with 50Ah the value is 0.6995V.
(a) (b)
Fig. 5 Alternating current voltage (VAC) (a) 6V with 15Ah (b) 12V with 50Ah
The diagram shown in figures 6 (a) (b) shows the spectrogram results for “Vrms, VDC and VAC
respectively”. From the diagram, the Y-axis represents the Vrms, VDC and VAC, while the X-axis
represents the storage capacity (Ah). For 6V, the value for Vrms and VDC are from 6.7V to 6.9V
while the value for 12V is in the range of 13.9V to 13.6V. So, from the VDC value, the nominal
battery voltage can be estimated.
(a) (b) Fig. 6, Spectrogram for (a) 6V with 15Ah (b) 12V with 50Ah
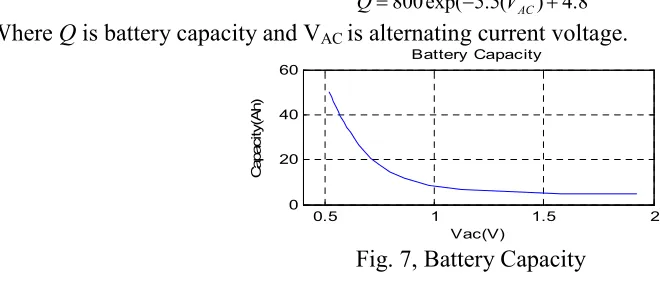
Figure 7 shows, result for battery capacity. From the graph, Y-axis represents the storage capacity while X-axis represent the VAC. The graph is produced using equation 7and to verify the
accuracy of the equation, mean absolute error percentage (MAPE) is used. Thus, the storage capacity can be estimated.
Q=800exp( 5.5(− VAC) 4.8+ (7)
Where Q is battery capacity and VAC is alternating current voltage.
Fig. 7, Battery Capacity
Conclusion
The analysis and identification of parameter for lead acid battery is presented using TFD which is spectogram. From the parameter calculation, the TFR is estimated to be able to identify signal parameter and then, based on the parameters, signal characteristic can be calculated. The calculated parameter are instantaneous Vrms, VDC and VAC. Next, the characteristic of lead acid battery can be
identified based on storage capacity and voltage. As a conclusion the identification of lead acid battery can be done by an estimation using spectrogram.
Acknowledgment
The authors would like to thank Universiti Teknikal Malaysia Melaka (UTeM) and the Ministry of Higher Education (MOHE) for providing the research grant RAGS/2012/FKE/TK07/1 B00011 for this research. Special thanks to Advanced Digital Signal Processing (ADSP), CeRiA laboratory for giving the support in this study.
Reference
[1] N. Moubayed, J. Kouta, A. EI-AIi, H. Dernayka and R. Outbib,“Parameter Identification of
The Lead-Acid Battery Model” IEEE, 2008.
[2] Daesik Kim and Hanju Cha “Kt Factor analysis of Lead-Acid Battery for Nuclear Power
Plant”, International Conference on Electrical Machines and Systems, Oct. 26-29, 2013
[3] Ceraolo, Massimo. "New dynamical models of lead-acid batteries." Power Systems, IEEE Transactions on 15, no. 4: 1184-1190, 2000.
[4] L.W.Yao, J. A. Aziz, P.Y.Kong, and N. R. N. Idris. "Modeling of lithium-ion battery using MATLAB/SIMULINK", In Industrial Electronics Society, IECON 2013-39th Annual Conference of the IEEE, pp. 1729-1734. IEEE, 2013.
[5] O. Tremblay, and L.A. Dessaint, “Experimental validation of a battery dynamic model for EV
Applications” World Electric Vehicle Journal, vol. 3, May 2009.
[6] M.Daowd, N.Omar, B.Verbrugge, P.V.Den Bossche, and J.V.Mierlo. “Battery Models
Parameter Estimation based on MATLAB/Simulink®.” EVS-25 Shenzhen, China 2010.
[7] N.S.Ahmad, A.R.Abdullah, N.Bahari and M.A.Hassan, “Switches Faults Analysis of Voltage
Source Inverter (VSI) Using Short Time Fourier Transform (STFT)”, International Review on
Modeling and Simulation, vol.7, No.3, 2014.
[8] N.Q.Zainal Abidin, A.R.Abdullah, N.H. Rahim, N. Nordin and A. Amin,“Online Surface Condition Monitoring System Using Time Frequency Analysis Technique on High Voltage
Insulators”, IEEE 7th International Power Engineering and Optimization Conference, 2013.
[9] N. Nordin, A. R. Abdullah, N. Q. Z. Abidin, A. Amin, “High Voltage Insulation Surface
Condition Analysis using Time Frequency Distribution”, Australian Journal of Basic Science,
7 (7): 833-841,2013.
[10] A.R.Abdullah, N.S.Ahmad, E.F.Shair,A.jidin, “Open Switch Faults Analysis in Voltage Source
Inverter using Spectogram”, IEEE 7th International power Engineering and Optimization