BORANG PENGESAHAN STATUS TESIS*
JUDUL :
SESI PENGAJIAN : _ _ _ _
Saya
mengaku membenarkan tesis Projek Sarjana Muda ini disimpan di Perpustakaan Fakulti Teknologi Maklumat dan Komunikasi dengan syarat-syarat kegunaan seperti berikut:
1. Tesis dan projekadalah hakmilik Universiti Teknikal Malaysia Melaka.
2. Perpustakaan Fakulti Teknologi Maklumat dan Komunikasi dibenarkan
membuat salinan untuk tujuan pengajian sahaja.
3. Perpustakaan Fakulti Teknologi Maklumat dan Komunikasi dibenarkan
membuat salinan tesis ini sebagai bahan pertukaran antara institusi pengajian tinggi.
4. ** Sila tandakan (/)
SULIT (Mengandungi maklumat yang berdarjah
keselamatan atau kepentingan Malaysia seperti yang termaktub di dalam AKTA RAHSIA RASMI 1972)
TERHAD (Mengandungi maklumat TERHAD yang telah ditentukan oleh organisasi/badan di mana penyelidikan dijalankan)
/ TIDAK TERHAD
(TANDATANGAN PENULIS) (TANDATANGAN PENYELIA)
Alamat tetap: NO 207 BLOK 7
DR SHARIFAH SAKINAH SYED AHMAD
BEREK POLIS SEK 20, 40300 Nama Penyelia
SHAH ALAM,SELANGOR.
Tarikh: Tarikh:
CATATAN: * Tesis dimaksudkan sebagai Laporan Projek Sarjana Muda (PSM).
** Jika tesis ini SULIT atau atau TERHAD, sila lampirkan surat daripada pihak berkuasa.
2013 / 2014
AFIRAH BINTI TAUFIK
A COMPARATIVE STUDY OF FUZZY C-MEANS AND K-MEANS CLUSTERING TECHNIQUES
AFIRAH BINTI TAUFIK
This report is submitted in partial fulfillment of the requirements for the Bachelor of Computer Science (Artificial Intelligence)
FACULTY OF INFORMATION AND COMMUNICATION TECHNOLOGY UNIVERSITI TEKNIKAL MALAYSIA MELAKA
ii
DECLARATION
I hereby declare that this project report entitled
A COMPARATIVE STUDY OF FUZZY C-MEANS AND K-MEANS CLUSTERING TECHNIQUES
is written by me and is my own effort and that no part has been plagiarized without citations.
STUDENT : _________________________ Date: _______________
(AFIRAH BINTI TAUFIK)
SUPERVISOR : _________________________ Date: _______________
iii
DEDICATION
This work is dedicated to my beloved parents, Mr. Taufik Bin Pandak Hassan and Ms. Nilawati Bt Hamzah, without whose caring supports it would not
have been possible, and to my supervisor, Dr. Sharifah Sakinah Bt Syed Ahmad for always supervise me, give your guidance and giving me such
iv
ACKNOWLEDGEMENTS
I have taken efforts in this project. However, it would not have been possible without the kind support and help of my supervisor, lecturers and friends. I would like to extend my sincere thanks to all of them. I am highly indebted to lecturers of Department of Industrial Computing for their guidance and constant supervision as well as for providing necessary information regarding the project and also for their support in completing the project. I would like to express my gratitude towards my parents and lecturers Faculty of Information and Communication Technology for their kind co-operation and encouragement which help me in completion of this project. My thanks and appreciations also go to my colleague in developing the project and people who have willingly helped me out with their abilities.
v
ABSTRACT
Clustering analysis has been considered as useful means for identifying patterns of dataset. The aim for this analysis is to decide what is the most suitable algorithm to be used when dealings with new scatter data. In this analysis, two important clustering algorithms namely fuzzy c-means and k-means clustering algorithms are compared. These algorithms are applied to synthetic data 2-dimensional dataset. The numbers of data points as well as the number of clusters are determined, with that the behavior patterns of both the algorithm are analyzed. Quality of clustering is based on lowest distance and highest membership similarity between the points and the centre cluster in one cluster, known as inter-class cluster similarity. Fuzzy c-means and k-means clustering are compared based on the inter-class cluster similarity by obtaining the minimum value of summation of distance. Additionally, in fuzzy c-means algorithm, most researchers fix weighting exponent (m) to a conventional value of 2 which might not be the appropriate for all
applications. In order to find m, also called as fuzziness coefficient, optimal in fuzzy
vi
ABSTRAK
ix
TABLE OF CONTENTS
CHAPTER SUBJECT PAGE
DECLARATION II
DEDICATION III
ACKNOWLEDGEMENTS IV
ABSTRACT VI
ABSTRAK VI
LIST OF TABLES IX
LIST OF FIGURES XIII
LIST OF ABBREVIATIONS XIV
CHAPTER 1 INTRODUCTION 1
1.0 PROJECT BACKGROUND 1
1.2 PROBLEM STATEMENT 2
1.3 OBJECTIVES 2
1.4 SCOPE 3
1.5 PROJECT SIGNIFICANCE 3
1.6 EXPECTED OUTPUT 3
ix
CHAPTER 2 LITERATURE REVIEW
4
2.1 INTRODUCTION 4
2. 2 FACTS AND FINDINGS 4
2.3 FUZZY VS K-MEANS 9
2.4 CONCLUSION 10
CHAPTER 3 METHODOLOGY 11 3.1 PROJECT METHODOLOGY 11
3.1.1 ANALYSIS 12
3.1.2 DESIGN AND DEVELOPMENT 12
3.1.3 EXPERIMENTAL AND ANALYSIS 13
3.2 STEP OF PROCESS CLUSTERING 14
3.3 PROJECT SCHEDULE AND MILESTONE 15
3.4 CONCLUSION 15
CHAPTER 4 TECHNIQUES 16 4.1 INTRODUCTION 16
4.2 TECNIQUES 16
4.2.1 FUZZY C-MEANS 16
4.2.2 FUZZY C-MEANS IN MATLAB 18
4.2.3 K-MEANS 20
ix
4.2.5 RECONSTRUCTION ERROR TO
FIND M EXPONENT OPTIMAL 22
4.3 SYNTHETIC DATASETS 23
4. 4 CONCLUSION 24
CHAPTER 5 EXPERIMENTAL AND ANALYSIS 25
5.1 INTRODUCTION 25
5.2 EXPERIMENTAL AND ANALYSIS 25
5.2.1 FUZZY C-MEANS VS K-MEANS 26
5.2.1.1 S2 DATASET 26
5.2.1.2 S3 DATASET 28
5.2.1.3 FLAME DATASET 30
5.2.1.4 PATHBASED DATASET 31
5.2.1.5 DS3 DATASET 32
5.2.1.6 DS4 DATASET 33
5.2.1.7 DATA DATASET 34
5.2.1.8 DATA2 DATASET 35
5.2.1.9 DATA3 DATASET 36
5.2.1.10 DATA4 DATASET 37
5.2.2 INTER-CLUSTER SIMILARITY 40
5.2.3 FUZZY C-MEANS (RECONSTRUCTION ERROR 43
ix
5. 2.3.2 RECONSTRUCTION ERROR OF
DATASET S3 45
5. 2.3.3 RECONSTRUCTION ERROR OF DATASET FLAME 46
5. 2.3.4 RECONSTRUCTION ERROR OF DATASET PATHBASED 47
5. 2.3.5 RECONSTRUCTION ERROR OF DATASET DS3 48
5. 2.3.6 RECONSTRUCTION ERROR OF DATASET DS4 49
5. 2.3.7 RECONSTRUCTION ERROR OF DATASET DATA 50
5. 2.3.8 RECONSTRUCTION ERROR OF DATASET DATA2 51
5. 2.3.9 RECONSTRUCTION ERROR OF DATASET DATA3 52
5. 2.3.10 RECONSTRUCTION ERROR OF DATASET DATA4 53
5.3 CONCLUSION 55
CHAPTER 6 DISCUSSION AND CONCLUSION 56
6.1 DISCUSSION 56
6.2 CONTRIBUTION 57
ix
REFERENCES 59
BIBLIOGRAPHY 59
APPENDICES 60
LIST OF TABLES
TABLE TITLE PAGE
Table 2.1 Comparison between fuzzy c-means versus
k-means. 9
Table 4.1 Ten synthetic used 2-dimensional of dataset 23
Table 5.1 Comparison with s3 dataset 26
Table 5.2 Comparison with s4 dataset 28
Table 5.3 Comparison with flame dataset 30
Table 5.4 Comparison with pathbased dataset 31
Table 5.5 Comparison with ds3 dataset 32
Table 5.6 Comparison with ds4 dataset 33
Table 5.7 Comparison with data dataset 34
Table 5.8 Comparison with data2 dataset 35
Table 5.9 Comparison with data3 dataset 36
Table 5.10 Comparison with data4 dataset 37
Table 5.11 Comparison fuzzy c-means and k-means 41 based on summation distance of cluster
ix
x
LIST OF FIGURES
FIGURE TITLE PAGE
Figure 2.1 Different ways of cluster the same set of
objects 5
Figure 3.1 Analysis Development Cycle of Waterfall
Model 11
Figure 3.2 Step of process clustering 14
Figure 5.1 Example of inter-class cluster similarity 40
Figure 5.2 Code of tryfcm.m 40
Figure 5.3 Code of kmeanstry.m 40
Figure 5.4 Code of tryfcm.m 40
ix
LIST OF ABBREVIATIONS
FCM - Fuzzy c-means
VS - Versus
GA - Genetic Algorithm
1
CHAPTER I
INTRODUCTION
1.1 Project background
2
1.2 Problems statements
The problem statement for this analysis is to decide what is the most suitable algorithm to be used when dealings with new scatter data using both two methods clustering fuzzy c-means and k-means. Internal criterion for the quality of a clustering is based on lowest distance and highest membership similarity between the points and the centre cluster in one cluster, known as inter-class cluster similarity. Fuzzy c-means and k-means clustering are compared based on the inter-class cluster similarity by obtaining the minimum value of summation of distance. Additionally, in fuzzy c-means algorithm, most researchers fix weighting exponent, m to a conventional value of 2 which might not be the appropriate for all applications.
1.3 Objectives
The study analysis embarks on the following objectives:
• To develop clustering methods namely fuzzy c-means algorithm using Matlab.
• To analyze the process of constructing clustering results.
• To do comparison study between fuzzy c-means and k-means using inter-class
similarity measurement.
• To find m, fuzziness coefficient, optimal in fuzzy c-means based on particular
3
1.4 Scope
Analysis of comparison study between hard clustering and soft clustering is to do comparison study between fuzzy c-means and k-means using inter-class similarity measurement and to give the alternative of user to change m variable for fuzzy c-means in clustering. The method is parameterized with the number of clusters and the fuzziness coefficient, m which denotes the degree of fuzziness in the algorithm.
1.5 Project significance
This analysis will give understanding different between hard clustering and soft clustering. Besides, this analysis will benefit user which is user have an alternative to find the m variable optimal one in fuzzy c-means based on particular dataset.
1.6 Expected output
This analysis will prove the different between hard clustering and soft clustering. The user can get better understanding how differentiate between fuzzy c-means and k-c-means. Besides, user can find of m variable optimal in fuzzy c-c-means based on particular dataset.
1.7 Conclusion
4
CHAPTER II
LITERATURE REVIEW
2.1 Introduction
The literature review is to concentrate on facts and finding of clustering analysis, fuzzy c-means clustering and k-means clustering nowadays. It will include the theoretical and methodological contributions of those clustering methods. Literature review can be helped as a review of execution accomplishment.
2.2 Facts and findings
Clustering is a technique for finding similarity groups in data, called as
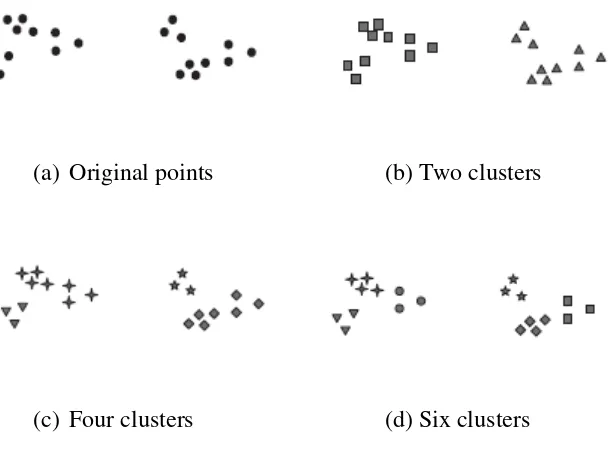
clusters. Cluster analysis groups data into clusters based on the similarity among data. The goal is the data within a group is similar to one another and different from the one another data in other groups. A good clustering method will produce clusters with a high intra-class similarity and low inter-class similarity. The figure is to show how the data are divides based on similarity in different clusters. Figure 2.1(a), shows the same twenty objects in original points and three different ways of dividing them into clusters. The same shapes of the markers show the cluster membership. Figures 2.1(b), 2.1(c) and 2.1(d) divide the objects into two, four and six clusters.
5
(a) Original points (b) Two clusters
(c) Four clusters (d) Six clusters
Figure 2.1 Different ways of cluster the same set of objects.
Cluster analysis is referred as unsupervised learning task as no class values
denoting an a priori grouping of the data instances are given. Various types of
clustering which is hierarchical clustering, partitioning clustering, exclusive clustering, overlapping clustering, and fuzzy clustering. There are many different types of clusters in world of clustering. One of them is a well separated. It shows based on the distance between any two objects in different clusters is larger than the distance between any two objects within a cluster. Well separated clusters are not to
be globular and can have any shape. The second one is graph based. Itbased on the
nodes are points and the links represents connection among points so a cluster can be defined as a connected components. Next, type of clusters is density based. It was called as density because it was adding by noise to the data and the data is surrounding by a region of low density.
6
membership degree/function of each data point in one cluster is must be equal to one. Every each iteration for membership (4-2) and cluster centers (4-3) are updated. The advantages when using fuzzy c-means is this algorithm will give a best result for overlapping data, complex data, incomplete data, and noisy data. This method is comparatively better rather than k-means algorithm. By using fuzzy c-means knowledge of the membership function, the dataset that the incomplete, complex and have a noise can be solved by the fuzzy value of membership function. The degree of these membership functions will give exactly knowledge belonging to which cluster center. Based on the dataset that hard to get the visualization such as the dataset 3-dimensional and so on, the knowledge of these membership functions also can help to solve the problem. This membership function can give the knowledge of certain dataset. On the other hand, k-means algorithm assign that every data point must exactly belong to one cluster center. Where for fuzzy c-means for every data point is assigned a membership to each cluster center of which data point may belong to more than one cluster center. Fuzzy c-means also is suitable for handling the issues for instability of patterns of dataset. The disadvantages when working with fuzzy c-means is the number of clusters based on apriori specification. Next, by minimizing or to get the lower value of objective function, it will give the better result but need more number of iteration. The default distance used is Euclidean distance measures is not equally fundamental factors.
7
The fuzzy c-means (FCM) clustering is commonly used for fuzzy clustering (Bezdek, 1984). The performance of fuzzy c-means clustering is depends on the selection of the initial cluster centre and the initial membership value. FCM is a method that always used in pattern recognition. It can give a good result of modelling in many wide area researches. In FCM algorithm most researchers (Alata,
2008) find optimal �, fuzziness coefficient, because of 2 are typical used and may
be not appropriate used for certain applications. Based FCM clustering algorithm, it need the optimal number of clusters by optimize the parameters of the clustering
algorithm by iteration search approach and then to find �, fuzziness coefficient, for
the FCM algorithm. In order to get an optimal number of clusters, the iterative search approach is used to find the optimal single output Sugeno type fuzzy inference system (FIS) model to optimizing the algorithm parameters that give minimum error using the real data and Sugeno fuzzy model.
8
resolve this and also fails with categorical data and non-linear data. K-means also fails to handle the noisy data like a fuzzy c-means and also not sensitive to the outlier and the dataset have a case such as data at borderline. In k-means, by randomly choosing of the cluster centre cannot give a fruitful result. As stated before, k-means is based on apriori specification of number of cluster centre.
In common, the internal criteria for a quality of clustering is by obtaining the goal to get a high intra-class cluster similarity (data point within a cluster are similar) and low inter-class cluster similarity (data point from different clusters are not similar). But the lower score of the distance for these both intra-class cluster and inter-class cluster is not necessary used as good knowledge in an application. In this analysis for fuzzy c-means and k-means, the summation distance between data point with cluster centre in one cluster concentrate on inter-class cluster are compared. The good score is based on minimum value of summation for these both two methods. The dataset have a good score for inter-class cluster showed the between data point and cluster centre in particular dataset is suitable with the methods used whether fuzzy c-means or k-means clustering algorithm.
Fuzzy c-means algorithm are about to use evolutionary computation or bio-inspired method to find the optimal number of clusters and exponent weight automatically. The results are by these two methods are presented genetic algorithm (GA) and particle swarm optimization (PSO) and a comparison the two methods to see if one of the methods is better than the other. As the results, shows that both GA and PSO algorithm are competent for optimization of FCM because it is not visible significant differences between the optimization methods are used in the results presented, and method PSO is faster than GA (Castillo, 2012). K-means is a widely used partition clustering method. While there are considerable research efforts to characterize the key features of K-means clustering, further investigation is needed to reveal whether the optimal number of clusters can be found on the run based on the cluster quality measure. (Shafeeq, 2012).