uセRQ@ サェ[セQRュ@ セセヲTDZゥャャセ@ Vol. 21 No.2
2006
1rz
JJ
ADVANCES IN EAHTH SCJENCE Feb. ,2006SエセセMi_スZ@ IOOI-8166( 2006 )02-0192-09
Land Cover Change and Coastal Spatial Zoning in
Aceh .. Indonesia in the Aftermath of the Tsunami"
Ernan
Rusliadi' , Dyah R. Panuju',
B.
H.
Trisasongkol,
Ruchyat Deni Djakapermana
2.( ). CCIl!cr fiJr Regi[):uti SrstC'ms Analysis, P!al/fling and Dcveiopment( CRESTPENT) ,Bogor Agricultural University;
2. Directorate of National Spatial Planning, Ministry of Public Works, Bogor 16001, Indonesia)
Abstract: On 26 dセ」・ュ「・イ@ 2004 the biggest earthquake in 40 years occured between the Australian plate
and Eurasian plate in the Indian Ocean. The quake triggered a tsunami (series of large waves) that
spreau out to several coastal cities in Nangroe Aceh Darussa!am Province, including ils Capital, セ。ョ、。@
Aceh City. In this region over 120000 lives have lost and I million is homeless. Based on analysis
re-mote sensing datu (preliminary report of LAPAN) , more than 120000 hm2 of land are damaged. In
Ban-da Aceh City, the changes of fishponds, residential areas and conservation areas (mangrove and other forest) were dominated the land use/cover changes. These three land use/covers were decreased ubout 61. 5% , 57.8% and 77.6% from the former respectively. The central government is preparing a new coastal spatial planning which promotes a buffer zone (about 2 km hum the seashore) in the formerly most dense areas. Many groups of coastal communities and NCOs are asking for the involvement cf local community in decision making process.
In order to select and adopt the best use of the land. the coastal spatial zoning in the aftermath of the
tsunami shculd determine several basic issues. This study is focusing on Banda. Aceh City as center of many socio-economic activities. This study examines the changes of land use-cover (including physical dt'l.maees) due to the impact of tsunami especially for agriculture and settlement uses and analyzes the
ty-pology of affected カゥャャ。ァセウ@ based on land use!cover changes and socioeconomic aspects. Moreover, this
study examines the government spal ial planning in the aftermath of tsunami and the local people needs to
seek some sustainable options for the future spatial arrangements.
Key words: Tsunami; Coastal; Spatial Zoning; Aceh; Land use changes
CLC number: XI44 Document code: A
province. The provincial capital of Banda Aceh is
Introduction
clearly the largest and most lively city in the region.
A-Aceh is the northernmost province on Sumatra and bout 70% of the city areas are situated on a landform
in Indonesia. Banda Aceh is the capital of Aceh Prov- system with elevation less than 10 meter above mean
ince. located at the North-edge of the province, facing sea level.
the Indian Ocean, and also the main gateway to the On 26 December 2004 the biggest earthquake for
Receive date: 2005·1 2-20.
Biography: Eman Ruslin.li. E·mail: enum@ indo. neL id
193
セQR@
WI
[man Huslialli: LanJ COI'er Chanb'C anJ Coastal Spalial Zoning in Aceh-Indonesia in the Aftermalh of the Tsunami40 years had occured between the Australian and
Eura-sian plates in the Indian Ocean. The quake triggered a
tsunami and hit several coastal cities in Nangroe Aceh Darussalam and North Sumatra Provinces. including
Banda Aceh City and Nias Archipelago. According to government report on 2 May 2005. in this region
126 602 were reported dead and 93 638 inhahitants are mising and over than 500 000 persons have internally
displaced. Government and World Bank ・ウセゥュ。エ・@
phys-ical loss and damage in 16 affected districts at more
ihan Rp 41 trilli<ms or uroilnd US $ 4.3 billions, an
11-mount equivalent to 2. 7 % of Indonesia's Gross
Do-mestics Product and over 97% of GDP for Aceh Prov-ince.
Based on remote sensing data analysis. Indone-sian Institute for Space and Aeronautics (LAPAN) has
indicated that more than 120 000 hm2 of land are
dam-aged, which consist of settlement (21 % ), fishpond ( 17% ), ricefield (28%), plantation and shrubs ( 28 %) and open space (5 % ). These land uselcov!:!r
changes have a significant impact on future socioeco-nomics activities of Aceh people. Tne central govern-ment has launched Master Plan for the Rehabilitation and Reconstruction of Nagroe Aceh Darussalam Prov-ince (NAD) and Nias Islands, North Sumatera.
The planning for recovery initiates three stages program for Aceh recovery, namely: resc'je, rehabili-tation and recollstruction programes: The Ministry of
National Development Planning has developed a com-prehensive plan to rebuild the lives of the people of Aceh and Nias.
This study examines the changes of land use-cover ( including physical damages) due to the impact of
tsu-nami especially for agriculture and settlement uses and analyzes the typology of affected villages based on land
uselcover changes and socioeconomic aspects. Moreo-ver, this study examines the government spatial plan-ning in the aftermath of tsunami and the local people
needs to seek some sustainable options for the future spatial arrangements.
Methods
Generally, areas located about 2 - 3 km from the seashore were severely affected by tsunami. In order to
take into account several location farther this area that also affected, this study examines land use-cover
chan-ges in the areas which have distance 5 km from the seashore of Banda Aceh City.
All spatial data in this exercise are hased on the hase maps and remote sensing data, Base maps have been obtained from various institutes including National Agency for Survey and Mapping { Hakosurtanal) and
Ministry of Public Works. The data represent latest condition before the hit of tsunami, The most important infonnation extracted flOm the maps is road networks
and location of hridges. All data have been digitized to allow further spatial analyses, and built into a database
consists of both con ventional maps and space maps from remote sensing data.
Remote sensing data are monumental for this work. The data allow fast recognition and mapping in coastal zone affected by tsunami. UNOSAT contributes much of these data through Working Group for Aceh
Recovery (WGAR), Bogor Agricultural University_ However, this paper presents work on QuickBircl
Multi-spectral imageries; consist of two acquisitions i. e. 23
June 2004 (prelbefore) and 30 December 2004 ( posVafter tsunami). Preprocessing is required to make up the data to allow more precise infonnation ex-tlaction. This include::; geometric rectification to have
best fit for both images. We achieve less than 1 ーゥク・ャセ@
shift in this work and conclude that the processing is reliable enough to have high precision. Due to
Quick-bird's nature as highest spatial resolution for civilian application, we rely on visual inspection for
informa-tion extracinforma-tion. In order to ease the inspection, we
constantly used natural color scheme as primary dis-play.
3 Land Use/Cover Changes and
Villa-ges Typology
According to Shoshany and Goldshleger rI], land
use changes and their causal factors form highly
com-plex system are composed of three main subsystems:
socio-economic, bio-chemical and governmental. It is
congruent to the Barlowe's concept (2] namely three
folds model that h&ve to be considered to ensure sus-tainable land use: biuphysical suitability,
194
.,
nomical feasibility and institutional acceptability. The
two concepts are highly linked each other, and the
similarity that there would be no guarantee on the
sus-tainability of land use if one of the three components
were not exist.
Table 1 Land Use of pre and post Tsunami of study
area (:5 km from s.tashore)
Pre (23 -Joo I»)
ros!
(lJ -Dec I») Dlange; Land Uschm2 % hm2 % %
Conservlliioll 742.5 13.40 166.6 3.01 10.4
Induslry/Commereiull&,,·ices 678.9 12.25 403.4 U6 :1. !i
Paddy Field 779.5 14.07 351.3 6.34 -7.7
Fishpond, 1354.4 24.44 521.7 9.41 15.0
Residenlia) 1207.5 21.79 510.3 9.21 -12.6
U"land Agricuhure 336.0 6.06 93. g 1.69 -4.4
Water Body 442.5 7.99 1430.6 25.82 17.8
Ruins 0.0 0.00 912.0 16.46 16.5
oーBセ@ Space ·(J.G 0.00 1091.6 19.70 19.7
TOTAL 554U 100.00 5541.4 100.00
Natural disaster in Aceh significantly changed
bio-physical properties of the natural resources. Land use
ュ。ョ。ァセュ・ョエ@ previously developed had dismissed and new land use planning should be rebuilt, particularly
at the coastal zoue such as Banda Aceh Municipal
.
which is considered as one of the worst hit. As alleco-nomic activities are clustered in Banda Aceh Region,
the tsunami highly affects both social and economic
as-pects. In order to plan ャ。ョ、オセウ・ウ@ at Banda Aceh, we should comprehend land use pattern and social
activi-ties in the past.
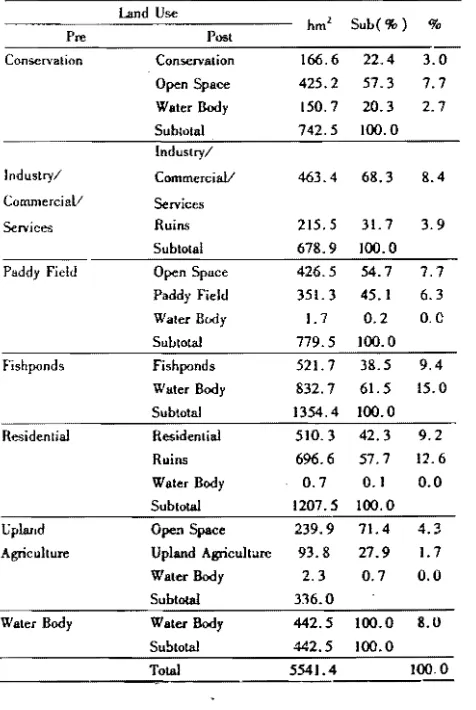
Tsunami had caused significant impact on land
use pattern in coastal areas of Banda Aceh Municipal.
Table 1 describes land use changes caused by tsunami.
TIle changes of fishponds, residential areas and
conser-vation areas (mangrove and other forest) were
domina-ted the land use/cover changes. These three land use!
covers were decreased about 61. 5%, 57. 8% and
77.6% from the former r.espectively (Table 2). About
61.5% fishponds has changed into water bodies (open
water surface or swamp). Most of fishponds are located
within radius of 2 km from seashore (Table 3).
About 57. 7% of residential areas are totally
de-stroyed. The biggest destruction of residential areas
were located within radius of 1 - 3 km from !';eashore
which constitutes more than 540 hm2 of residential
are-as. While 57. 3% and 20. 3% of conservation areas
(forest/vegetationf.mangrove) have eliminated and
be-came open spaces and water bodies respectively. Some
terrestrial areas have been lost and became sea body t
meaning that there were so many changes in coastal
re-glOn.
t。「ャセ@ 2 lセュ、@ use cbang(!S in !he aftermath of Tsunami
Land Use
hm' Sub(% ) %
Pre Post
Conservation Conservation 166.6 22.4 3.0
Open Space 425.2 57.3 7.7
Waler Body 150.7 20.3 2.7
Subtotal 742.5 100.0
Industryl CommerciaV 463.4 68.3 8.4
Commercial! SeIVices
SeIVices Ruins 215.5 31. 7 3.9
Subtotal 678.9 100.0
Paddy Field Open Space 426.5 54.7 7.7
Paddy Field 351. 3 45.1 6.3
Waler Body 1.7 0.2 0.0
Subtotal 779.5 100.0
Fishponds Fishponds 521. 7 38.5 9.4
Water Body 832.7 61.5 15.0
Subtotal 1354.4 100.0
Residenlial Residential 510.3 42.3 9.2
Ruins 696.6 57.7 12.6
Water Body 0.7 0.1 0.0
Subtotal 1207.5 100.0
Gplalld Open Space 239.9 71.4 4.3
Agriculture Upland Agriculture 93.8 27.9 1.7
Water Body 2.3 0.7 0.0
Subtotal 316.0
Waler Body Water Body 442.5 100.0 8.0
Suhtotal 442.5 100.0
Total 5541.4 100.0
According to
b。セョ。ウ@
and Ministry of Public WorkWorking Groups. based on destruction levels the
Ban-da Aceh Municipal could be classified into three
de-struction zones (BWK): most destroyed zone (BWK
I), building stucture damaged zone (BWK II) and
lightly damaged zone (BWK III). Areas in DWK I
zone are characterized by coastal land, aluvium soil,
high risk of flooding, severe drainage problem, and
sa-line water. BWK II is characterized by lowland
land-form, slight slope, highly suitable inigated ricefield,
better quality of water, suitable only for
earthquake-proof building. BWK III is located on upland landform
[image:3.614.58.284.192.358.2] [image:3.614.307.545.218.573.2]195
m2WJ
Eman RustiaJi: Land Cover Change and Coastal Spalial Zoning in a」・ィセャョ、ッョ・ウゥ。@ in the Mtennalh of the Tsunamiground water. highly suitable for agriculture. and
high-ly suitable soil physics for construction. Statistical
clustering technique was employed in attempt to
char-acterize the typology of 52 coastal villages in the study
area. The villages were clustered into map spatial
dis-trihution of villages based on previous (pre-disaster)
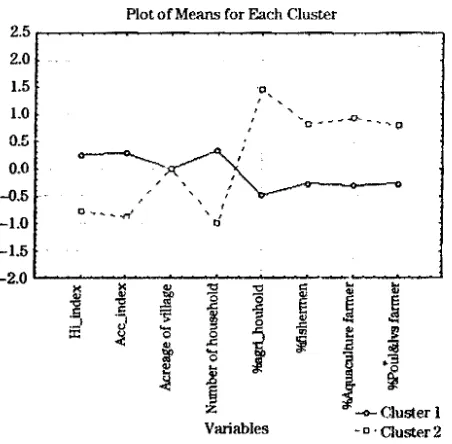
social activities. The clustering procedure were
em-ployed the following varial>les: Central Hierarchy
In-dcx, aceessibility index to service center, number of
households, percentage of farmers, percentage of
fish-ermen alld percentage of livestock fanners. Figure 1
describes tree diagram of the cluster analysis resulting
two types of viUage. The characteristics of each type
could be identified according to Figure 2. Village (or
Desa) type 1 comprises 39 villages were characterized
by periphery villages, and dominated by
farmers/fish-ermen communities (rural area type). Village type 2
comprises 13 villages and characterized by high access
to service cer,te", and domindtion of nun dgricLJit'llul
activities (urban area type). Figure 3 describes the
spatial distribution of rural and urban areas based on
. the result of clustering analysis.
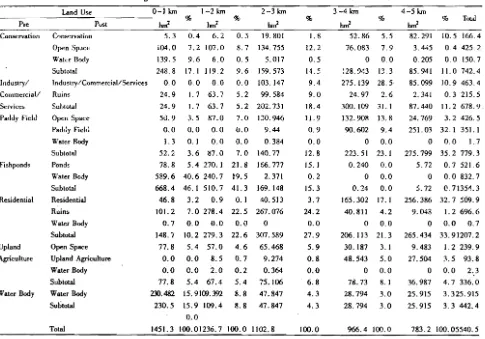
Table 3 Land use changes in the aftermath or Tsunami within several radius areas rrom seashore
2-3 km 3-4 km
% % % Tolal
Land Use
bm2 bm2
Pre Pust
Conservation Cllns"!rvation 5.3 0.4 6.2 0 . .5 19.801 1.8 52.86 5.5 82.291 10.5 166.4
Open Sp.1c<: i04.0 7.2 107.0 8.7 134.755 12.2 76.083 7.9 3.445 0.4 425.2
Wat"r Dody 139.5 9.6 6.0 0.5 5.017 0.5
o
0.0 0.205 0.0 150.7Subtotal 248.8 17.1 119.2 9.6 159.573 14.5 ZRXN_セS@ 13.3 85.941 11.0 742.4
Industry/ Industry/CommerciatiServices 0.0 0.0 0.0 0.0 103.147 9.4 275.139 28.5 85.099 10.9 463.4
Commerciatl Ruins 24.9 1.7 63.7 5.2 99.584 9.0 24.97 2.6 2.341 0.3 215.5
Services 5uhlotal 24.9 1.7 63.7 5.2 202.731 18.4 300.109 31. I 87.440 tl.2 678.9.
Paddy Field Open Space 50.9 3.5 87.0 7.0 DO.946 II. 9 132.908 13.8 24.769 3.2 426.5
PadJy FielJ 0.0 0.0 0.0 U.O 9.44 0.9 90.602 9.4 251. 03 32.1 351. I
Waler Body 1.3 0.1 0.0 0.0 0.384 0.0
o
0.0o
0.0 1.7Subtotal 52.2 3.6 l!7.0 7.0 140.77 12.8 223.51 23. I 275.799 35.2779.3
Fishponds Ponds 78.8 5.4 270. I 21.8 166.777 15.1 0.240 0.0 5.72 0.7521.6
Water Body 589.6 40.6 240.7 19.5 2.371 0.2
o
0.0 o 0.0 832.7Subtotal 668.4 46. I 510.7 41.3 169.148 15.3 0.24 0.0 5.72 qNWQSUセNS@
Residential Residential 46.8 3.2 0.9 O. I 40.513 3.7 165.302 17.1 256.386 32.7509.9
Ruins 101.2 7.0 278.4 22.5 267.076 24.2 40.811 4.2 9.043 1.2 696.6
Water Body 0.7 0.0 0.0 0.0 0 0.0 o 0.0
o
0.0 0.7Subtotal 148.7 10.2 279.3 22.6 307.589 27.9 206.113 21.3 265.434 33.91207.2
Upland Open Space 77.8 5.4 57.0 4.6 65.468 5.9 30.187 3. I 9.483 1.2 239.9
Agriculture Upland Agriculture 0.0 0.0 8.5 0.7 9.274 0.8 48.543 5.0 27.504 セNU@ 93.8
Water Body 0.0 0.0 2.0 0.2 0.364 0.0
o
0.0o
0.0 2.3Subtotal 77.8 5.4 67.4 5.4 75.106 6.8 78.73 8.1 36.987 4.7 336.0
Waler Body Water Body 230.482 15.91(1).392 8.8 47.847 4.3 28.794 3.0 25.915 3.325.915
Subtotal 230.5 15.9 109.4 8.8 47.847 4.3 28.794 3.0 25.915 3.3 442.4
0.0
Total 1451.3 100.01236.7 100.0 1102.8 100.0 966.4 100.0 783.2 100.05540.5
Another clustering technique was also employed in
attempt to describe the typology of villages based on
land use/cover changes or impact of disaster. This
technique was applied to following variables: acreage
of village (hm2 ) , changes of conservation areas ( % ) ,
dmnges of commerciallindustriallservices( % ) •
chan-ges of paddy field areas ( % ), changes of fishponds
( % ), challges of upland agricultuCllI areas (% ) ,
changes of water body ( % ), and changes of open
space( % ).
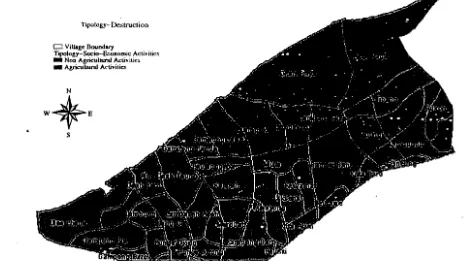
Figure 4 presents tree diagram of the cluster
anal-ysis and results two types of iand use changes
(destruc-tion types). The 」ィ。イ。」エ・イゥウセェ」ウ@ of each type were i-dentified according to Figure 5. Type-I which
compri-ses 16 villages were consist of villages had experien.::ed
[image:4.614.53.538.292.631.2]196
-1.5
30
25
II>
0 20
c rn
-
til5 15
«I)
0}
rn
セ@
c 10 ::J
5
0
Fig. 1 Tree diagram to identify socio-activities of villages in Study Area
Plot of Means for Each Cluster Deah glumpang, Deah Raya, Gampong Jawa, Gam- 2.5 イMセMセMBBMMセセセMセセセMMGMャ@
2.0
1.5
, ,
,
1.0
I ""o..o' ... MセM .... o 0.5
0.0
-0.5 -1.0
-2.0 lMNMNNNNMMMZセMMZセMM[Bエャ]MMZZZZMM[ZZM t it
セ@ セ@
I
0セ@
セ@
d
セ@
-a
1
!
j
f ]<
f
I
セ@
1
セ@
j
-!
セ@
... Cluster I
Variables D • Cluster 2
Fig. 2 Plot of standardized mean of variables for 2 types of socio-activities in 52 villages
(changing) 'of conservation area, services area, fish-ponds and residential areas. This decreasing was
fol-lowed by the appearance of open space, water (sea) body and ruined area. This type of villages consist of
Alue Deah Teung, Ahle Naga, Hlang Oi, Deah Baro,
pong Pande, Gampong Pie, Keudah, Lambaro skep, Lambung, Lampaseh Aceh. La!1lpulo. Peulanggahan, and Ulee Lheue villages (Figure 6). The type 2 areas
comprise of 25 villages and characterized by moderate'
destruction.
4 Spatial Planning
Inthe Aftermath of
the Tsunami
As the major aspect in spatial planning, land use planning is the systematic assesment of resources in
or-der to select and adopt the best land use options that will best meet the needs of the people while safeguard-iug resources for the future.
Zoning is one of the most commonly tools in
coast-al planning and management. Basiccoast-ally. zoning pro-vides a simple mechanism for urban planners to
in-tegrate complex and competing demands and land uses
on to a ウゥョァャ・セーャ。ョ@ or map and zoning plans provide an
effective tool for communicating implicit and often
com-plicated management objectives to the community in an
[image:5.614.110.497.116.377.2] [image:5.614.61.287.421.643.2]::l '!:'I A
...,
セ@ ('I) ;'g. l1'l.,
I» 3 0 , :S,;:
セ@
a' Dl til セ@ 0 :I ; :I g.=
""
,.,
'"
::r Col ::t セ@,.,
::r Col CJ,.,
..
.,
[.ii' セN@ Peuniti Rukoh Pineung Kuta Barn KutaAlam Kopelma Darussa Beurawe Lampaseh Kota Keuramat I..am$lgcb Merduati Kamoumz Barn Lamdingin Jeulingke Punge Jurong BandarBaru PungeUjong Punge Blang Cut Larnjabat Lampaseh Aceh LambamSkep Keudah TIbang Gampong Baro Cot Lamkuweueh Lambung BlangOi Peunayong Mulia Laksana DeehRaya A1ueNaga Gampong Pande Peulanggahan Gampong Jawa Uleeilleue Lampuio GampongPie Deah G\umpang DeahBaro Alue Deah TeungLinkage Distance
,...
0 en
o
-
en セ@ セ@ 1:5セ@
セJE@
WI:.iO
::l 0:00::.;>zl<:
'!:'I ZZjNZZャセ@ セ@
V.l
2
> 10:::;,OC セセ@
r.: ::l,/\ _
m U'l
'C
2.
E.
0' gI» ;.-c l [
C'.
n
E.
キセe.
セZ^ァ'C
セGァLセ
セ@ _,n« -,
.,
'"
g>II> n== 1:',
5'., セ
.
.,
I: i'i'
a' '"
Col == I» == g.
2
.,
,
e.
セN;:
"'"' t::1
"
セ@ a'セ@
g. 0 := Qi
('I) ::I. !IQ..
[
セ@ == .Q=
('I) :.i"8
0-0<1 '<r
I0' I
W
0 ::I 0 E, n > n 1:', :0, g. '" N tTl :J'"
'"
:::0 c \!l. Ci;',
c.."
セ@ 0... n S; セ@ n ::r !ll セ@..
セ@ n セ@ E:. U'> セ@e.:
セ@ S'"
O'Q S' > セ@ 7" [. 0'"
0: iii' 5' :r"
>- ::-("I) 3..
:re..
:r...
;;l"
セL@ 1.0 .l Nセ@ "l
f
0'..,
...
-セ@ ;21
Q. ::t! i>r
_. r.> セ@
セ@
.,
セ@セ@ セ@ セN@
e:
:3 [;[It '" S'
セ@ セ@
QI198
Plot of Means for Each elliS!!'!
2.0
1.5
1.0
0.5 Q
\ 0.0
co
-0.5
-1.0
-1.5 ...:
セ@
t::! ...:
'
-c
S
i::
...
セ@
0
u
*'
'"C
....
'"
セ@
c:!:
fiI
'"C
C
;,
r:....
>.
"0
セ@
*'
"0
'"
'"C C
0
P.
セG@
...
u
'"
...
"0
'iii
P::
セG@
"0
...
""
...:
セ@
セG@
IE
セ@
セG@
'"C
I;/j
[;
セ@
<:>
セG@
U)
'"
セ@
i
'"C
r=.
'"C -c-Cluster 1Variables -c-Cluster 2
Fig. S Flot of standardized mean of variables for 2
type "f land use changes (destruction type) of S2
villages in the study area
The effectiveness of a zoning plan will ulitimately
rely on the community's acceptance and government's
commitment to provide the resources to implement.
There are two conditions must be met if planning is
considered usefuII: (1) the need for changes, must be
Tipology- Destruction
D Village .BouDdvy
TlPOlogy-Socio-llconoll1K: Activities
_ Non AgricullUral Aclivitie.
_ AgricullUral Activities
s
u(;(;epted I,y the people involved. (2) the political will
and ability to put the plan into affect 14 J, Studies have
shown lhat where the public has heen actively and
meaningfully involved in the planning process there is a
greater acceptance of the plan, its regulation anti their implementation '5 -8 J ,
Therefore, Disaster Risk Reduction and Hecovery
Aetivities (including spatial planning) should be based
of the involvement of local institutions. The Panglima
Laot (The Sea Admiral) or Chieftains of the coastal
and fishing commullities is one of some lesser-known
traditional institutions because of decades of uniformity
of government structure, Their togetherness has
reflec-ted through their organization Lembaga Adat Panglima
Laot Provinsi Nanggroe Aceh Darussalam which made
easier for outside organization to assist and work with
them. Facilitated by Yayasan Laut Lestari and Bogor
Agricultural University, on 19-20 February 2005 they
were able to gather remaining resources they had to
as-sist survivorS. The meeting launched several points of
recommendation on Aceh Recovery and the ongoing
Governments planning process [9J.
[image:7.614.65.298.91.309.2] [image:7.614.54.520.470.731.2]199
,
;:(l2WJ Eman Rustiadi: Land Cover Chang(' and Coastal Spatial Zoning in Arch·lndonesia in the Aflennath of the Tsunami
The Master Plan proposed hy Central Government
( Bapenas) gives special attention to spatial
arrange-ment issues and offers draft plans on how to use space
in affected districts or municipals. Local governments
are inviteu to build on the drafts as they develop
ue-tailed spatial plans in <:lose consultation with
communi-ties. The primary aims of the process are to ensure that
dS UT(>"S, eilil's, regions, and ウ[セエエャ・ュ・ョエウ@ are rebuilt, living ('onditions are improved and property are
safe-guarded in the event of future disasters. Business
cen-ters, social services, and den:sely puptllako urball
:set-tlements are best located in tsunami-proof zones. for
example. With the emergency relief efforts concluded,
the Master Plan will guide efforts or activities over the
next five rars. Master Plan is a policy and strategy
document that will guide onguing dialogue, planning,
anu action it is not designed to be a finished blueprint.
In short, the Plan promotes: locally and cultural
ap-propriate solution, community participation and broad
stakeholder input, holistics and integrated approaches,
transparency, accountability and effectiveness.
5 Land Use Planning and Zoning
Spatial zoning considered as a tool often used to
manage region in an efficient and effective way. The
master plan promotes 9 zones, namely: (1) coastal
zone, (2) fishery culture zone. (3) city garden. (4)
settlement, (5) city center/landmark, (6) new
settle-ments areas, (7) new bussines and I)ffices center,
( 8) education areas, and (9) agriculture. The coastal
zone functions mainly as buffer zone (wave/wind
breaker), and located within 300 - 400 meters from
coastal line. The aquaculture' areas mainly serves as
fishery (ponds) activities and as the second wave
breaker and fisherman housing. This area located in
the range about 1300 m from the first zone line. City
Garden/Public Greenery areas are the third buffer
are-a, and utilized as public space and city garden.
Settle-ment areas function as a limited settleSettle-ment and public
facilities centers. The City Landmark is the location of
main city landmarks (Baiturrahman Mosque, Museum
of Tsunami and other dty landmarks), local
goven-ment offices, and Cultural Centers. New settlegoven-ment
ar-eas function as new housing complex of the relocated
inhabitants (formerly were living closed area to the
seashore), new selliements areas. New bussines arid
offices centers are promoted as the city and province
service centers (CBO and government offices).
Edu-cation Center areas function as loEdu-cation og high
educa-tion campus and its supporting facilities. Agricultural
areas function as agriculture production areas, rural
sclliements and their supporting facilities.
The three buffer zones (about 2 km from the
sea-shore) are located in the formerly most dense areas.
Many groups of coastal community and NGOs arc
ask-ing for the involvement of local community in decision
making process. According to National Land Agency
( BPN) assesmenl, within the promoted buffer meas,
amount of 8 795 houses were located (Table 4) which
some of them have been ruined. During the planning
process, many of inhabitants have started to claim and
build their own new houses.
6
Conclusion Remarks
Tsunami has significant impact on land use pattern
in coastal areas of Banda Aceh City. The changes of
fishponds, residential areas and conservation areas
( nlangrove and other forest) were dominated the land
use/cover changes. These three land use/covers were
decreased about 61.5% , 57.8% and 77,6% from the
former respectively. Most of destructed villages in
coastal areas of the city formerly were developed as
ur-ban and very dense areas.
The effectiveness of government spatial planning
will ultimately rely on the communitys acceptance and
government s commitment to provide resources to
imple-ment. The government promoted buffer zones (about 2
km from seashore) are located in the formerly most
ur-banized dense areas. To implement this planning.
community based participatory planning process is
nee-ded.
References:
[ 1] Slloshany M, G<.ldhlcger N. Land Use and population density
changes in israel·] 950 to 1990: Anatysis of regional and local
trends[J]. Land Use Policy ,2002 ,19: 123-133.
[2 J Barlowe H. Land Hesourees Economics [ M J. London: Prentice Hall Internalional, tnc ,1986.
uセRQ@ サェ[セQRュ@ セセヲTDZゥャャセ@ Vol. 21 No.2
2006
1rz
JJ
ADVANCES IN EAHTH SCJENCE Feb. ,2006SエセセMi_スZ@ IOOI-8166( 2006 )02-0192-09
Land Cover Change and Coastal Spatial Zoning in
Aceh .. Indonesia in the Aftermath of the Tsunami"
Ernan
Rusliadi' , Dyah R. Panuju',
B.
H.
Trisasongkol,
Ruchyat Deni Djakapermana
2.( ). CCIl!cr fiJr Regi[):uti SrstC'ms Analysis, P!al/fling and Dcveiopment( CRESTPENT) ,Bogor Agricultural University;
2. Directorate of National Spatial Planning, Ministry of Public Works, Bogor 16001, Indonesia)
Abstract: On 26 dセ」・ュ「・イ@ 2004 the biggest earthquake in 40 years occured between the Australian plate
and Eurasian plate in the Indian Ocean. The quake triggered a tsunami (series of large waves) that
spreau out to several coastal cities in Nangroe Aceh Darussa!am Province, including ils Capital, セ。ョ、。@
Aceh City. In this region over 120000 lives have lost and I million is homeless. Based on analysis
re-mote sensing datu (preliminary report of LAPAN) , more than 120000 hm2 of land are damaged. In
Ban-da Aceh City, the changes of fishponds, residential areas and conservation areas (mangrove and other forest) were dominated the land use/cover changes. These three land use/covers were decreased ubout 61. 5% , 57.8% and 77.6% from the former respectively. The central government is preparing a new coastal spatial planning which promotes a buffer zone (about 2 km hum the seashore) in the formerly most dense areas. Many groups of coastal communities and NCOs are asking for the involvement cf local community in decision making process.
In order to select and adopt the best use of the land. the coastal spatial zoning in the aftermath of the
tsunami shculd determine several basic issues. This study is focusing on Banda. Aceh City as center of many socio-economic activities. This study examines the changes of land use-cover (including physical dt'l.maees) due to the impact of tsunami especially for agriculture and settlement uses and analyzes the
ty-pology of affected カゥャャ。ァセウ@ based on land use!cover changes and socioeconomic aspects. Moreover, this
study examines the government spal ial planning in the aftermath of tsunami and the local people needs to
seek some sustainable options for the future spatial arrangements.
Key words: Tsunami; Coastal; Spatial Zoning; Aceh; Land use changes
CLC number: XI44 Document code: A
province. The provincial capital of Banda Aceh is
Introduction
clearly the largest and most lively city in the region.
A-Aceh is the northernmost province on Sumatra and bout 70% of the city areas are situated on a landform
in Indonesia. Banda Aceh is the capital of Aceh Prov- system with elevation less than 10 meter above mean
ince. located at the North-edge of the province, facing sea level.
the Indian Ocean, and also the main gateway to the On 26 December 2004 the biggest earthquake for
Receive date: 2005·1 2-20.
Biography: Eman Ruslin.li. E·mail: enum@ indo. neL id
193
セQR@
WI
[man Huslialli: LanJ COI'er Chanb'C anJ Coastal Spalial Zoning in Aceh-Indonesia in the Aftermalh of the Tsunami40 years had occured between the Australian and
Eura-sian plates in the Indian Ocean. The quake triggered a
tsunami and hit several coastal cities in Nangroe Aceh Darussalam and North Sumatra Provinces. including
Banda Aceh City and Nias Archipelago. According to government report on 2 May 2005. in this region
126 602 were reported dead and 93 638 inhahitants are mising and over than 500 000 persons have internally
displaced. Government and World Bank ・ウセゥュ。エ・@
phys-ical loss and damage in 16 affected districts at more
ihan Rp 41 trilli<ms or uroilnd US $ 4.3 billions, an
11-mount equivalent to 2. 7 % of Indonesia's Gross
Do-mestics Product and over 97% of GDP for Aceh Prov-ince.
Based on remote sensing data analysis. Indone-sian Institute for Space and Aeronautics (LAPAN) has
indicated that more than 120 000 hm2 of land are
dam-aged, which consist of settlement (21 % ), fishpond ( 17% ), ricefield (28%), plantation and shrubs ( 28 %) and open space (5 % ). These land uselcov!:!r
changes have a significant impact on future socioeco-nomics activities of Aceh people. Tne central govern-ment has launched Master Plan for the Rehabilitation and Reconstruction of Nagroe Aceh Darussalam Prov-ince (NAD) and Nias Islands, North Sumatera.
The planning for recovery initiates three stages program for Aceh recovery, namely: resc'je, rehabili-tation and recollstruction programes: The Ministry of
National Development Planning has developed a com-prehensive plan to rebuild the lives of the people of Aceh and Nias.
This study examines the changes of land use-cover ( including physical damages) due to the impact of
tsu-nami especially for agriculture and settlement uses and analyzes the typology of affected villages based on land
uselcover changes and socioeconomic aspects. Moreo-ver, this study examines the government spatial plan-ning in the aftermath of tsunami and the local people
needs to seek some sustainable options for the future spatial arrangements.
Methods
Generally, areas located about 2 - 3 km from the seashore were severely affected by tsunami. In order to
take into account several location farther this area that also affected, this study examines land use-cover
chan-ges in the areas which have distance 5 km from the seashore of Banda Aceh City.
All spatial data in this exercise are hased on the hase maps and remote sensing data, Base maps have been obtained from various institutes including National Agency for Survey and Mapping { Hakosurtanal) and
Ministry of Public Works. The data represent latest condition before the hit of tsunami, The most important infonnation extracted flOm the maps is road networks
and location of hridges. All data have been digitized to allow further spatial analyses, and built into a database
consists of both con ventional maps and space maps from remote sensing data.
Remote sensing data are monumental for this work. The data allow fast recognition and mapping in coastal zone affected by tsunami. UNOSAT contributes much of these data through Working Group for Aceh
Recovery (WGAR), Bogor Agricultural University_ However, this paper presents work on QuickBircl
Multi-spectral imageries; consist of two acquisitions i. e. 23
June 2004 (prelbefore) and 30 December 2004 ( posVafter tsunami). Preprocessing is required to make up the data to allow more precise infonnation ex-tlaction. This include::; geometric rectification to have
best fit for both images. We achieve less than 1 ーゥク・ャセ@
shift in this work and conclude that the processing is reliable enough to have high precision. Due to
Quick-bird's nature as highest spatial resolution for civilian application, we rely on visual inspection for
informa-tion extracinforma-tion. In order to ease the inspection, we
constantly used natural color scheme as primary dis-play.
3 Land Use/Cover Changes and
Villa-ges Typology
According to Shoshany and Goldshleger rI], land
use changes and their causal factors form highly
com-plex system are composed of three main subsystems:
socio-economic, bio-chemical and governmental. It is
congruent to the Barlowe's concept (2] namely three
folds model that h&ve to be considered to ensure sus-tainable land use: biuphysical suitability,
194
.,
nomical feasibility and institutional acceptability. The
two concepts are highly linked each other, and the
similarity that there would be no guarantee on the
sus-tainability of land use if one of the three components
were not exist.
Table 1 Land Use of pre and post Tsunami of study
area (:5 km from s.tashore)
Pre (23 -Joo I»)
ros!
(lJ -Dec I») Dlange; Land Uschm2 % hm2 % %
Conservlliioll 742.5 13.40 166.6 3.01 10.4
Induslry/Commereiull&,,·ices 678.9 12.25 403.4 U6 :1. !i
Paddy Field 779.5 14.07 351.3 6.34 -7.7
Fishpond, 1354.4 24.44 521.7 9.41 15.0
Residenlia) 1207.5 21.79 510.3 9.21 -12.6
U"land Agricuhure 336.0 6.06 93. g 1.69 -4.4
Water Body 442.5 7.99 1430.6 25.82 17.8
Ruins 0.0 0.00 912.0 16.46 16.5
oーBセ@ Space ·(J.G 0.00 1091.6 19.70 19.7
TOTAL 554U 100.00 5541.4 100.00
Natural disaster in Aceh significantly changed
bio-physical properties of the natural resources. Land use
ュ。ョ。ァセュ・ョエ@ previously developed had dismissed and new land use planning should be rebuilt, particularly
at the coastal zoue such as Banda Aceh Municipal
.
which is considered as one of the worst hit. As alleco-nomic activities are clustered in Banda Aceh Region,
the tsunami highly affects both social and economic
as-pects. In order to plan ャ。ョ、オセウ・ウ@ at Banda Aceh, we should comprehend land use pattern and social
activi-ties in the past.
Tsunami had caused significant impact on land
use pattern in coastal areas of Banda Aceh Municipal.
Table 1 describes land use changes caused by tsunami.
TIle changes of fishponds, residential areas and
conser-vation areas (mangrove and other forest) were
domina-ted the land use/cover changes. These three land use!
covers were decreased about 61. 5%, 57. 8% and
77.6% from the former r.espectively (Table 2). About
61.5% fishponds has changed into water bodies (open
water surface or swamp). Most of fishponds are located
within radius of 2 km from seashore (Table 3).
About 57. 7% of residential areas are totally
de-stroyed. The biggest destruction of residential areas
were located within radius of 1 - 3 km from !';eashore
which constitutes more than 540 hm2 of residential
are-as. While 57. 3% and 20. 3% of conservation areas
(forest/vegetationf.mangrove) have eliminated and
be-came open spaces and water bodies respectively. Some
terrestrial areas have been lost and became sea body t
meaning that there were so many changes in coastal
re-glOn.
t。「ャセ@ 2 lセュ、@ use cbang(!S in !he aftermath of Tsunami
Land Use
hm' Sub(% ) %
Pre Post
Conservation Conservation 166.6 22.4 3.0
Open Space 425.2 57.3 7.7
Waler Body 150.7 20.3 2.7
Subtotal 742.5 100.0
Industryl CommerciaV 463.4 68.3 8.4
Commercial! SeIVices
SeIVices Ruins 215.5 31. 7 3.9
Subtotal 678.9 100.0
Paddy Field Open Space 426.5 54.7 7.7
Paddy Field 351. 3 45.1 6.3
Waler Body 1.7 0.2 0.0
Subtotal 779.5 100.0
Fishponds Fishponds 521. 7 38.5 9.4
Water Body 832.7 61.5 15.0
Subtotal 1354.4 100.0
Residenlial Residential 510.3 42.3 9.2
Ruins 696.6 57.7 12.6
Water Body 0.7 0.1 0.0
Subtotal 1207.5 100.0
Gplalld Open Space 239.9 71.4 4.3
Agriculture Upland Agriculture 93.8 27.9 1.7
Water Body 2.3 0.7 0.0
Subtotal 316.0
Waler Body Water Body 442.5 100.0 8.0
Suhtotal 442.5 100.0
Total 5541.4 100.0
According to
b。セョ。ウ@
and Ministry of Public WorkWorking Groups. based on destruction levels the
Ban-da Aceh Municipal could be classified into three
de-struction zones (BWK): most destroyed zone (BWK
I), building stucture damaged zone (BWK II) and
lightly damaged zone (BWK III). Areas in DWK I
zone are characterized by coastal land, aluvium soil,
high risk of flooding, severe drainage problem, and
sa-line water. BWK II is characterized by lowland
land-form, slight slope, highly suitable inigated ricefield,
better quality of water, suitable only for
earthquake-proof building. BWK III is located on upland landform
[image:11.614.58.284.192.358.2] [image:11.614.307.545.218.573.2]195
m2WJ
Eman RustiaJi: Land Cover Change and Coastal Spalial Zoning in a」・ィセャョ、ッョ・ウゥ。@ in the Mtennalh of the Tsunamiground water. highly suitable for agriculture. and
high-ly suitable soil physics for construction. Statistical
clustering technique was employed in attempt to
char-acterize the typology of 52 coastal villages in the study
area. The villages were clustered into map spatial
dis-trihution of villages based on previous (pre-disaster)
social activities. The clustering procedure were
em-ployed the following varial>les: Central Hierarchy
In-dcx, aceessibility index to service center, number of
households, percentage of farmers, percentage of
fish-ermen alld percentage of livestock fanners. Figure 1
describes tree diagram of the cluster analysis resulting
two types of viUage. The characteristics of each type
could be identified according to Figure 2. Village (or
Desa) type 1 comprises 39 villages were characterized
by periphery villages, and dominated by
farmers/fish-ermen communities (rural area type). Village type 2
comprises 13 villages and characterized by high access
to service cer,te", and domindtion of nun dgricLJit'llul
activities (urban area type). Figure 3 describes the
spatial distribution of rural and urban areas based on
. the result of clustering analysis.
Table 3 Land use changes in the aftermath or Tsunami within several radius areas rrom seashore
2-3 km 3-4 km
% % % Tolal
Land Use
bm2 bm2
Pre Pust
Conservation Cllns"!rvation 5.3 0.4 6.2 0 . .5 19.801 1.8 52.86 5.5 82.291 10.5 166.4
Open Sp.1c<: i04.0 7.2 107.0 8.7 134.755 12.2 76.083 7.9 3.445 0.4 425.2
Wat"r Dody 139.5 9.6 6.0 0.5 5.017 0.5
o
0.0 0.205 0.0 150.7Subtotal 248.8 17.1 119.2 9.6 159.573 14.5 ZRXN_セS@ 13.3 85.941 11.0 742.4
Industry/ Industry/CommerciatiServices 0.0 0.0 0.0 0.0 103.147 9.4 275.139 28.5 85.099 10.9 463.4
Commerciatl Ruins 24.9 1.7 63.7 5.2 99.584 9.0 24.97 2.6 2.341 0.3 215.5
Services 5uhlotal 24.9 1.7 63.7 5.2 202.731 18.4 300.109 31. I 87.440 tl.2 678.9.
Paddy Field Open Space 50.9 3.5 87.0 7.0 DO.946 II. 9 132.908 13.8 24.769 3.2 426.5
PadJy FielJ 0.0 0.0 0.0 U.O 9.44 0.9 90.602 9.4 251. 03 32.1 351. I
Waler Body 1.3 0.1 0.0 0.0 0.384 0.0
o
0.0o
0.0 1.7Subtotal 52.2 3.6 l!7.0 7.0 140.77 12.8 223.51 23. I 275.799 35.2779.3
Fishponds Ponds 78.8 5.4 270. I 21.8 166.777 15.1 0.240 0.0 5.72 0.7521.6
Water Body 589.6 40.6 240.7 19.5 2.371 0.2
o
0.0 o 0.0 832.7Subtotal 668.4 46. I 510.7 41.3 169.148 15.3 0.24 0.0 5.72 qNWQSUセNS@
Residential Residential 46.8 3.2 0.9 O. I 40.513 3.7 165.302 17.1 256.386 32.7509.9
Ruins 101.2 7.0 278.4 22.5 267.076 24.2 40.811 4.2 9.043 1.2 696.6
Water Body 0.7 0.0 0.0 0.0 0 0.0 o 0.0
o
0.0 0.7Subtotal 148.7 10.2 279.3 22.6 307.589 27.9 206.113 21.3 265.434 33.91207.2
Upland Open Space 77.8 5.4 57.0 4.6 65.468 5.9 30.187 3. I 9.483 1.2 239.9
Agriculture Upland Agriculture 0.0 0.0 8.5 0.7 9.274 0.8 48.543 5.0 27.504 セNU@ 93.8
Water Body 0.0 0.0 2.0 0.2 0.364 0.0
o
0.0o
0.0 2.3Subtotal 77.8 5.4 67.4 5.4 75.106 6.8 78.73 8.1 36.987 4.7 336.0
Waler Body Water Body 230.482 15.91(1).392 8.8 47.847 4.3 28.794 3.0 25.915 3.325.915
Subtotal 230.5 15.9 109.4 8.8 47.847 4.3 28.794 3.0 25.915 3.3 442.4
0.0
Total 1451.3 100.01236.7 100.0 1102.8 100.0 966.4 100.0 783.2 100.05540.5
Another clustering technique was also employed in
attempt to describe the typology of villages based on
land use/cover changes or impact of disaster. This
technique was applied to following variables: acreage
of village (hm2 ) , changes of conservation areas ( % ) ,
dmnges of commerciallindustriallservices( % ) •
chan-ges of paddy field areas ( % ), changes of fishponds
( % ), challges of upland agricultuCllI areas (% ) ,
changes of water body ( % ), and changes of open
space( % ).
Figure 4 presents tree diagram of the cluster
anal-ysis and results two types of iand use changes
(destruc-tion types). The 」ィ。イ。」エ・イゥウセェ」ウ@ of each type were i-dentified according to Figure 5. Type-I which
compri-ses 16 villages were consist of villages had experien.::ed
[image:12.614.53.538.292.631.2]196
-1.5
30
25
II>
0 20
c rn
-
til5 15
«I)
0}
rn
セ@
c 10 ::J
5
0
Fig. 1 Tree diagram to identify socio-activities of villages in Study Area
Plot of Means for Each Cluster Deah glumpang, Deah Raya, Gampong Jawa, Gam- 2.5 イMセMセMBBMMセセセMセセセMMGMャ@
2.0
1.5
, ,
,
1.0
I ""o..o' ... MセM .... o 0.5
0.0
-0.5 -1.0
-2.0 lMNMNNNNMMMZセMMZセMM[Bエャ]MMZZZZMM[ZZM t it
セ@ セ@
I
0セ@
セ@
d
セ@
-a
1
!
j
f ]<
f
I
セ@
1
セ@
j
-!
セ@
... Cluster I
Variables D • Cluster 2
Fig. 2 Plot of standardized mean of variables for 2 types of socio-activities in 52 villages
(changing) 'of conservation area, services area, fish-ponds and residential areas. This decreasing was
fol-lowed by the appearance of open space, water (sea) body and ruined area. This type of villages consist of
Alue Deah Teung, Ahle Naga, Hlang Oi, Deah Baro,
pong Pande, Gampong Pie, Keudah, Lambaro skep, Lambung, Lampaseh Aceh. La!1lpulo. Peulanggahan, and Ulee Lheue villages (Figure 6). The type 2 areas
comprise of 25 villages and characterized by moderate'
destruction.
4 Spatial Planning
Inthe Aftermath of
the Tsunami
As the major aspect in spatial planning, land use planning is the systematic assesment of resources in
or-der to select and adopt the best land use options that will best meet the needs of the people while safeguard-iug resources for the future.
Zoning is one of the most commonly tools in
coast-al planning and management. Basiccoast-ally. zoning pro-vides a simple mechanism for urban planners to
in-tegrate complex and competing demands and land uses
on to a ウゥョァャ・セーャ。ョ@ or map and zoning plans provide an
effective tool for communicating implicit and often
com-plicated management objectives to the community in an
[image:13.614.110.497.116.377.2] [image:13.614.61.287.421.643.2]::l '!:'I A
...,
セ@ ('I) ;'g. l1'l.,
I» 3 0 , :S,;:
セ@
a' Dl til セ@ 0 :I ; :I g.=
""
,.,
'"
::r Col ::t セ@,.,
::r Col CJ,.,
..
.,
[.ii' セN@ Peuniti Rukoh Pineung Kuta Barn KutaAlam Kopelma Darussa Beurawe Lampaseh Kota Keuramat I..am$lgcb Merduati Kamoumz Barn Lamdingin Jeulingke Punge Jurong BandarBaru PungeUjong Punge Blang Cut Larnjabat Lampaseh Aceh LambamSkep Keudah TIbang Gampong Baro Cot Lamkuweueh Lambung BlangOi Peunayong Mulia Laksana DeehRaya A1ueNaga Gampong Pande Peulanggahan Gampong Jawa Uleeilleue Lampuio GampongPie Deah G\umpang DeahBaro Alue Deah TeungLinkage Distance
,...
0 en
o
-
en セ@ セ@ 1:5セ@
セJE@
WI:.iO
::l 0:00::.;>zl<:
'!:'I ZZjNZZャセ@ セ@
V.l
2
> 10:::;,OC セセ@
r.: ::l,/\ _
m U'l
'C
2.
E.
0' gI» ;.-c l [
C'.
n
E.
キセe.
セZ^ァ'C
セGァLセ
セ@ _,n« -,
.,
'"
g>II> n== 1:',
5'., セ
.
.,
I: i'i'
a' '"
Col == I» == g.
2
.,
,
e.
セN;:
"'"' t::1
"
セ@ a'セ@
g. 0 := Qi
('I) ::I. !IQ..
[
セ@ == .Q=
('I) :.i"8
0-0<1 '<r
I0' I
W
0 ::I 0 E, n > n 1:', :0, g. '" N tTl :J'"
'"
:::0 c \!l. Ci;',
c.."
セ@ 0... n S; セ@ n ::r !ll セ@..
セ@ n セ@ E:. U'> セ@e.:
セ@ S'"
O'Q S' > セ@ 7" [. 0'"
0: iii' 5' :r"
>- ::-("I) 3..
:re..
:r...
;;l"
セL@ 1.0 .l Nセ@ "l
f
0'..,
...
-セ@ ;21
Q. ::t! i>r
_. r.> セ@
セ@
.,
セ@セ@ セ@ セN@
e:
:3 [;[It '" S'
セ@ セ@
QI198
Plot of Means for Each elliS!!'!
2.0
1.5
1.0
0.5 Q
\ 0.0
co
-0.5
-1.0
-1.5 ...:
セ@
t::! ...:
'
-c
S
i::
...
セ@
0
u
*'
'"C
....
'"
セ@
c:!:
fiI
'"C
C
;,
r:....
>.
"0
セ@
*'
"0
'"
'"C C
0
P.
セG@
...
u
'"
...
"0
'iii
P::
セG@
"0
...
""
...:
セ@
セG@
IE
セ@
セG@
'"C
I;/j
[;
セ@
<:>
セG@
U)
'"
セ@
i
'"C
r=.
'"C -c-Cluster 1Variables -c-Cluster 2
Fig. S Flot of standardized mean of variables for 2
type "f land use changes (destruction type) of S2
villages in the study area
The effectiveness of a zoning plan will ulitimately
rely on the community's acceptance and government's
commitment to provide the resources to implement.
There are two conditions must be met if planning is
considered usefuII: (1) the need for changes, must be
Tipology- Destruction
D Village .BouDdvy
TlPOlogy-Socio-llconoll1K: Activities
_ Non AgricullUral Aclivitie.
_ AgricullUral Activities
s
u(;(;epted I,y the people involved. (2) the political will
and ability to put the plan into affect 14 J, Studies have
shown lhat where the public has heen actively and
meaningfully involved in the planning process there is a
greater acceptance of the plan, its regulation anti their implementation '5 -8 J ,
Therefore, Disaster Risk Reduction and Hecovery
Aetivities (including spatial planning) should be based
of the involvement of local institutions. The Panglima
Laot (The Sea Admiral) or Chieftains of the coastal
and fishing commullities is one of some lesser-known
traditional institutions because of decades of uniformity
of government structure, Their togetherness has
reflec-ted through their organization Lembaga Adat Panglima
Laot Provinsi Nanggroe Aceh Darussalam which made
easier for outside organization to assist and work with
them. Facilitated by Yayasan Laut Lestari and Bogor
Agricultural University, on 19-20 February 2005 they
were able to gather remaining resources they had to
as-sist survivorS. The meeting launched several points of
recommendation on Aceh Recovery and the ongoing
Governments planning process [9J.
[image:15.614.65.298.91.309.2] [image:15.614.54.520.470.731.2]199
,
;:(l2WJ Eman Rustiadi: Land Cover Chang(' and Coastal Spatial Zoning in Arch·lndonesia in the Aflennath of the Tsunami
The Master Plan proposed hy Central Government
( Bapenas) gives special attention to spatial
arrange-ment issues and offers draft plans on how to use space
in affected districts or municipals. Local governments
are inviteu to build on the drafts as they develop
ue-tailed spatial plans in <:lose consultation with
communi-ties. The primary aims of the process are to ensure that
dS UT(>"S, eilil's, regions, and ウ[セエエャ・ュ・ョエウ@ are rebuilt, living ('onditions are improved and property are
safe-guarded in the event of future disasters. Business
cen-ters, social services, and den:sely puptllako urball
:set-tlements are best located in tsunami-proof zones. for
example. With the emergency relief efforts concluded,
the Master Plan will guide efforts or activities over the
next five rars. Master Plan is a policy and strategy
document that will guide onguing dialogue, planning,
anu action it is not designed to be a finished blueprint.
In short, the Plan promotes: locally and cultural
ap-propriate solution, community participation and broad
stakeholder input, holistics and integrated approaches,
transparency, accountability and effectiveness.
5 Land Use Planning and Zoning
Spatial zoning considered as a tool often used to
manage region in an efficient and effective way. The
master plan promotes 9 zones, namely: (1) coastal
zone, (2) fishery culture zone. (3) city garden. (4)
settlement, (5) city center/landmark, (6) new
settle-ments areas, (7) new bussines and I)ffices center,
( 8) education areas, and (9) agriculture. The coastal
zone functions mainly as buffer zone (wave/wind
breaker), and located within 300 - 400 meters from
coastal line. The aquaculture' areas mainly serves as
fishery (ponds) activities and as the second wave
breaker and fisherman housing. This area located in
the range about 1300 m from the first zone line. City
Garden/Public Greenery areas are the third buffer
are-a, and utilized as public space and city garden.
Settle-ment areas function as a limited settleSettle-ment and public
facilities centers. The City Landmark is the location of
main city landmarks (Baiturrahman Mosque, Museum
of Tsunami and other dty landmarks), local
goven-ment offices, and Cultural Centers. New settlegoven-ment
ar-eas function as new housing complex of the relocated
inhabitants (formerly were living closed area to the
seashore), new selliements areas. New bussines arid
offices centers are promoted as the city and province
service centers (CBO and government offices).
Edu-cation Center areas function as loEdu-cation og high
educa-tion campus and its supporting facilities. Agricultural
areas function as agriculture production areas, rural
sclliements and their supporting facilities.
The three buffer zones (about 2 km from the
sea-shore) are located in the formerly most dense areas.
Many groups of coastal community and NGOs arc
ask-ing for the involvement of local community in decision
making process. According to National Land Agency
( BPN) assesmenl, within the promoted buffer meas,
amount of 8 795 houses were located (Table 4) which
some of them have been ruined. During the planning
process, many of inhabitants have started to claim and
build their own new houses.
6
Conclusion Remarks
Tsunami has significant impact on land use pattern
in coastal areas of Banda Aceh City. The changes of
fishponds, residential areas and conservation areas
( nlangrove and other forest) were dominated the land
use/cover changes. These three land use/covers were
decreased about 61.5% , 57.8% and 77,6% from the
former respectively. Most of destructed villages in
coastal areas of the city formerly were developed as
ur-ban and very dense areas.
The effectiveness of government spatial planning
will ultimately rely on the communitys acceptance and
government s commitment to provide resources to
imple-ment. The government promoted buffer zones (about 2
km from seashore) are located in the formerly most
ur-banized dense areas. To implement this planning.
community based participatory planning process is
nee-ded.
References:
[ 1] Slloshany M, G<.ldhlcger N. Land Use and population density
changes in israel·] 950 to 1990: Anatysis of regional and local
trends[J]. Land Use Policy ,2002 ,19: 123-133.
[2 J Barlowe H. Land Hesourees Economics [ M J. London: Prentice Hall Internalional, tnc ,1986.