O R I G I N A L A R T I C L E
Land use and land cover change affecting habitat distribution
in the Segara Anakan lagoon, Java, Indonesia
Erwin Riyanto ArdliÆ Matthias Wolff
Received: 1 July 2008 / Accepted: 22 September 2008 / Published online: 16 October 2008 ÓSpringer-Verlag 2008
Abstract This study quantifies and spatially characterizes
land use and land cover changes in the Segara Anakan lagoon (SAL), Java, Indonesia, from 1987–2006. Classifi-cation of four satellite (SPOT) images from the years 1987, 1995, 2004 and 2006 and field ground truth data from 2004 and 2005 were used for map generation. The results show major changes in the western area of the SAL, with large area increases of rice fields, dry land agriculture, aqua-culture and rural areas, and decreases in mangrove cover, mud flat and lagoon area. In the eastern area, minor decreases in mangrove area and increase in aquaculture, rural and industrial areas were also observed. Changes are due to the filling of the lagoon with riverine sediments derived from the hinterland and to mangrove conversion and resources exploitation. The results of this study provide basic information which is required for developing mea-sures towards a sustainable management and conservation of the SAL.
Keywords Land use/cover changeConservation
Segara AnakanRemote sensingSPOT
Introduction
The importance of the SAL ecosystem for nature conser-vation was established in 1984 by the Indonesian
government and the ASEAN-USAID Coastal Resources Management Project (Cicin-Sain and Knecht1998; White et al. 2005). One of the specific objectives of this project was to protect and conserve the lagoon and the adjacent mangrove forest as a critical habitat for sustaining the productivity of the lagoon and offshore fisheries.
Segara Anakan is subjected to a multiple resource use conflict, overexploitation of coastal resources and environmental degradation. The coastal communities tra-ditionally exploit mangroves. Key management issues are the decreasing size of the lagoon due to heavy riverine sediment input from upland activities, water quality prob-lems due to sedimentation from upland agriculture activities and poor economic conditions of the coastal inhabitants (Dudley2000;BPKSA 2003; Yulastoro2003). Since 1978, land use and land cover change increased in this coastal region, as a result from increased urbanization and immigration leading to several problems. These include rural encroachment on agricultural land, land rec-lamation from swamps, silt deposition in the lagoon, and a decrease in fishery catches (White et al. 1989; Ardli and Wolff2007; Jennerjahn et al.2007; Ardli and Wolff2008). While land cover refers to the type of feature (vegetated or unvegetated) present on the surface of the earth, the term land use relates to the human activity or economic function associated with a specific piece of land (Lillesand and Kiefer 1994). Land use changes, especially those associ-ated with the intensification of shifting agriculture in subsistence economies, are known to induce changes in vegetation cover types and spatial structure (Vasconcelos et al.2002).
Land use and land cover changes in the SAL have been reported i.e. land use change until 1995 and sustainable development (Olive 1997), mangrove conversion until 2003 (Ardli and Wolff2007), coastal habitat and resource E. R. Ardli (&)
Fakultas Biologi Universitas Jenderal Soedirman, Jl. Dr. Suparno 63, Purwokerto 53122, Indonesia e-mail: [email protected]
M. Wolff
use changes until 2004 (Ardli and Wolff 2008). These changes are mainly due to resource overexploitation, deg-radation and pollution through unsustainable land use practices in the hinterland, and pollution from industry and households in the SAL ecosystem. Because of its dynamic changes, this paper provides the most updated information of land use/cover changes in the area.
Land use and land cover maps are regarded to be fun-damental for the purpose of coastal management planning (Cicin-Sain and Knecht1998; Mumby et al.1999; Stevens and Connolly2004). For this reason periodic mapping of land use, land cover, coastal habitats, and land resources were performed to observe trends and changes (Cicin-Sain and Knecht1998; Treitz and Rogan2004).
Due to the spatial nature of habitats and associated temporal changes, the assimilation of data using traditional analytical methods is often difficult. Mapping using remote sensing and geographic information systems (GIS) has proven to be effective to address problems inherent in the analysis of spatial data. GIS can be used to effectively collect, archive, display, analyze, and model spatial and temporal data (Stanbury and Starr1999). It may also be used to combine scientific and cultural data to assess and manage marine and coastal habitats (Cicin-Sain and Knecht1998).
Satellite data are now available that can be used to map and monitor changes from continental to local scales and over temporal scales (Treitz 2004). SPOT images are adequate for mapping marine and intertidal habitats (Mumby et al. 1999; Donoghue and Mironnet 2002), as well as mapping land and mangrove cover changes (Long and Skewes1996; Ardli and Widyastuti2001, Vasconcelos et al.2002, Weiers et al.2004). Many environmental and ecological properties can be determined using remote sensing (Mumby et al.2004). Accurate maps of their dis-tribution and abundance are essential for monitoring changes over time, for assessing habitat condition, and for investigating their links with other ecological system components that rely directly or indirectly on them (Long and Skewes 1996). To monitor changes efficiently over large areas, accurate, objective and inexpensive mapping techniques are required. Image processing of high-resolu-tion SPOT satellite data has many of these advantages over traditional photo-interpretation mapping (Long and Skewes
1996; Mumby et al. 1999; Mas2004).
The objectives of the present work were (1) to map and analyze land use and land cover in the Segara Anakan ecosystem and to monitor and assess their temporal (1987– 2006) and spatial changes by analyzing the satellite and field data, and (2) to assess the SAL habitat distribution consequences (in terms of socio-economic conditions of villagers and ecosystem functioning) of land use and land cover changes.
Study area
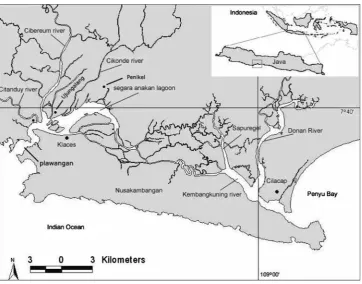
Segara Anakan is a large lagoon located in the south-western part of Central Java (108°460–109°050E; 7°340–
7°480S), west of Cilacap city (Fig.1), comprised by the
only large estuarine-mangrove forest left in Central Java. The lagoon is connected to the Indian Ocean by the western outlet (Plawangan) and a tidal channel towards Cilacap as an eastern outlet and is protected from the open ocean by a barrier island called Nusakambangan.
The climate of Segara Anakan is tropical and humid, with a southeast monsoon dry season and a northwest monsoon rainy season. Rainfall during the rainy season exceeds 300 mm month-1
and falls to 100 mm month-1
or less in the dry season. The total rainfall during 2002–2005 is about 2,151 up to 5,466 mm year-1
. The averages of minimum and maximum temperatures are 23.7 and 31.4°C (Tomascik et al.1997; BPS Jawa Tengah2005). Tides are diurnal with amplitudes of 0.2–2.6 meter (average 1.48 m) within the lagoon (White et al.1989).
The central and western parts of the lagoon are extre-mely shallow with water depths often\2 m. Only in the
westernmost part from the Citanduy River mouth to the Indian Ocean water depths are greater with a maximum depth of[10 m in the Plawangan channel. In the eastern
lagoon, water depths of 5–10 m are recorded in the Sapuregel and Donan branches because of little freshwater and sediment input. Near Cilacap port facilities and in the channel connecting the lagoon to the Indian Ocean water depth is around 10 m also because of dredging of the navigation channel.
The western part of the lagoon receives high amounts of freshwater including suspended sediments from Citanduy River, Cikujang River, Cikonde River and Cibereum River (Ardli and Widyastuti2001). The average discharge of the Citanduy River of 140 m3s-1
(range 80–300 m3s-1
) and an average outflow to the Indian Ocean through the Pla-wangan channel of 555 m3s-1
(range 0–1,200 m3s-1
) (Holtermann et al. 2008). The Citanduy River is the main river in the Citanduy watershed. This watershed is critical in terms of hydrology and erosion. Agriculture activity is the most important activity in this watershed, and even conservation areas and forested lands are being converted into horticulture or land for growing other food crops (Dwiprabowo and Wulan 2003). The lagoon is rapidly filling up with sediments because of high rates of upland soil erosion. Fishery yields have also been affected due to the environmental changes and the loss of lagoon area (Dudley2000).
In 1997, the Segara Anakan mangrove forest area was about 13,577 ha (Tomascik et al. 1997), and has been severely degraded and reduced by a rate of 192.9 ha year-1
extended over an area of 3,636 ha, but has constantly decreased to only 600 ha in 2002 (White et al. 1989;
BPKSA 2003).
Various species of mangrove, fish, shrimps, crabs, molluscs, birds and mammals are found either in the lagoon, on the mud flats or in the mangrove areas. The mangrove forest of Segara Anakan (21,185 ha in 1983) contains 26 mangrove species, of which the most abundant and commercially important ones are Rhizophora apicu-lata, R. mucronata and Bruguiera gymnorrhiza (White et al. 1989). White et al. (1989) reported more than 45 species of fish, of which 17 are demersal, 12 residential and 16 occasional visitors. More than 85% of these species are of high economic value as fisheries commodities. The lagoon is a feeding, spawning and nursery ground for many commercially important fishes and crustaceans. The com-mercially important crustaceans found in the area are Scylla spp., Portunus pelagicus, Tellina spp., Penaeus merguensis, P. chinensis, P. monodon, Metapenaeus ensis, M. elegan and M. dopsoni(Dudley2000).
Human populations are concentrated in the four villages ‘‘Kampung Laut’’ i.e. Ujungalang (4,024 people), Ujung-gagak (3,887 people), Klaces (1,030 people) and Penikel (4,706 people) (BPS Cilacap 2005). The most important human activities are fishing, agriculture and semi-intensive aquaculture (tambak). Coastal settlements are generally densely populated with widespread poverty, especially among fishing communities. Increase in the number of fisherman as a result of population growth and migration to
coastal fishing communities is seen as a contributing factor in the overexploitation of local fisheries resources and the deterioration of the coastal environment (Tietze et al. 2000).
Materials and methods
Data sources
Satellite images acquired in this study are listed in Table1. SPOT multispectral (XS) images level 2A were used to determine land cover and land use changes in this study. In the level 2A, images were radiometric corrected due to differences in sensitivity of the elementary detectors of the viewing instrument. Geometrical correction were also been done in a standard cartographic projection (UTM WGS84 by default). The analysis was based on the available data, cost-effectiveness, and the available spectral and spatial resolution (Mumby et al.1999; Weiers et al.2004). SPOT images were registered and resampled to a UTM (SUTM 49) projected output image composed of 20 m920 m and 10 m910 m pixels with an RMS error of less than
1.0 pixel that was obtained from the Biotrop Training and Information Centre (BTIC).
Resampling was done by the nearest neighbour method, which sets the radiometric value of the output pixel equal to the nearest input pixel in the original geometry, in order to preserve the original values of the image. A digital Fig. 1 Segara Anakan lagoon,
elevation model along with soil, land use/cover, stream and road network digital maps (scale of 1:50,000), was obtained from the Segara Anakan Management Agency (BPKSA) Cilacap.
Mapping approach
Image processing
In the pre-processing phase, the datasets were cut to include only the areas of interest (7°340900–7°4805000S,
108°460800–109°502100E). They were then rectified by using
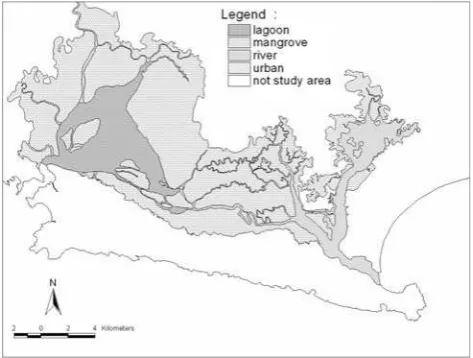
ground control points (with the geometric corrected image as a base) with a linear polynomial transformation and nearest neighbour resampling with a root mean square error of less than one pixel. After rectification processes, datasets were cropped based on the detail polygon area which is study area (SAL) (see Fig.2). It was defined by using spatial feature influenced by the tides such as mangroves, lagoon waters and rivers of Segara Anakan in the year 1978 as a baseline (Ardli2008).
Classification (supervised image classification)
Supervised classification with a maximum likelihood algorithm (available in ERMapper 5.5) was used in this
study, because this classification algorithm produces con-sistently good results for most habitat types (Donoghue and Mironnet2002). The training polygons were digitized on-screen based on terrain knowledge acquired during field-work and was distributed throughout the study areas. The pixels in the polygons that were selected as representative of each class were plotted in spectral space and a visual check was made that all classes could be separated in at least one combination of bands, for ellipses containing 95% of the class pixels.
To increase the size of the sample to be used in classi-fication accuracy assessment, the layer with the field-checked sites was overlaid on the corrected satellite ima-ges, and homogeneous polygons with similar spectral reflectance, when viewed in several band combinations, were drawn around those sites. The layer of polygons created using this process was later used for checking the accuracy of the classified map.
Accuracy assessment
Accuracy assessment for the land use and land cover maps from the Segara Anakan ecosystem was based on 37-ground truthing points recorded during field survey (May 2004–February 2005). Using ecological information in a GIS package, one can formulate and apply location and topological (the relation between area-based objects) rules to the classified satellite data to improve the mapping accuracy (Long and Skewes1996). A standard error matrix was determined to assess the classification accuracy, using data from the output map as the row, and the reference data (ground truth points) as the column in the matrix (Cong-alton 1999 in Alonso-Perez et al.2003).
Post-classification analysis and change detection
After accuracy assessment, the classified images were exported to the GIS facilities to generate the land cover and land use map. Analysis and quantification of land use/cover differences between the different dates was included in the GIS database. Once both maps had exactly the same number of feature pixels they were subjected to a cross-tabular comparison. This indicates the differences in extent of each class and the transitions that had taken place between the two dates. The characterization of land cover Table 1 List of satellite images
used in this study Sensor Platform Spectral coverage (lm)
Number of channel
Spatial resolution (m)
Path/Row (scene)
Acquisition date
HRV 2 SPOT 1 0.50–0.89 3 10 (PAN) 20 (MS) 289–365/0 10-10-1987 HRV 2 SPOT 1 0.50–0.89 3 10 (PAN) 20 (MS) 289–365/0 11-07-1995 HRG 1 SPOT 5 0.50–0.89 3 5 (PAN) 10 (MS) 289–365/0 07-06-2004 HRG 1 SPOT 5 0.50–0.89 3 5 (PAN) 10 (MS) 289–365/0 22-01-2006
change is done using aggregated measurements of area by cover type at both dates and quantifying transitions. The change analysis is limited to these measurements due to the different generalization levels and minimum size of map-ped units for the data sources available for the study (1987– 2006).
Results
The land use and land cover changes in SAL are shown in Table2 and Fig.3. Since the 1900s, the extent of the SAL has changed enormously (Olive 1997; Tejakusuma
2006). Until the year 2006, the estuarine area comprised by the lagoon, mangroves and mud flats decreased sig-nificantly, while rice fields, aquaculture, and industry areas increased. For the other land use/cover types such as rural settlement and river changes were not that
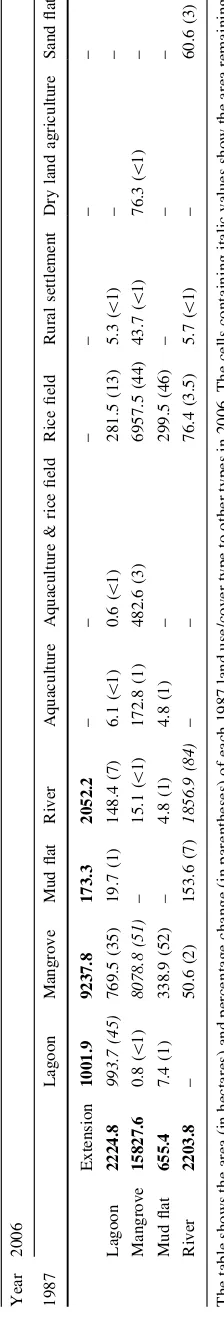
significant. From 1987 to 2006, a large part of the estuary was replaced by mangroves (1,159 ha), which were subsequently converted to rice agriculture, semi-inten-sive fishponds (tambak), new rural settlements and other land use/cover types (7,748.8 ha). A large part (44%) of the total mangrove area in 1987 was converted into rice fields, and only minor parts (\5%) into other land use/
cover areas (see Table 3).
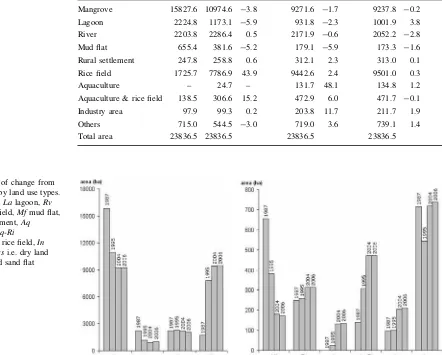
During the period 1987–1995, several annually changes favored the development of aquaculture?rice field (15.2%), rice field (43.9%), industrial areas (0.2%), and rural settlement (0.6%). The lagoon area continuously decreased until 2004, but there was an observed increase 3.8% per year or become 1,001.9 ha in 2006. This increase of the lagoon area was caused by dredging activities carried out by BPKSA during 2003–2005 (see Table2). Table3
shows a quantification of transitions between land use/ cover types.
Table 2 Segara Anakan land
use/cover changes (in hectares) Habitat 1987 1995 2004 2006 Annual
change (%)
Annual change (%)
Annual change (%)
Mangrove 15827.6 10974.6 -3.8 9271.6 -1.7 9237.8 -0.2 Lagoon 2224.8 1173.1 -5.9 931.8 -2.3 1001.9 3.8 River 2203.8 2286.4 0.5 2171.9 -0.6 2052.2 -2.8 Mud flat 655.4 381.6 -5.2 179.1 -5.9 173.3 -1.6 Rural settlement 247.8 258.8 0.6 312.1 2.3 313.0 0.1 Rice field 1725.7 7786.9 43.9 9442.6 2.4 9501.0 0.3
Aquaculture – 24.7 – 131.7 48.1 134.8 1.2
Aquaculture & rice field 138.5 306.6 15.2 472.9 6.0 471.7 -0.1 Industry area 97.9 99.3 0.2 203.8 11.7 211.7 1.9
Others 715.0 544.5 -3.0 719.0 3.6 739.1 1.4
Total area 23836.5 23836.5 23836.5 23836.5
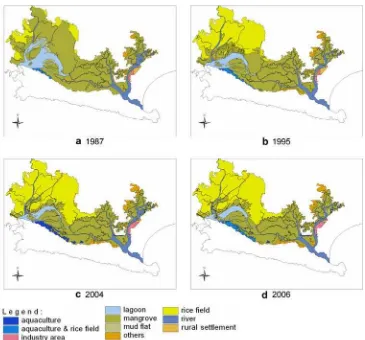
The final raster maps resulting from the present study are shown in Fig.4. In the first decade (1987–1995), the new land areas rapidly increased in the western part of the SAL. The older part of this new land was then converted into new mangrove forest (Fig. 4a, b). These changes were mainly caused by the high sedimentation rate of the SAL system, estimated to 1–3 million ton year-1
(Purba1991). In the western region (Ujunggagak, Klaces, Penikel and Ujungalang) mangrove change was more pronounced due to stronger logging and sedimentation compared to the eastern area. Mangrove trees were logged at a rate of approximately 14.23 m3day-1 (Sastranegara et al.
2007).
During the period 1987–2006, the largest patch of the new mangrove area (44%) was converted into rice fields that are mostly located in the northern, northwestern and northeastern parts of the lagoon, where parts of it belong to the Ujungalang and Penikel villages (Fig. 4). It is a low lying area with a great abundance of fresh water inflow, and therefore suitable for rice culture. Only a very small part of the mangrove area was converted into aquaculture, agriculture and rural area (\5%). There are
also important additions of new mangroves (1,159 ha) derived from former mud flats, lagoon and river (Table 3).
The extent of the mangrove forest has been fluctuating as a result of both deforestation and mangrove encroach-ment. From 1987 to 2006 approximately 7,748.8 ha of forest were cut down, while 1,159 ha of new mangrove forest were established on new grounds in the estuary during this period. The decreasing trend of mangroves was paralled by an increasing trend of rice fields, so that mangroves and rice fields replaced each other during this period (see Fig. 4). The increase of other land uses such as aquaculture, industry, rural settlement, dry land agriculture and others did not significantly change the extent of the converted mangrove area, because of new mangroves that were building up. From 1995 to 2004 only 597.8 ha of mangroves were converted into aquaculture, rural settle-ment and plantation (excluding rice fields) (see Tables2,
3), while at the same time about 840.1 ha of new man-groves were created mostly at the new land area in the western part of the lagoon.
The general decline of the rate of mangrove conversion from the period 1987–1995 to 1995–2004 (from -3.8 to only-1.7% per year) (see Table2), may at least in part be
due to the projects Coastal Resources Management Project (CRMP) and Segara Anakan Conservation and Develop-ment Project (SACDP) conducted in Segara Anakan. Major objectives of these projects were to preserve eco-logically important areas of coastal forest, estuarine and marine ecosystems, water resources management and sedimentation control, rehabilitation and management of
mangroves through community participation, capacity building and education.
Discussion
Changes in the lagoon area are almost exclusively caused by high sedimentation rates. In 1903 the lagoon was reported to cover an area of more than 6,000 ha (Olive
1997; Tejakusuma 2006). Sedimentation has been one of the main management concerns in the river basin, partic-ularly regarding the impacts on the low land activities, including the Segara Anakan. It has been attributed to deforestation and poor agricultural management practices in the upland areas of the Citanduy river basin, as well as to the volcanic eruption of Mount Galunggung in 1982, which is located in the river basin. Changes in land use other than forest/crop ratios may change runoff coefficients and catchments size should control hydrological behaviour (Lavigne and Gunnell 2006). The land use change at the SAL area has been accelerated by the immigration of farmers, who have almost doubled the population since the year 1978. The reformation in 1998 has been advertised by the media as the main scapegoat for current environmental
problems. However, in many upland areas, deforestation is not a new phenomenon. It is rather the acceleration of a process that has lasted for decades (Dwiprabowo and Wulan2003).
New economic opportunities arose from the rice fields development, generating many income activities from farm labor, harvesting, gardening and dry land cropping, and fishponds were created. While rice has been the dominant agricultural activity over the past decade in Segara Anakan, the cultivation of other agriculture products, generally cash crops, occurs on a much smaller scale. These crops include soybean, corn, cassava, fruit and vegetables, and are often sold to supplement the household income. Rice fields are managed through various labor arrangements, notably, farmers working the land themselves, hiring labor, and/or receiving help from family members (Olive1997).
More than 50% of the mangrove areas in 2003 were disturbed especially in the western part of Segara Anakan (BPKSA 2003). Mangrove conversion has lead to several problems besides reducing fishery yields. It has led to a reduction of biodiversity, loss of habitats and nursery areas, loss in productivity, soil acidification, pollution, and alter-ation of water drainage patterns (Tejakusuma2006). While producing economic benefits, aquaculture development has Fig. 4 Land use/cover change
also been associated with environmental degradation of the SAL, since it is also based on the conversion of mangroves and causes pollution of the surrounding waters. Decreasing lagoon size and with it decreasing fishing ground, are considered the cause for the declining fish production in the SAL as well as offshore Cilacap (Ardli2008). The loss of biodiversity in mangrove-converted areas of the SAL has been reported since 1980s (Sastranegara et al. 2003). Intertidal crab diversity was higher and more constant in the undisturbed area with high mangrove coverage (90%) compared to areas of crab hunting, logging and prawn ponds with a mangrove coverage of 89, 33 and 0%, respectively (Yuwono et al.2007).
Overall, it thus appears that the current changes have produced an overall economic benefit to the greatly increased human population, but the lagoon ecosystem, its aquatic resources and its biodiversity have significantly been affected. The question to be asked is, if the SAL is going to further develop into an agricultural area, which would mean that the lagoon and its aquatic resources would finally disappear, or if it is desirable to maintain the SAL system as such, even at a much smaller as original size. Since Java is already almost depleted from swamp and lagoon areas, a loss of the SAL would mean a great loss of a unique ecosystem, and of the diversity of habitats and species, which will be unrecoverable.
Acknowledgments The authors want to thank the SPICE project (German Federal Ministry of Education and Research, Grant No. 03F0391A), Center for Tropical Marine Ecology (ZMT) Bremen, Deutscher Akademischer Austauschdienst (DAAD) and Jenderal Soedirman University, Purwokerto, for their support during this study; Biotrop Training and Information Center (BTIC) Bogor for images support.
References
Alonso-Perez F, Ruiz-Luna A, Turner J, Berlanga-Robles CA, Mitchelson-Jacob G (2003) Land cover changes and impact of shrimp aquaculture on the landscape in the Ceuta coastal lagoon system, Sinaloa, Mexico. Ocean Coast Manage 46:583–600. doi: 10.1016/S0964-5691(03)00036-X
Ardli ER (2008) A trophic flow model of the Segara Anakan lagoon, Cilacap, Indonesia. PhD Dissertation. Bremen Universita¨t, Bremen Ardli ER, Widyastuti A (2001) Application of NDVI analysis from Landsat TM and SPOT images for monitoring and detection of mangrove damages at Segara Anakan Cilacap, Central Java. Research report DUE-like project Unsoed, Purwokerto Ardli ER, Wolff M (2007) Spatial and temporal dynamics of
mangrove conversion at the Segara Anakan Cilacap, Indonesia. In: Yuwono E, Jennerjahn T, Sastranegara MH, Sukardi P (eds) Synopsis of ecological and socio-economic aspects of tropical coastal ecosystem with special reference to Segara Anakan. Research Institute of the University of Jenderal Soedirman, Purwokerto, pp 11–20
Ardli ER, Wolff M (2008) Quantifying habitat and resource use changes in the Segara Anakan lagoon (Cilacap, Indonesia) over
the past 25 years (1978–2004). Asian J Water Environ Pollut (in press)
BPKSA (Badan Pengelola Kawasan Segara Anakan) (2003) Laporan pelaksanaan proyek konservasi dan pembangunan Segara Ana-kan. Lokakarya Status, Problem dan Potensi Sumberdaya Perairan dengan Acuan Segara Anakan dan DAS Serayu, Purwokerto
Cicin-Sain B, Knecht RW (1998) Integrated coastal and ocean management: concepts and practices. Island Press, Washington DC
Cilacap BPS (2005) Cilacap dalam Angka. Badan Pusat Statistik, Cilacap
Donoghue DNM, Mironnet N (2002) Development of an integrated geographical information system prototype for coastal habitat monitoring. Comput Geosci 28:129–141. doi:10.1016/S0098-3004(01)00021-8
Dudley RG (2000) Segara Anakan Fisheries Management Plan. Segara Anakan Conservation and Development Project, Com-ponent B&C, Consultant’s Report, Cilacap
Dwiprabowo H, Wulan YC (2003) A Description of the Citanduy Watershed, West Java and Preliminary Analysis of Carbon-sequestration Potential by Smallholders. Working paper CC09, ACIAR project ASEM 1999/093. http://www.une.edu.au/febl/ Econ/carbon/
Holtermann P, Burchard H, Jennerjahn T (2008) Spatio-temporal variation of Segara Anakan hydrodynamics. Reg Environ Change (this volume)
Jawa Tengah BPS (2005) Jawa Tengah dalam Angka. Badan Pusat Statistik Jawa Tengah, Semarang
Jennerjahn T, Holtermann P, Pohlenga I, Nasir B (2007) Environ-mental conditions in the Segara Anakan lagoon, Java, Indonesia. In: Yuwono E, Jennerjahn T, Sastranegara MH, Sukardi P (eds) Synopsis of ecological and socio-economic aspects of tropical coastal ecosystem with special reference to Segara Anakan. Research Institute of the University of Jenderal Soedirman, Purwokerto, pp 28–32
Lavigne F, Gunnell Y (2006) Land cover change and abrupt environmental impacts on Javan volcanoes, Indonesia: a long-term perspective on recent events. Reg Environ Change 6:86– 100. doi:10.1007/s10113-005-0009-2
Lillesand TM, Kiefer RW (1994) Remote sensing and image interpretation, 3rd edn. Wiley, New York
Long BG, Skewes TD (1996) A technique for mapping mangrove with Landsat TM satellite data and geographic information system. Estuar Coast Shelf Sci 43:373–381. doi:10.1006/ecss. 1996.0076
Mas JF (2004) Mapping land use/cover in a tropical coastal area using satellite sensor data, GIS and artificial neural networks. Estuar Coast Shelf Sci 59(2):219–230. doi:10.1016/j.ecss.2003.08.011 Mumby PJ, Green EP, Edwards AJ, Clark CD (1999) The
cost-effectiveness of remote sensing for tropical coastal resources assessment and management. J Environ Manage 55:157–166. doi:10.1006/jema.1998.0255
Mumby PJ, Skirving W, Strong AE, Hardy JT, LeDrew EF, Hochberg EJ et al (2004) Remote sensing of coral reefs and their physical environment. Mar Pollut Bull 48:219–228. doi:10.1016/j. marpolbul.2003.10.031
Olive CA (1997) Land Use Change and Sustainability Development In Segara Anakan, Java, Indonesia: Interactions among society, environment and development. Thesis, University of Waterloo. Waterloo, Ontario
National University of Singapore, Singapore and International Center for Living Aquatic Resources Management, Philippines, pp 143–152
Sastranegara MH, Fermon H, Mu¨hlenberg M (2003) Diversity and Abundance of Intertidal Crabs at the East Swamp Managed Area in Segara Anakan Cilacap, Central Java, Indonesia. Deutscher Tropentag, Go¨ttingen
Sastranegara MH, Yuwono E, Sukardi P (2007) Illegal logging of mangroves at the Segara Anakan Cilacap, Java, Indonesia: a conservation constraint. In: Yuwono E, Jennerjahn T, Sastra-negara MH, Sukardi P (eds) Synopsis of ecological and socio-economic aspects of tropical coastal ecosystem with special reference to Segara Anakan. Research Institute of the University of Jenderal Soedirman, Purwokerto, pp 21–27
Stanbury KB, Starr R (1999) Applications of geographic information systems (GIS) to Habitat Assessment and Marine Resource Management. Oceanol Acta 22(6):699–703. doi:10.1016/S0399-1784(00)88960-4
Stevens T, Connolly RM (2004) Testing the utility of abiotic surrogates for marine habitat mapping at scales relevant to management. Biol Conserv 119(3):351–362. doi:10.1016/ j.biocon.2003.12.001
Tejakusuma IG (2006) Analisis Faktor dan Implikasi Penyusutan Laguna Segara Anakan. Alami 11(3):35–40
Tietze U, Groenewold G, Marcoux A (2000) Demographic change in coastal fishing communities and its implications for the coastal environment. FAO fisheries technical paper no. 403, 151 p. FAO Rome
Tomascik T, Mah AJ, Nontji A, Moosa MK (1997) The ecology of the Indonesian seas, part II, chap 13–23, Periplus edn, Singapore
Treitz P (2004) Remote sensing for mapping and monitoring land-cover and land-use change. Prog Plann 61:267. doi:10.1016/ S0305-9006(03)00062-X
Treitz P, Rogan J (2004) Remote sensing for mapping and monitoring land-cover and land-use change–an Introduction. Prog Plann 61:269–279. doi:10.1016/S0305-9006(03)00064-3
Vasconcelos MJP, Mussa’Biai JC, Arau’jo A, Diniz MA (2002) Land cover change in two protected areas of Guinea-Bissau (1956–1998). Appl Geogr 22:139–156. doi:10.1016/S0143-6228(02)00005-X Weiers S, Block M, Wissen M, Rossner G (2004) Mapping and
indicator approaches for the assessment of habitats at different scales using remote sensing and GIS methods. Landsc Urban Plan 67:43–65. doi:10.1016/S0169-2046(03)00028-8
White AT, Martosubroto P, Sadorra MSM (1989) The coastal environmental profile of Segara Anakan-Cilacap, South Java, Indonesia. ICLARM technical reports on coastal area manage-ment series no. 25, International Centre for Living Aquatic Resources Management, Manila
White AT, Christie P, D’Agnes H, Lowry K, Milne N (2005) Designing ICM project for sustainability: lesson from the Philippines and Indonesia. Ocean Coast Manage 48:233–251. doi:10.1016/j.ocecoaman.2005.04.003
Yulastoro P (2003) Usaha dan Kendala Penyelamatan Degradasi Lingkungan Segara Anakan. Lokakarya Status, Problem dan Potensi Sumberdaya Perairan dengan Acuan Segara Anakan dan DAS Serayu, Purwokerto