thor(s) 20 . CC -NC-N ttri tion 4.0 Li ense.
Monitoring Land Cover Changes in the Disaster-Prone Area: A
Case Study of Cangkringan Sub-District, the Flanks of Mount
Merapi, Indonesia
Ronggo Sadono 1,*, Hartono 2, Moch. Maksum Machfoedz 3, Setiaji 4
1 Faculty of Forestry, Universitas Gadjah Mada, Jl. Agro, Bulaksumur, Yogyakarta, 55281 2 Faculty of Geography, Universitas Gadjah Mada, Jl. Kaliurang, Bulaksumur, Yogyakarta, 55281 3 Faculty of Agricultural Technology, Universitas Gadjah Mada, Jl. Flora, Bulaksumur, Yogyakarta,
55281
4 The Ministry of Environment and Forestry, Jl. Gatot Subroto, Senayan, Jakarta, 10065 *)Corresponding Author (e-mail: [email protected])
Received: 02 November 2017 / Accepted: 08 December 2017 / Published: 16 December 2017
Abstract.Volcanic eruption is one of the natural factors that affect land cover changes. This study aimed to monitor land cover changes using a remote sensing approach in Cangkringan Sub-district, Yogyakarta, Indonesia, one of the areas most vulnerable to Mount Merapi eruption. Three satellite images, dating from 2001, 2006 and 2011, were XVHG DV PDLQ GDWD IRU ODQG FRYHU FODVVLÀFDWLRQ EDVHG RQ D VXSHUYLVHG FODVVLÀFDWLRQ approach. The land cover detection analysis was undertaken by overlaying the FODVVLÀFDWLRQUHVXOWVIURPWKRVHLPDJHV7KHUHVXOWVVKRZWKDWWKHGRPLQDQWODQGFRYHU class is annual crops, covering 40% of the study area, while the remaining 60% consists RIIRUHVWFRYHUW\SHVGU\ODQGIDUPLQJSDGG\ÀHOGVVHWWOHPHQWVDQGEDUHODQG7KH forests were distributed in the north, and the annual crops in the middle of the study DUHDZKLOHWKHYLOODJHVDQGWKHULFHÀHOGVZHUHJHQHUDOO\ORFDWHGLQWKHVRXWK,QWKH ²SHULRGIRUHVWVZHUHWKHPRVWLQFUHDVHGODQGFRYHUW\SHZKLOHDQQXDOFURSV decreased the most, as a result of the eruption of Mount Merapi in 2010. Such data and information are important for the local government or related institutions to formulate Detailed Spatial Plans (RDTR) in the Disaster-Prone Areas (KRB).
Keywords: land cover change, disaster-prone area, volcanic eruption, remote sensing, Detailed Spatial Plan.
Abstrak. Letusan gunung merupakan salah satu faktor alam yang mengakibatkan perubahan penutupan lahan. Penelitian ini bertujuan untuk menganalisa perubahan penutupan lahan menggunakan pendekatan remote sensing di Kecamatan Cangkringan, salah satu daerah rawan bencana letusan Gunung Merapi, Yogyakarta, Indonesia Tiga citra satelit dengan tahun yang EHUEHGD GDQ GLJXQDNDQ VHEDJDL GDWD XWDPD XQWXN NODVLÀNDVL SHQXWXSDQ ODKDQ 6HPHQWDUD NODVLÀNDVL WHUELPELQJ GLSLOLK VHEDJDL SHQGHNDWDQ NODVLÀNDVL $QDOLVLV deteksi perubahan penutupan lahan dihitung dengan mengoverlay peta penutupan lahan hasil NODVLÀNDVL+DVLOSHQHOLWLDQPHQXQMXNNDQEDKZDNHODVSHQXWXSDQODKDQ\DQJGRPLQDQDGDODK tanaman tahunan, yang meliputi 40% dari luasan kecamatan, sementara 60% sisanya adalah tipe penutupan hutan, pertanian lahan kering, sawah, pemukiman dan tanah terbuka. Hutan terdistribusi di bagian utara, tanaman tahunan di bagian tengah sementara desa dan sawah SDGD XPXPQ\D EHUDGD GL EDJLDQ VHODWDQ GDUL NDZDVDQ NHFDPDWDQ 3DGD SHULRGH peningkatan luas terjadi pada tipe penutupan lahan hutan, sementara untuk penurunan luas paling besar terjadi pada tipe penutupan lahan tanaman tahunan yang disebabkan oleh letusan Gunung Merapi pada tahun 2010. Data dan informasi ini penting untuk pemerintah daerah atau pihak terkait lainnya dalam rangka menyusun Rencana Detail Tata Ruang (RDTR) pada Kawasan Rawan Bencana (KRB).
1. Introduction
The largest and most recent eruption of Mount Merapi occurred in 2010 and has had an impact on various aspects, one of which is land cover changes. Mount Merapi is one of the most active volcanoes in Indonesia. In the last decade, there have been some eruptions, most notably in 1994, 1998, 2001-2003 (highly continuous activity), and 2006, and the greatest activity last occurred in 2010. In general, Mount Merapi has a period of re-eruption HYHU\ ² \HDUV 6XURQRet al., 2012; Bronto, 2001). In October 2010, the eruption intensity of Mount Merapi increased explosively with the vertical pyroclastic surge reaching as high as 7 km several times. In the 2010 eruption, debris avalanches reached areas up to 17 km from the crater of Mount Merapi; pyroclastic ash was found in Tangerang City (in the west) and Denpasar City (in the east), while lava reached more than 20 km to the west and south ÁDQN7KH5HVHDUFKDQG'HYHORSPHQW&HQWHU for Geological Disaster Technology (BPPTKG), Yogyakarta, categorised it as “very explosive” and as a “Plinian” eruption. This eruption of Mount Merapi, which occurred from October 26th to November 4th 2010, was one of the largest and most explosive. The occurrence of an eruption can result in material losses, such as the loss of property owned by people living in the areas surrounding Mount Merapi, and non-material losses, such as the destruction of ecosystems.
(FRV\VWHPGDPDJHRQWKHÁDQNRI0RXQW Merapi is caused by the eruption of material, VXFK DV S\URFODVWLF ÁRZV VXUJHV GHEULV DYDODQFKHVODKDUVDQGDOVRE\ÁRRGV7KHUHDUH some types of volcanic activity that can threat the ecosystem (especially vegetation); these are: the formation of lava, debris avalanches, tephra (pyroclastic precipitate), and gas spills (Yuniasih, 2013). Debris avalanches can damage the ecosystems that exist around WKH ÁDQN RI 0RXQW 0HUDSL DV WKH\ FDQ FDXVH a change in the land in this area. As a part of the ecosystem, the existence of forests must be maintained (as a life support system) because of their functions as catchment areas, and as
conservation areas that can prevent landslides, and also because they help to maintain the groundwater condition. Spatial data prediction information and attributes concerning land conditions become important for long-term land management and development planning which affect land changes in areas vulnerable to eruptions of Mount Merapi.
One of the several approaches employed to assess land cover changes has been the use of remote sensing techniques. The assessment of land cover changes could be undertaken in VHYHUDOZD\VVXFKDVDWHUUHVWULDOÀHOGVXUYH\ or by using remote sensing technology and a geographic information system. Each method has its own advantages and disadvantages. The main advantage of the terrestrial survey is that it produces high accuracy data, while the disadvantages are that it requires a lot of human resources, time, and cost. Meanwhile, remote sensing approaches have the ability to present earth surface condition information quite well in multiple resolutions (spectral, spatial, temporal, and radiometric), and they KDYH DGYDQWDJHV RYHU ÀHOG VXUYH\V LQ WHUPV of cost, time, and sample accessibility. These approaches also make it possible to extract information that cannot be tapped directly in WKHÀHOG
By applying a case study, this research will analyse land cover changes in Cangkringan Sub-district, Sleman District, Province of Yogyakarta Special Region, Indonesia. There are two main reasons that underline why Cangkringan Sub-district is selected as a study DUHD&DQJNULQJDQLVORFDWHGRQWKHÁDQNV RI 0RXQW 0HUDSL ² DQ DUHD WKDW LV SURQH WR YROFDQLF HUXSWLRQV .5% ² Kawasan Rawan Bencana), (2) Cangkringan is one of the sub-districts in Sleman District that does not have a completed regional Detailed Spatial Plan 5'75²Rencana Detail Tata Ruang) (Bappeda Kabupaten Sleman, 2012). As we know, RDTR will provide a detailed spatial plan that is needed to implement regional spatial plans 575:²Rencana Tata Ruang Wilayah). Spatial data on land cover is vitally needed in order to encourage the completion of the RDTR document in Cangkringan Sub-district. Time series land cover and land use data from both pre- and post-disaster are also useful in disaster-prone areas for many activities, such as damage assessment and rehabilitation plans (Bello and Aina, 2014). Therefore, this study aims to monitor land cover changes in Cangkringan Sub-district using a remote sensing approach.
2. Research Method 2.1. Study area
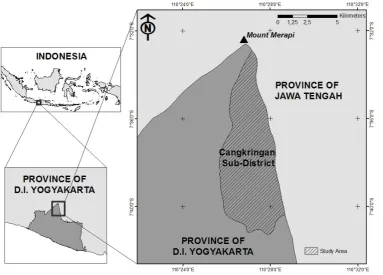
The study was conducted in Cangkringan Sub-district, Sleman District, which is located on 7°33’3” to 7°41’2” in the south and 110°25’4” to 110°28’35” in the east, with a total area of 47.99 km2 7KH DUHD ZDV ORFDWHG RQ WKH ÁDQN of Mount Merapi, from the top to the bottom, covering villages scattered across Cangkringan Sub-district, Sleman District. The study was conducted from July 2012 to July 2013. Site selection was based on the areas affected by WKH HUXSWLRQ DQG WKH FXUUHQW ODYD ÁRZ position. A map of the location of the study is presented in Figure 1.
2.2. Data
In order to detect land cover changes, several datasets were used in this study (Table
1). These datasets consist of two categories QDPHO\LPDJHULHVDQGGLJLWDOPDSVKDSHÀOH The imageries were sourced from two different provider: USGS and BingMap. Meanwhile, the VKDSHÀOH GDWD LQFOXGHV ,QGRQHVLDQ EDVH PDS administrative map and disaster-prone area map were sourced from Indonesian Geospatial Agency (BIG), Local Agency for Planning and Development (Bappeda) and National Agency for Disaster Management (BNPB) repectively.
2.3. Image pre-processing
The image data sets were geometrically corrected using the World Geodetic System (WGS) 1984 datum and the Universal Transverse Mercator coordinate system. The images were georeferenced using ground control points that were collected from an Indonesian-based map (RBI). Meanwhile, the study area was determined by performing a subset operation with the Cangkringan Sub-district vector boundary as a guide.
2.4. Image classi cation
2.4.1. Land classi cation scheme
The selection of land cover classes to be FRQVLGHUHGIRULPDJHFODVVLÀFDWLRQZDVEDVHG RQWKHODQGXVHFODVVLÀFDWLRQV\VWHPGHYHORSHG by the Indonesian Ministry of Forestry (Departemen Kehutanan, 2008). According to this scheme and to ground-check results, WKHUH ZHUH ÀYH GRPLQDQW ODQG FRYHU W\SHV namely: forest, annual crop, dryland farming, VHWWOHPHQW EDUH ODQG SDGG\ ÀHOG DQG ZDWHU body.
2.4.2. Supervised classi cation
Figure 1. Research location in Cangkringan Sub-district.
)LJXUH)ORZFKDUWRIWKHVWHSVLQYROYHGLQWKHDQDO\VLVRIODQGFRYHUFKDQJHV
a e . List o data sed
Data Date of Acquisition Source
Earth Observation (E0-1), resolution 30 m: (RGB), 10 m (panchromatic) 2001/07/11 USGS
Orbview-3, resolution 4 m (RGB), 1 m (panchromatic) 2006/09/11 USGS
GeoEye, resolution 1.65 m (RGB), 0,41 m (panchromatic) 2011/06/11 BingMap
Indonesian Base Map (RBI), scale: 1:25,000 1999 BIG
Administrative Map 2012 Bappeda
2.4.3. Accuracy assessment
For the accuracy assessment, the cross-tabulated matrix was prepared by comparing FODVVLÀHGLPDJHDQGUHIHUHQFHGDWD&RQJDOWRQ 1991). 100 points on each of the 2001 and 2006 high resolution images, which were randomly distributed, were used to assess the accuracy of DQG FODVVLÀHG LPDJHV UHVSHFWLYHO\ Meanwhile, 100 points of 2011 ground truth data ZHUHXVHGWRYHULI\WKHFODVVLÀHGLPDJH
2.5. Change detection analysis
The extent of the land cover changes could be computed by comparing the area in the same region at two or more different times. The analysis that was used in the study related to changes in the land use of each village in Cangkringan, Sleman. The extent of the land
FKDQJH LQ WKH SHULRGV ² DQG ² 2011 was obtained by comparing the extent of land types in terms of spatial data. Meanwhile, to obtain the area of land use per village, the spatial data of land use changes in each observation year were categorised according to the administrative boundary of the village. The process of land use change interpretation and spatial analysis of land use change data was undertaken using ArcView 3.3 software with the help of image analysis extensions, while attribute data analysis was carried out using computer software, namely: ArcGIS 10 DQG0LFURVRIW2IÀFH([FHO)XUWKHUPRUH GPS, cameras, and stationery were used for ÀHOGYHULÀFDWLRQSXUSRVHV)LJXUHGHVFULEHV the steps involved in the analysis of land cover changes.
3. Results and Discussion
)LJXUH'LVWULEXWLRQVRIODQGFRYHUFODVVHVZLWKLQWKH&DQJNULQJDQ6XEGLVWULFWDUHDLQWKUHHGL௺HUHQW\HDUVD EDQGF
3.1. Land cover map
The land cover maps (Figure 3) show the distribution of land cover classes in Cangkringan Sub-district. As indicated in Figure 3, forests are distributed in the northern part, annual crops and dryland farming are mainly located in the middle
)LJXUH6WDFNHGKLVWRJUDPVKRZLQJWKHDUHDOH[WHQWRIODQGFRYHUFODVVHV
)LJXUH7KHFKDQJHLQODQGFRYHUFODVVHVREWDLQHGIURPFKDQJHGHWHFWLRQDQDO\VLV
3.2. Accuracy Assessment
The overall accuracy for the 2001, 2006, and FODVVLÀHGLPDJHVZHUHDQG UHVSHFWLYHO\ ZKLOH .DSSD FRHIÀFLHQWV ZHUH estimated to be 0.84, 0.85, and 0.89 for the 2001, DQGFODVVLÀHGLPDJHVUHVSHFWLYHO\ Congalton (1991) stated that Kappa values above 0.80 (80%) represent strong agreement, a value between 0.40 and 0.80 (40% to 80%) represents moderate agreement, and a value below 0.40 (40%) represents poor agreement. Therefore, the Kappa values of this study represent strong agreement.
3.3. Land cover changes
With regard to winding lava and wind GLUHFWLRQIDFWRUVGXULQJWKHSHULRG²LQ
)LJXUH$QQXDOFURSG\QDPLFVLQWZRGL௺HUHQWSHULRGVD±DQGE±
Spatially, land cover changes in Cangkringan Sub-district mostly occur in the northern and middle parts. In the southern SDUW WKH PRVW VLJQLÀFDQW FKDQJH ZDV WKH increase of settlement areas, followed by the GHFUHDVH RI LUULJDWHG ULFH ÀHOG DUHDV ,Q WKH middle part, there was a conversion of forest land into gardens/plantations, and of bare land into grassland.
The land cover and land use changes in Cangkringan mostly occurred due to the HUXSWLRQRI0HUDSLKD]DUGS\URFODVWLFVÁRZ population increase and economic growth. Based on the data from the Central Bureau of Statistics (BPS) of Sleman Regency, the population decreased to 759,510 people over WKHSHULRG²'XULQJWKHVDPHSHULRG the tourism economy of Cangkringan increased continuously, and the growth averages in the last 10 years reached 0.33% a year (BPS Sleman Regency, 2001; BPS Sleman Regency, 2011). Some of the policies that were carried out include the preparation of a Vulnerability Map, an RDTR Map of Cangkringan Sub-district, and a Spatial Plan (RTRW) of Sleman
Regency, and also the improvement of policy power, incentives, information dominion, and agroforestry implementation (Agrosilviculture, 6LOYRSDVWXUH$JURVLOYRSDVWXUH6LOYRÀVKHU\
the tourism GRDP of the previous year, which was 0.21% (BPS, 2013). This increase allows the addition of buildings or constructions that require large areas of land, in turn, triggering a change in land use types. The relationship between increasing GRDP and population and land use change was also observed by Wu et al. (2008) in the Yangtze Basin region of China.
Economic growth in vulnerable areas of Cangkringan Sub-district is mostly generated by the northern regions, so these exhibit greater land use changes than the southern regions. In general, the increase in GRDP, population growth, and direction of Merapi pyroclastics ÁRZ GRHV QRW IXOO\ LOOXVWUDWH WKH IDFWRUV WKDW cause land use change; however, as a result of the increasing income, population growth, and frequency of eruption disasters, the conversion effort will be higher. These conditions caused the amount suitable land for settlements in the plains to be reduced. The terrain was a typical land type that had groundwater and surface water capacity, and also had good accessibility, which is suitable for residential locations. The land in lowland areas is a potential land for settlements, while the land in upland areas has the potential for tourism, forests or plantations.
/DQGFRYHUDQGODQGXVHFKDQJHVLQÁXHQFH the environment. The study of the relationship between environmental damage and land cover changes in Cangkringan is still limited, but it FDQ EH DVVXPHG WKDW WKH GHÀFLW VWDWXV RI ODQG and water support capacity of Sleman Regency (Bappeda Sleman, 2012) occurred due to land cover changes. The critical land and catchment area were also caused by land damage as a result of land use change. According to Lambin et al. (2003), one the impacts of land use and land cover changes in the tropics is the occurrence of land damage. The World Bank reports that the scarcity of water resources LV WKH PRVW VLJQLÀFDQW HQYLURQPHQWDO WKUHDW in Asian cities, including those in Indonesia (Muta’ali, 2003). The other problems were reduction of catchment areas, deep and shallow JURXQGZDWHUGURXJKWVÁRRGLQJSUREOHPVDQG also the increase of ground hardness (Darmanto et al., 2011); evaluation of water availability as a result of changes in land use, rainfall changes
and population growth as a basis to maintain water availability (Sihotang et al., 2016). The increasing development of settlements and socio-economic activities with more intensity in this region is predicted to potentially trigger uncontrolled spatial conversion and to affect the existence of protected functions (Sugandhy, 1992; Baharuddin et al., 2016).
The increase in the population and the development of concentrated areas on the ÁDQNRI0HUDSLHVSHFLDOO\LQWKHQRUWKKDVSXW pressure on the condition of the water system and the protection function. This is because WKH ÁDQN RI 0HUDSL LV D UHFKDUJH DTXLIHU IRU Yogyakarta Municipality. In addition to the decline in groundwater, physical development that is too fast has also caused land degradation DQG DQ LQFUHDVH LQ ÁRRGV GRZQVWUHDP especially in Yogyakarta Municipality and Bantul Regency. Thus, the disruption of the IXQFWLRQRIWKHÁDQNRI0HUDSLZLOOUHGXFHWKH sustainability of Yogyakarta Municipality and its surroundings. The other potential threats were the increase in the demand for local land, which is expected to lead to the conversion of IRUHVW ODQG DQG JDUGHQV LQWR ULFH ÀHOGV ÀHOGV and settlements; this will also directly decrease the protection function and increase the amount RI FULWLFDO ODQG &RQÁLFWV RI LQWHUHVW EHWZHHQ land use and spatial use are less likely to result in environmental degradation and degradation of territorial and regional functions; these need to be anticipated immediately (Sugandhy, 1992; Rijanta, 2003).
in the analysis, such that the relationship between impacts, causes, and changes in land use can be realised for policy-making materials.
4. Conclusion and Recommendation
This study has determined that in Cangkringan Sub-district, the dominant land cover types were an annual crop that covers more than 40% of the sub-district area; the remaining 60% area was covered by forests, GU\ODQG IDUPLQJ SDGG\ ÀHOGV VHWWOHPHQWV and bare land. Forests were distributed in the northern part, annual crops and dryland farming were mainly located in the middle part, DQGVHWWOHPHQWVDQGSDGG\ÀHOGVZHUHHYHQO\ distributed in the southern part. This study
DOVRHVWLPDWHGWKDWGXULQJWKHSHULRGRI² 2011, the greatest increase in land cover type was that of forests (1,059 ha), while the most decreased type was annual crop (1,164 ha). The annual crops dramatically decreased due to the eruption of Mount Merapi in 2010.
This study also demonstrated that a remote sensing approach could be used as a cost-effective tool to monitor land cover changes in a disaster-prone area. The results, with regard to spatial data and information on land cover changes, can be used by the local government to support the completion of the RDTR document, and can also support the management of disaster-prone areas.
References
%DKDUXGGLQ$:LELVRQR+%3UD\LWQR%5R\FKDQV\DK60,QÁXHQFHRI*HRJVWUXFWXUH of Jayapura City. )RUXP*HRJUDÀ, 30(2): pp.150-157.
Badan Perencanaan Pembangunan Daerah (Bappeda) Kabupaten Sleman. (2012). Rencana Tata Ruang Wilayah Kabupaten Sleman 2011-2031. Kabupaten Sleman : BAPPEDA.
Badan Pusat Statistik Kabupaten Sleman, (2001). Sleman dalam Angka 2001. Kabupaten Sleman : BPS.
Badan Pusat Statistik Kabupaten Sleman (2011), Sleman dalam Angka 2011, Kabupaten Sleman : BPS.
Badan Pusat Statistik Kabupaten Sleman (2013), Sleman dalam Angka 2013, Kabupaten Sleman : BPS.
Bello, O.M., and Y.A. Aina. (2014). Satellite remote sensing as a tool in disaster management and sustainable development: toward a synergistic approach. Procedia – Social and Behavioral
Science²
Broich, M., Hansen, M., Stolle, F., Potapov, P., Margono, B.A. and Adusei, B., (2011) Remote sensed forest cover loss shows high spatial and temporal variation across Sumatera and Kalimantan, Indonesia 2000-2008. Environmental Research Letter, 6.
Bronto, Sutikno, (2001) Vulkanologi. Jurusan Teknik Geologi, Universitas Gadjah Mada, Yogyakarta.
&RQJDOWRQ5$5HYLHZRI$VVHVVLQJWKH$FFXUDF\RI&ODVVLÀFDWLRQVRI5HPRWHO\6HQVHG Data. Remote Sensing of Environment, 37: 35-46.
Darmanto, D., Sudarmadji, Sutikno, dan Maryono A, (2011)Dampak Lingkungan Pemanfaatan Alur Sungai Di Kali Bayong, Kali Kuning, dan Kali Gendol. Jurnal Manusia dan Lingkungan, 18(2):159-172.
Departemen Kehutanan (2008) 'HÀQLVL ,VWLODK. Buku Pintar Bidang Planologi Kehutanan, Departemen Kehutanan. Jakarta:Departemen Kehutanan
biodiversity within East Kalimantan, Indonesia. Applied Geography, 30: 416-425.
Gaveau, D.L.A., Linkie, M., Suyadi, Levang, P. and Leader-Williams, N. (2009) Three decades of deforestation in southwest Sumatra: Effects of coffee prices, law enforcement, and rural poverty. Biological conservation, 142: 597-605.
Gaveau, D.L.A., Wandono, H. and Setiabudi, F. (2007) Three decades of deforestation in Southwest Sumatra: Have protected area halted forest loss and logging, and promoted re-growth? Biological Conservation, 134: 495-504.
Gunawan, T., Herimurti, S., Supangkat, G., Ali. S., dan Gatot Kurniawan, G. (2011) Model Tata Ruang Kawasan Bekas Erupsi Gunungapi Merapi Berbasis pada Ekosistem yang Berwawasan Lingkungan, Berkelanjutan, dan Berbasis pada Masyarakat Lokal . Laporan Penelitian, Sekolah Pascasarjana, Yogyakarta.
Jensen, J.(2005) Introductory Digital Image Processing: A Remote Sensing Perspective (3rd ed.). Upper Saddle River, NJ: Pearson Education, Inc.
Lambin, E.F., H.J. Geist, and E. Lepers. (2003) “Dynamics of Land-Use and Land-Cover Changes in Tropical Regions”. Annual Review of Environment and Resources, 28: pp.205-241.
Leica Geosystems (2005) Erdas Field Guide, Leica Geosystems Geospatial Imaging, LLC, Norcross, GA, USA.
Linkie, M., Smith, R.J. and Williams, N.L.(2004) Mapping and predicting deforestation patterns in the lowlands of Sumatra. Biodiversity and Conservation, 13: 1809-1818
Mulyanto, L. and Jaya, I.N.S. (2004) Analisis Spasial Degradasi Hutan dan Deforestasi: Studi Kasus di PT. Duta Maju Timber, Sumatera Barat. Manajemen Hutan Tropika, X (1), 29-42.(In Indonesian language)
Munibah K. (2008) Model Spasial Perubahan Penggunaan Lahan dengan Pendekatan Celluler Automata: Studi Kasus DAS Cidanau, Provinsi Banten. Majalah Ilmiah Globe. 10 (2): 108-121
Muta’ali, L, (2000) Pola Perkembangan Karakteristik Kekotaan pada Desa-Desa di Propinsi Daerah Istimewa Yogyakarta.0DMDODK*HRJUDÀ,QGRQHVLD, 17(1):16-34.
Muta’ali, L, (2003) Studi Penentuan Desa-Desa Pusat Pertumbuhan di Propinsi Daerah Istimewa Yogyakarta. 0DMDODK*HRJUDÀ,QGRQHVLD 18(1):31-44.
Prenzel, B. and Treitz, P., (2004) Remote sensing change detection for a watershed in north Sulawesi, Indonesia. Progress in Planning, 61: 349-363.
5LMDQWD 5 'HÀQLQJ 5XUDO 'LYHUVLÀFDWLRQ LQ D 6PDOO )DUPLQJ 5HJLRQ 7KH &DVH RI Yogyakarta Special Province, Indonesia, The Indonesian Journal of Geography 12(1):1-10.
Sihotang, V.I., Sudarmadji, Purnama, S.I., Baiquni, M. (2016) “System Dynamic Approach to Support Decision in Maintaining Water Availability (Case Study in Aek Silang Sub-Watershed, the Lake of Toba)”. )RUXP*HRJUDÀ, 30(2): pp.184-197.
Sugandhy, A. (1992) Penataan Ruang Wilayah Berwawasan Lingkungan dalam Menunjang Pembangunan Berkelanjutan. Jurnal Perencanaan Wilayah dan Kota, 5(3):1-16.
6XWLNQR6XQDUWR/DQJJHQJ$QGUL.XUQLDZDQGDQ7DXÀN(QYLURQPHQWDO'HJUDGDWLRQ of Urban Area on Fluvio Volcanic Plain (Case Study of Yogyakarta). The Indonesian Journal of Geography, 6(1):11-18.
Verburg, P.H., and A, Veldcamp. (2001) “The role of spatially explicit models in land-use change research: a case study for cropping patterns in China”. Agricultural, Ecosystems and Environment, 85:pp. 177-190.
Wu, X., Z. Shen, R. Liu, and X. Ding (2008) “ Land Use/Cover Dynamics in Response to Changes in Environmental and Socio-Political Forces in the Upper Reaches of the Yangtze River, China”. Sensors, 8:pp. 8104-8122.
Yiyi, S., (2011) Integrasi Teknologi Basisdata dan Pemodelan Dalam Pemetaan Tanah, Warta Sumberdaya Lahan, Media Komunikasi Masyarakat Peduli Sumberaya Lahan, 4(2):1-11.