(IJSBAR)
I SSN 2 3 0 7 - 4 5 3 1 (Print & Online)
http://gssrr.org/index.php?journal=JournalOfBasicAndApplied
---
Variability of Surface Chlorophyll-a in the Makassar
Strait – Java Sea, Indonesia
Muhammad Syahdan
a*, Agus S. Atmadipoera
b, Setyo Budi Susilo
c, Jonson L.
Gaol
da
Faculty of Fisheries and Marine Sciences, Lambung Mangkurat University,
Banjarbaru, 70721, Indonesia
b,c,d
Faculty of Fisheries and Marine Sciences, Bogor Agricultural University, Bogor, 16680, Indonesia
a
Eleven years (2002-2012) of surface chlorophyll-a (chl-a) data from the Aqua-MODIS satellite were analyzed to
determine spatial pattern and temporal variation in the key region for the small pelagic fishery between the
Makassar Strait and the Java Sea Indonesia. The surface chl-a time-series data can be explained by the first two
eigenvectors mode, which accounted for about 90% of total variance. The first eigenvector mode (86%)
displays a map of contours that are maxima in the northern Java and western Sulawesi, and are minima around
Kalimantan. The corresponding principal component is mostly the annual fluctuation of chl-a with a maximum
(minimum) during the peak of the northwest monsoon (the southeast monsoon) periods. There is a phase-lag of
about 6-month of chl-a maxima between the northern Makassar Strait and the western Java Sea. On
inter-annual time-scale fluctuation of chl-a is well correlated with the El Nino Southern Oscillation variability in the
Pacific Ocean, as well as, the Indian Ocean Dipole Mode.
Keywords: surface chlorophyll-a; Aqua-MODIS satellite; EOF analysis; Makassar Strait; Java Sea Indonesia.
---
* Corresponding author.
1. Introduction
Chlorophyll-a is an important pigment contained in phytoplankton for photosynthesis process, thus it becomes
an indicator of the marine primary productivity level. The fluctuation of chlorophyll-a in the ocean is strongly
influenced by oceanographic factors such as currents, seawater temperature, salinity, and nutrient. In addition,
the nutrient content of the waters is closely related to the chlorophyll-a concentration in which the more the
nutrient content of the water the higher the chlorophyll-a concentration [1].
The Makassar Strait waters exhibits much higher primary productivity than the others waters in Indonesia [2,3],
which occurs throughout the year, both in the northwest monsoon (NWM) and in the southeast monsoon (SEM)
periods. During the NWM, the high level of primary productivity is due to the runoff from the mainland of
Kalimantan and Sulawesi in large numbers due to the high precipitation rate. While during the SEM, high
primary productivity occurs due to the seasonal upwelling in the southern tip of Makassar [3].
The chlorophyll-a (chl-a) concentration in the Java Sea reported by [4] showed that in the western part of Java
Sea, distribution of chl-a is relatively similar in both seasons, but in the eastern Java Sea the chl-a concentration
increases during the SEM. Besides the seasonal fluctuations, inter-annual climate variability of ENSO and
perhaps the Indian Ocean Dipole Mode (IODM) also affects the chl-a concentrations. During the El Nino year,
sea surface temperature (SST) indicates negative anomaly and SST decreases to about 25.3 °C, whereas in the
eastern Java Sea occurs positive anomaly of chl-a concentration [4].
This study attempts to investigate the spatial pattern and temporal variation of chl-a concentration between
Makassar Strait and Java Sea. This region is well known as a fishing ground in a large-scale fishery, primarily
by the purse seine fleet [5,6]. It is expected that this study could contribute useful information for fishery
management purposes.
2. Materials and Methods
The study area is located in the Makassar Strait and in the Java, Sea Indonesia (Fig. 1). The surface chl-a data
have been acquired by the Aqua-MODIS satellite imagery Level-3 with the spatial resolution of 0.05° x 0.05°
and temporal resolution of 8-day and time coverage from July 2002 to December 2012 (or about 11 years). The
data were obtained from the website of the Pacific Islands Fisheries Science Center (PIFSC) which was part of
the National Oceanic and Atmospheric Administration (NOAA) - USA [7]. The OC3M algorithms, developed
by O 'Reilly, et.al. 2000 vide [8], has been implemented to estimate the chl-a concentration, using by the
following equation :
�= 10(�0+�1�+�2�2+�3�3+�4�4)
�= 0.2830,−2.753, 1.457, 0.659,−1.403
�=���10����443 >���488
���551 �
Rrs is remote sensing reflectance
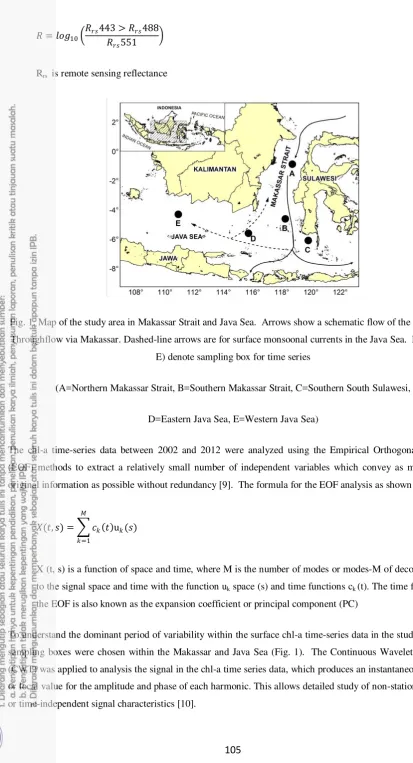
Fig. 1. Map of the study area in Makassar Strait and Java Sea. Arrows show a schematic flow of the Indonesian
Throughflow via Makassar. Dashed-line arrows are for surface monsoonal currents in the Java Sea. Letters
(A-E) denote sampling box for time series
(A=Northern Makassar Strait, B=Southern Makassar Strait, C=Southern South Sulawesi,
D=Eastern Java Sea, E=Western Java Sea)
The chl-a time-series data between 2002 and 2012 were analyzed using the Empirical Orthogonal Function
(EOF) methods to extract a relatively small number of independent variables which convey as much of the
original information as possible without redundancy [9]. The formula for the EOF analysis as shown below :
�(�,�) =� ��(�)u�(�) �
�=1
X (t, s) is a function of space and time, where M is the number of modes or modes-M of decomposition
to the signal space and time with the function uk space (s) and time functions ck (t). The time function in
the EOF is also known as the expansion coefficient or principal component (PC)
To understand the dominant period of variability within the surface chl-a time-series data in the study area, five
sampling boxes were chosen within the Makassar and Java Sea (Fig. 1). The Continuous Wavelet Transform
(CWT) was applied to analysis the signal in the chl-a time series data, which produces an instantaneous estimate
or local value for the amplitude and phase of each harmonic. This allows detailed study of non-stationary spatial
Following [10], the CWT method is formulated as follows :
one has a wavelet function,y, that depends on a nondimensional “time” .To be “admissible” as a
wavelet, this function must have zero mean and be localized in both time and frequency space. The (*)
indicates the complex conjugate. By varying the wavelet scale s and translating along the localized time
index n, one can construct a picture showing both the amplitude of any features versus the scale and
how this amplitude varies with time
The wavelet transform can be used as a band-pass filter of uniform shape and varying location and width, as
described in detail in [10]. Here, the low-frequency band-pass filter of chl-a time-series data on semi-annual,
annual, and inter-annual were applied. Reconstructed new time-series of chl-a on these time-scales period are
analyzed and compared within 5 sampling boxes.
3. Results and Discussion
3.1. Mean and Standard Deviation of Surface Chl-a
Direct speaking, it is shown that distribution of high chl-a concentration (above 1 mg/m3) appears around the
coastal area of Kalimantan (Fig. 2). Previous studies showed that total suspended matter may contribute
significantly to the “high chl-a” concentration around Kalimantan [11]. Distribution of low chl-a content of
about 0.1 - 0.2 mg/m3 is observed in the northern part of the Makassar Strait closer to the west coast of Sulawesi.
This means that the northern entrance of Makassar is low chl-a content, which occurs throughout years.
Fig. 2. Mean (2002-2012) (left) and standard deviation (right) of chl-a concentration (mg/m3) in the study area
The Java Sea and the northern part of Makassar Strait (closer to the coast of the Kalimantan) shows moderate
chl-a content of 0.3 to 0.4 mg/m3 with standard deviation of about 0.15. The southern tip of the Sulawesi
respectively. This implies that high mean chl-a concentration in this region is followed by high variation over
the time. Low mean and standard deviation of chl-a content is visible in the southeastern part of the study area.
3.2. The Spatial Pattern and Temporal Fluctuation of Chl-a Concentration
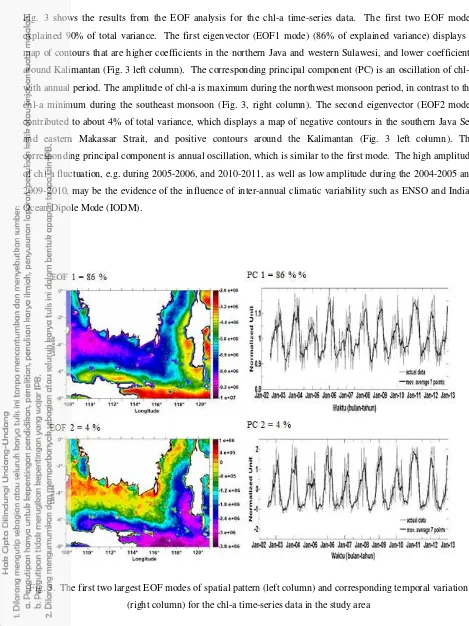
Fig. 3 shows the results from the EOF analysis for the chl-a time-series data. The first two EOF modes
explained 90% of total variance. The first eigenvector (EOF1 mode) (86% of explained variance) displays a
map of contours that are higher coefficients in the northern Java and western Sulawesi, and lower coefficients
around Kalimantan (Fig. 3 left column). The corresponding principal component (PC) is an oscillation of chl-a
with annual period. The amplitude of chl-a is maximum during the northwest monsoon period, in contrast to the
chl-a minimum during the southeast monsoon (Fig. 3, right column). The second eigenvector (EOF2 mode)
contributed to about 4% of total variance, which displays a map of negative contours in the southern Java Sea
and eastern Makassar Strait, and positive contours around the Kalimantan (Fig. 3 left column). The
corresponding principal component is annual oscillation, which is similar to the first mode. The high amplitude
of chl-a fluctuation, e.g. during 2005-2006, and 2010-2011, as well as low amplitude during the 2004-2005 and
2009-2010, may be the evidence of the influence of inter-annual climatic variability such as ENSO and Indian
Ocean Dipole Mode (IODM).
Fig. 3. The first two largest EOF modes of spatial pattern (left column) and corresponding temporal variation
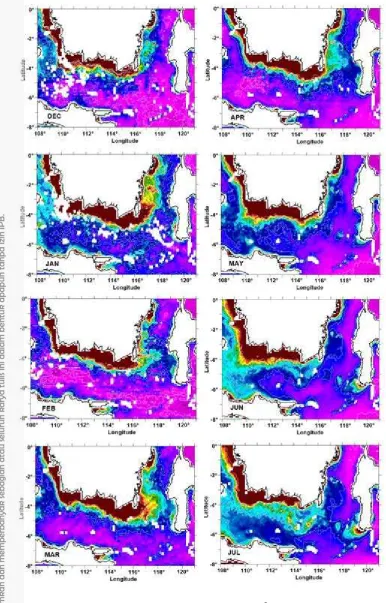
3.3. Annual cycle of chl-a concentration
The first order to understand the variability of the chl-a in the study area is by examining the data in term of
annual cycle (Fig. 4). During the peak of the NWM (December to February), chl-a concentrations vary between
0.30 and 0.45 mg/m3 that is on the west coast of the Sulawesi and the western part of the Java Sea. The low
chl-a concentrchl-ation of chl-about 0.1 - 0.15 mg/m3 appears prominently on the southern part of the Makassar Strait to
southern part of South Sulawesi and partly in east region of the Java Sea (Fig. 4). High chl-a concentration is
located in the east coast of the Kalimantan ranging from 0.40 to 0.85 mg/m3.
During the first transition monsoon period (from March to May), chl-a concentration ranges between 0.3 and 0.4
mg/m3. This condition also resulted in increasingly lower concentrations of chl-a in the bulge area on the east
coast of Kalimantan Island so the scope is narrowed even disappear. This time is a formation forerunner of high
concentrations in the southern part of South Sulawesi, which stems from the range of 0.3 to 0.6 mg/m3.
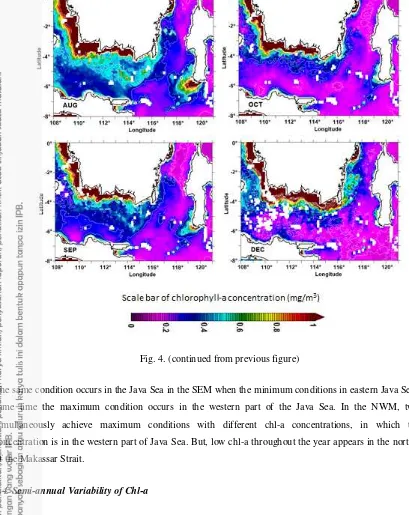
During the SEM (from June to August), the formation of a high concentration in coastal Kalimantan switches to
the southern part and its bulge leads to the eastern Java Sea that ranges 0.45 to 0.85 mg/m3 with an increase
throughout the season. In some areas in the northern Makassar Strait have low concentration about 0.1 mg/m3,
but in the southern part, its concentration of 0.3 mg/m3 separates the high concentration in the eastern Java Sea
and the southern Makassar Strait. In the southern part of the Makassar Strait the concentration looks clearly
experiencing an increase throughout the season and expanding coverage. The high chl-a concentration is near
the mainland then decreases toward offshore with a range from 0.4 to 1 mg/m3.
On the second transition monsoon period (from September to November), chl-a concentrations appear low in
almost all regions with a range of 0.15 to 0.25 mg/m3. In the northern of Makassar Strait, low concentrations
experiences the expansion to the southern part of the Makassar Strait thus lowering the chl-a concentration in
the region in which previously reached a maximum in the SEM.
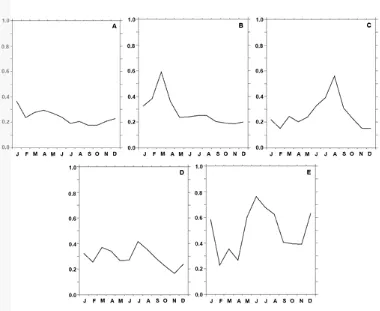
The annual cycle of chl-a in the five sampling areas exhibits different peaks of chl-a, which may indicate a
phase lag of high chl-a signal propagation from the northern Makassar to the Java Sea (Fig. 5). Chl-a in
Makassar Strait region exhibit a maximum and minimum, while the Java Sea has two maxima and minima. Low
amplitude of the fluctuation is seen in the northern Makassar Strait, but in the Java Sea high amplitude of chl-a
fluctuation occurs between 0.20 and 0.40 mg/m3 (Fig. 5).
The high fluctuations in the Makassar Strait occur in southern Makassar Strait and western Java Sea with a
range of 0.2 to 0.8 mg/m3. In the Makassar Strait region is seen the minimum and maximum conditions, which
are interchangeable between the west and east season. It can be seen that when the concentration of chl-a
presence reaches a minimum in the southern Makassar Strait in March (west season), at the same time the
maximum condition occurs in the southern part of South Sulawesi. Otherwise, it occurs in August (east season),
when the southern part of South Sulawesi has minimal chl-a, but in the southern part of the Makassar Strait
Fig. 4. Annual cycle of chl-a concentration (mg/m3) in the study area
Fig. 4. (continued from previous figure)
The same condition occurs in the Java Sea in the SEM when the minimum conditions in eastern Java Sea. At the
same time the maximum condition occurs in the western part of the Java Sea. In the NWM, two areas
simultaneously achieve maximum conditions with different chl-a concentrations, in which the high
concentration is in the western part of Java Sea. But, low chl-a throughout the year appears in the northern part
of the Makassar Strait.
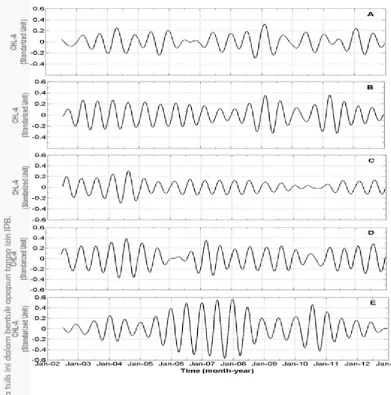
3.4. Semi-annual Variability of Chl-a
Chl-a concentration variability in a semi-annual period of the overall observation time is shown in Fig. 6. At the
northern Makassar Strait is seen the changing conditions in the achievement of both maximum and minimum
chl-a. At the beginning of observations from 2002 to 2004, the maximum condition occurs in the first (April)
and second transition monsoon period (November), while the minimum condition occurs in NWM (January) and
SEM (August). At the end of observation (2009 to 2012), tends to be otherwise namely the maximum condition
occurs on the NWM (February) and the SEM (August), while the minimum conditions are likely on the first
(May) and second transition monsoon periods (November). At mid-observation time (2005 to 2008),
Fig. 5. Annual cycle of chl-a concentration (mg/m3) in the 5 sampling areas
(A=Northern Makassar Strait, B=Southern Makassar Strait,
C=Southern South Sulawesi, D=Eastern Java Sea, E=Western Java Sea)
In four other regions, the conditions tend to be stable namely the maximum attainment tends to occur in the
NWM (February) and the SEM (August), while the minimum achievement occurs in the second (November)
and first transition monsoon periods (May).
Shifting maximum peak of chl-a at the beginning of observation (2002 - 2004) shows that the chl-a maximum
achievement in the northern part of the Makassar Strait is faster 2 to 3 months if compared to the three other
regions namely the southern Makassar Strait, Southern South Sulawesi and Eastern Java Sea, while western Java
Sea, its achievement of 5 months is earlier than the three region. It can be seen that the maximum achievement
in the Northern Makassar Strait reaches in April-May and October-November, while the three other locations
reach peak in February to March and August. In the Western Java Sea reaches the fastest maximum peak in July
and December to January.
In the mid-term observation period (2005 to 2012), three areas tend to experience maximum condition achieved
of 1 to 2 months that is faster than the Northern Makassar Strait and Western Java Sea. This can be seen when
the maximum condition achievement at three locations in February and August, and achievement in the
Fig. 6. Semi-annual band-pass filtered of chl-a time-series data in five sampling areas.
(A=Northern Makassar Strait, B=Southern Makassar Strait,
C=Southern South Sulawesi, D=Eastern Java Sea, E=Western Java Sea)
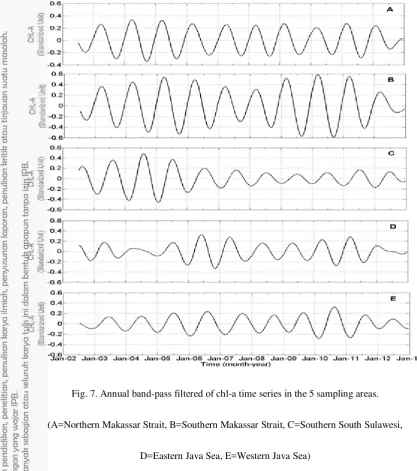
3.5. Annual Variability of Chl-a
Chl-a variability on annual time-scale (Fig. 7) displays the chl-a maximum during the peak of NWM (in
January) in the Northern Makassar Strait and then undergoes a phase lag into April and July when it is located in
the southern part of the Makassar Strait and Southern South Sulawesi. The highest amplitude of fluctuation
occurred in 2005-2006 and 2009-2011 in the southern area of Makassar Strait.
In the Java Sea, annual fluctuation tends to be quasi-stable, but there is a phase lag of the chl-a maximum,
indicating a westward propagation of chl-a maxima in the Java Sea. For example, between 2004 and 2006, the
the Java Sea, the chl-a maximum occurred in April and a minimum in October, in contrast to the western part of
Java Sea (Fig. 7).
Fig. 7. Annual band-pass filtered of chl-a time series in the 5 sampling areas.
(A=Northern Makassar Strait, B=Southern Makassar Strait, C=Southern South Sulawesi,
D=Eastern Java Sea, E=Western Java Sea)
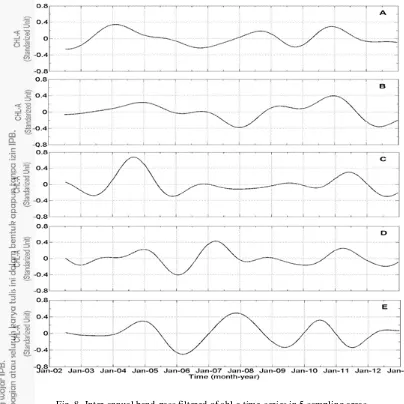
3.6. Inter-annual Variability of Chl-a
Fluctuation of chl-a concentration on inter-annual period (Fig. 8) showed phase lags of chl-a maxima in the
sampling locations. For example, among 2004-2005, the chl-a maximum in the northern part of the Makassar
Strait appear in January 2004, then lagged to the southern part and western part of Java Sea in January 2005.
Between 2005-2006, the chl-a minimum appeared in October 2006 in the northern part of the Makassar Strait,
which shifted towards the southern reached the transition in the southern part of South Sulawesi in October
2005, then progressively decreased until reaching the minima in the western part Java Sea in March 2006. The
chl-a two maxima occurred in 2004- 2005 and 2010-2011, while the chl-a minima occurred twice also in
seen in the data with an increase of chl-a during the La Nina year (e.g., 2007-2008, and 2010-2011) and a
decrease during the El Nino (for example, in 2009-2010). Strong inter-annual climatic variability of the Indian
Ocean Dipole Mode (IODM) in 2004-2005 and 2006-2007 is also responded by the surface chl-a (Fig. 8), with
chl-a maxima (minima) during the IODM positive (negative), respectively.
Fig. 8. Inter-annual band-pass filtered of chl-a time-series in 5 sampling areas.
(A=Northern Makassar Strait, B=Southern Makassar Strait, C=Southern South Sulawesi,
D=Eastern Java Sea, E=Western Java Sea)
4. Conclusions
According to the results and discussion, it can be concluded that:
1. The spatial pattern and temporal fluctuation of surface chl-a time-series data among 2002-2012 in the
study area can be represented by the first two eigenvector modes which accounted for about 90% of
2. On seasonal time-scale, high chl-a concentration is formed during the NWM period, in the eastern side
of the Kalimantan, while during the SEM period, this maximum moved to the southern side of the
Kalimantan.
3. Large amplitude of seasonal variability of chl-a appears in the southern part of South Sulawesi. The
chl-a reaches maximum during the peak of SEM and minimum during the NWM period.
4. Low amplitude of chl-a fluctuation occurred in the northern part of Makassar, while high chl-a
fluctuation occurred in the southern part of Makassar Strait to South Sulawesi. Moderate chl-a fluctuation
appears in the northern part of the Makassar Strait (the east side of the Kalimantan Island) to east and west of
Java Sea. There is a phase lag (about 2-3 months) of chl-a maxima between the northern and southern
Makassar. Also it appears the phase lag (of about 5 months) of chl-a maxima between eastern and western
Java Sea. On inter-annual time scale, the a maxima occurred in 2004-2005 and 2010- 2011, and the
chl-a minimchl-a were in 2005-2006 chl-and 2009-2010.
References
[1] Afdal and S.H. Riyono. “Sebaran Klorofil-a Kaitannya dengan Kondisi Hidrologi di Selat Makassar”.
Oseanologi dan Limnologi di Indonesia. 36: 69-82. 2004.
[2] A.G. Illahude. “On The Occurance of Upwelling in Southern Makassar Strait”. Marine Research in
Indonesia. 10: 81-107. 1970.
[3] Illahude AG. “On The Effecting The Productivity of The Southern Makassar Strait”. Marine Research in
Indonesia. 21: 81-107. 1978.
[4] J.L. Gaol and B.Sadhotomo. “Karakteristik dan Variabilitas Parameter-Parameter Oseonografi Laut Jawa
Hubungannya dengan Distribusi Hasil Tangkapan Ikan”. Jurnal Penelitian Perikanan Indonesia Vol. (13) No. 3.
Pusat Riset Perikanan Tangkap-Badan Riset Kelautan dan Perikanan. 2007.
[5] S.B. Atmaja and D. Nugroho. “Aspek Reproduksi Ikan Layang Deles (Decapterus macrosoma) dan Siro
(Amblygaster sirm) sebagai Pertimbangan dalam Pengelolaannya di Laut Jawa”. Jurnal Penelitian Perikanan
Indonesia Vol.1 No.3. 1995.
[6] U. Chodriyah and T. Hariati. “Musim Penangkapan Ikan Pelagis Kecil di Laut Jawa”. Jurnal Penelitian
Perikanan Indonesia Vol.16 No.3. 2010.
[7] http://oceanwatch.pfeg.noaa.gov, accessed on Februari 15th, 2012.
[9] Y. Pan, D. Tang, and D. Weng. “Evaluation of the SeaWiFS and MODIS Chlorophyll-a Algorithms Used for the Northern South China Sea during the Summer Season”. Terr. Atmos. Ocean. Sci., Vol. 21, No. 6, 997-1005.
Dec. 2010.
[10] C. Torrence and G.P. Compo. “A Practical Guide to Wavelet Analysis”. Bull. Amer. Meteor. Soc., 79: 61–
78. 1998.
[11] D. Eisma, J. Kalf, M. Karmini, W.G. Mook, A. Van Put, P. Bernard and R. Van Grieken. “Dispersal of
Suspended Matter in Makasar Strait and the Flores Basin”. Netherlands Journal of Sea Research 24 (4):