AUSTRALIAN JOURNAL OF BASIC AND
AP-This work is licensed under the Creative Commons Attribution International License (CC BY). http://creativecommons.org/licenses/by/4.0/
To Cite This Article: Abd. Rahman Bando, Marsoedi, Adi Susilo, Andi Tamsil., Identifying Potential Flood Caused by Sea Level Rise at Northern Coastal Regions of Makassar City. Aust. J. Basic & Appl. Sci., 11(5): 12-19, 2017
Identifying Potential Flood Caused by Sea Level Rise at Northern Coastal
Regions of Makassar City
1Abd. Rahman Bando, 2Marsoedi, 3Adi Susilo, 4Andi Tamsil
1PhD Student, Doctoral Program of Environmental Studies, Graduate School, University of Brawijaya, Mayjen Haryono No. 169, 65145
Malang, Indonesia
2Professor, Faculty of Fisheries and Marine Science, University of Brawijaya, Veteran Malang, 65145 Malang, Indonesia. 3Lecturer, Faculty of Mathematics and Natural Sciences, University of Brawijaya, Veteran Malang, 65145 Malang, Indonesia, 4Lecturer, Islamic University of Indonesia Makassar, Urip Sumohardjo KM. 05, 90231, Makassar, Indonesia
Address For Correspondence:
Abd. Rahman Bando. University of Brawijaya, Doctoral Program of Environmental Studies, Graduate School, Mayjen Haryono 169, 65145 Malang, Indonesia.
Background: The coastal area of north Makassar has a flat topography with approxi-mate range of 0-6 m above sea level. Therefore the area has potential flood inundation due to rise in sea level. Objective: This study was aimed to provide an overview of the potential threat of flood inundation in the northern part of the Makassar City coastal region. Method: The method used was spatial analysis which was utilized to identify, analyze and define the land function functions as a result of sea level rise. Results: The results exhibits that the coastal region north of Makassar is potentially affected by rise in sea level based on a scenario simulation. In 2025, the flooded area will be 76.82 ha and in 2100 it will increase to 681.05 ha which included industrial area, open land, mangrove forests, port, and education area in 2025 and 2050. Settlements, reclamated area, wilderness and weirs are also affected. In 2075 and 2100 it will affect agricultural areas. Conclusion: Rising sea levels are caused by flood inundation in coastal areas north of Makassar.
INTRODUCTION
The coastal region is very significant for human life on earth. It serves as transitional area of land and sea containing unique ecosystem. The world has a concern for the region, particularly environmental field in the context of sustainable development. Historically, the world's major cities located not far from the sea, as the region has the potential of marine resources and fisheries, and facilitates trade between regions, islands and con-tinents.
Based on Constitution Law No. 27 2007 concerning Management of Coastal Areas and Small Islands, coastal areas are lands that between shoreline to administrative boundaries, seaward region is 12 miles seaward from shoreline. So the coastal area is an area or region rich in potential both in terms of economy, tourism, re-sources and great potential disaster. However, in the limits of ecology, coastal areas and inland are still influ-enced by the sea and vice versa.
Sea level rise (SLR) due to global warming is one of the parameters that make a significant contribution in coastal region (Ewing, 2009), where SLR is one factor that accelerates the erosion rate, shifts the coastline, and expands inundation area along the coast (Latif et al., 2010). In addition, on the moment sea level and
tempera-ture rises beyond normal limits of marine organisms’ capability to adapt could damage sea and coastal ecosy s-tems (Latif et al., 2010).
Makassar City possesses area of 175.77 km2, as well as coastal resources potential supported by
approxi-mately 30 km long coastline, and is located in the Indonesian archipelagic sea lanes II (ALKI II) bordering Ma-kassar Strait. It promotes trade by sea, tourism, port activity, industrial activities and high development potential for coastal areas makes Makassar coastal region evolved since the early 16th century. Judging from the economic
aspect, Makassar coastal region also affected the rapid changes in the value or opportunity cost of coastal land. Port needs to be developed due to trade flows, land requirement for Water Front City development due to in-creasing number of people with middle and high tier income demanding higher quality residential location (Hi-dayat, 2012).
In the process of its development, sea level rise could change the layout of coastal areas potential, especial-ly around the Makassar coastal region. Sea Level Rise could develop into a disaster which needs to be aware of and anticipated in terms of Makassar coastal region and its ancillary aspects in the face of catastrophic sea level rise. It is done to ensure future development which was based on disaster mitigation by measuring sea level rise in order to anticipate the SLR disasters.
The coastal region north of Makassar City covers four districts as strategic regions. In this region there are a variety of activities such as ports, aquaculture, small fishing area fishing, industrial estates, intercity roads, set-tlements and buildings. These activities affect and contribute towards Makassar City overall development rate. These activities put pressure on the sustainability of mangrove forests in the region, which in turn could pose a threat to the protection of the coastal area itself from disasters caused by flood inundation. Threats involve tidal waves, billows, damage weirs, destruction by high winds to settlements in northern coastal region of Makassar city which is utilized for settlements and various activities. Environmental Data Development Center (PPLH) Sulawesi mentions that the sea level rise in Makassar Old Town increased to an average of 0.8 to 0.9 cm / year (Hidayat, 2012). This suggests that the threat to Makassar coastal region due to climate change is exists and re-quires strategic steps to mitigate it.
As an effort to mitigating disasters due to climate change by mangrove ecosystems, it will require provision of database and information regarding area potentially affected by flood inundation. Therefore it will support mitigation efforts in coastal areas. This study was conducted to provide an overview of the potential threat of flood inundation in the northern part of the Makassar City coastal region, finding sea level rise and presenting it in the form of spatial data and investigating land function in the vicinity of the region affected by flood inunda-tion.
MATERIALS AND METHOD
This research was conducted in the north coastal areas of Makassar City which includes Buloa, Tallo, Pa-rangloe, Untia and Bira villages. The study last started in November 2015 to February 2016. For the purposes of the analysis of data collection, Aster Digital Elevation Model Shuttle Radar Topography Mission recorded of 30/12/2015 with a spatial resolution of 30 m, the tide data of Makassar, Indonesia contour data RBI scale of 1: 25,000 with an interval of 6.5 m Bakosurtanal. Data processing was performed by kriging / co-kriging interpola-tion method using ArcGIS mapping software and global mapper. This processing appears in the form of digital elevation model that will be the base for determining the location of inundation caused by sea level rise.
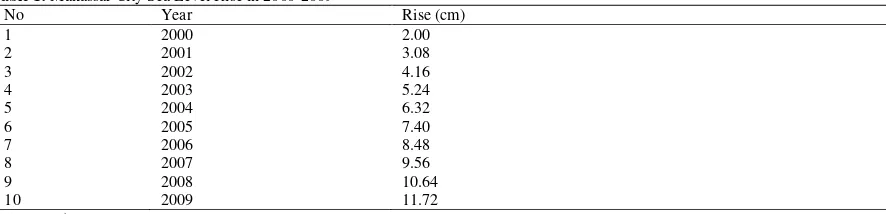
Sea-level rise at Makassar city in 2050 and 2100 was projected to increase by 56 cm and 110 cm, while the sea level rise from 2000 to 2009 is exhibited in Table 1. The inundation models obtained with the formulation of location with lower elevation level compared to sea level rise in a year, then that location will be the stagnant spot.
Table 1: Makassar City Sea Level Rise in 2000-2009
RESULTS AND DISCUSSION
Topography conditions:
Makassar City has topography of 0-2° slope (flat) and land slope of 3-15° (corrugated) with a stretch of low land at an altitude between 0-25 m above sea level. This condition makes Makassar suffers from flood during
rainy season, especially when rains coincide with rising tide. In general, Makassar City’s topography is grouped into two parts:
• The western part towards north is relatively low, especially near the coast; and • The eastern part has hilly topography such as Antang in Panakukang District.
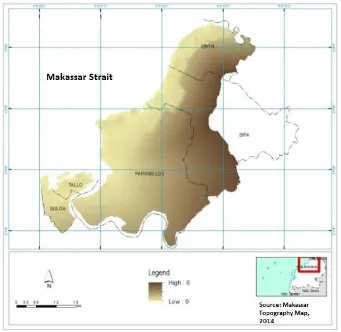
Makassar physical development reaches the eastern part of the city. It is seen by loyal housing development in Sub Biringkanaya, Tamalanrea, Mangala, Panakkukang, and Rappocini. Research site was located in the northern part of the coast of Makassar, which is dominated by flat area. At a distance of 500 m from shoreline it gained altitude between 0 to 6 m which was the highest sea water level contained in the study area. Details can be seen in Figure 1.
Fig. 1: Topography Condition Map for Coastal Region North of Makassar City
Conditions of Land Usage:
Definition of land function and land cover is important for a variety of planning and management activities
related to the earth's surface. Land cover associated with appearance type on earth’s surface, while the land
function related to human activity on certain land region (Lillesand and Kiefer, 1993). Changes in land cover are a form of addition, subtraction, and the transition from the previous land function to another function.
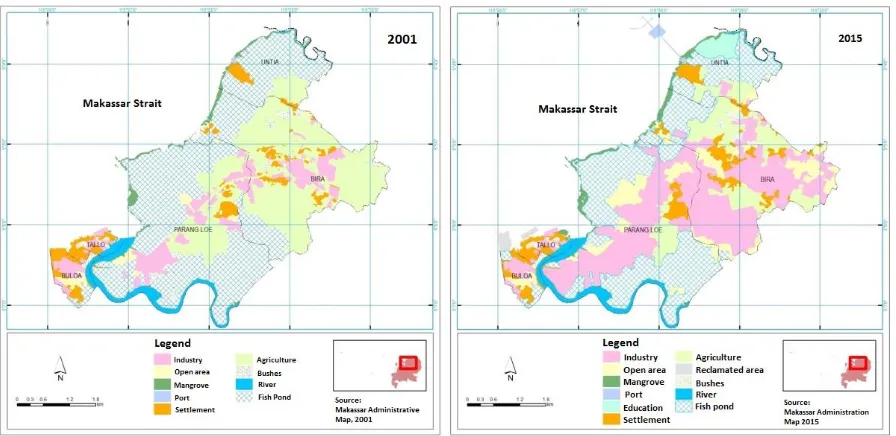
Fig. 2: Land Function Map on 2001 and 2015. (Source: Analysis Result, 2016)
Table 2: Land Cover 2001 and 2015 Range Comparison
No Land Cover Year Change Information
Data source: Google Earth 2001 and 2015 data analysis.
Changes in land function (land function change) include addition, subtraction and or shifts in land function towards the different land function (conversion) or intensification on existing land function. In general, accord-ing to closure based classification Bakosurtanal (SNI), land function are divided into nine classes, includaccord-ing land cover for industrial, open land, mangrove, ports, residence, agriculture, shrubs, rivers and weirs.
Changes in land cover image analysis results in 2001 and 2015 exhibits changes in the cover values and the percentage varied widely. The cover changes occur in addition of industrial activities cover reached about 542.52 ha or 219% increase land cover for industrial activities in 2001. The addition of comprehensive results from changes in land cover is shrubs, ponds, agricultural and open land. It is caused by several factors, such as Makassar City development into integrated industrial park. Extra land cover also occurs in open land, from the image data taken in 2001, it was exhibited as much as 40.88 ha to 210 ha and expanded up to 170.07 ha, which was around 416%. Changes in land cover caused wide addition of agricultural land conversion and shrubs.
Data in Table 2 exhibited changes in land cover for mangrove vegetation. Mangrove vegetation gained ad-ditional area as much as 8.23 ha or 16% compared to area covered in 2001. The addition of mangrove area was caused by changes in land cover in rivers, shrubs and weirs. There were several possibilities, among others, fail-ure to provide rehabilitation through mangrove planting by DKP Makassar City and the central role community through independent mangrove culture.
There were locations around the north of Makassar especially Untia and Bira villages, in which increase in cover occurred. Land cover increase occurred in the port area approximately 11.06 ha or 851% compared to 2001. These increases were related to the interests of Makassar as a World City, trading as well as Service City. Subsequent changes occurred on the settlement. Growth in residential / urban in Makassar reached 24%. Image analysis on residential area in 2001 covered an area of 132.92 ha, whereas in 2015 it increased to 165.26 ha, with addition of 32.34 ha (Table 2).
de-creased by 1.48 ha or 2% of the total in 2001. Decrease in river cover caused by land conversion for residential, industrial, and open land around river shore. Weirs experienced reduction in cover up to 302.30 ha or 30% of the total land cover in 2001. Weir is converted into industrial and residential region.
Land function at research sites tend to change based on the conditions of the increasing open land or the de-crease in rain water catchment areas. Changes in land cover will affect the entire ecological system including hydrology in coastal areas. Large-scale impact will be seen on the fluctuations of sea water getting in to land/ intrusive rising sea water through tidal flood / sea water inundation.
Tidal conditions of Makassar:
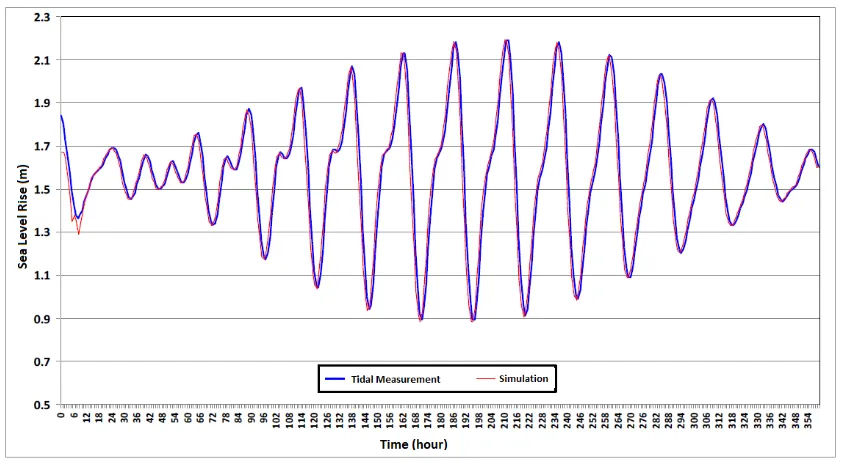
Tidal conditions of Makassar City refers to the results of studies that have been done prior to this research which was done by Arifin et al. (2012) which states that the type of tidal waters of Makassar Beach was a mixed diurnal type (single daily) with amplitude of 0.88 to 2.18 m of the average sea level.
Fig. 3: Comparison of water level simulation results with measurements for 15 days in the waters of Makassar
Beach at 119° 21’ 49,50’’BT and 5° 11’ 56,35’’LS. (Source: Arifinet al., 2012)
Fluctuations in sea level simulation results will be followed by the periodic movement of water masses (Hatayama et al., 1996; Arifin et al., 2012) as shown in Figure 3. Water level (elevation) simulation results were done by comparing it with the results of field data measurement. Furthermore, the pattern of tidal currents in tidal conditions towards the full ebb showed the flow dominated by the movement westward away from coastal waters of Makassar with maximum speed reaching 0.003 m / sec (Figure 4). Flow pattern lowest elevation at full ebb was dominated by west bound current, away from the coastal waters of Makassar with the maximum speed up to 0.012 m / sec. The pattern of the water mass flow on the tidal conditions towards the tide is domi-nated by the flow moving toward the east and then the current is turned along Makassar coast. Current rate reached a maximum of 0,002 m / sec. Highest elevation pattern on tide current was still dominated by the cur-rent moving toward the east approaching the coast of Makassar with a maximum speed reached 0,009 m / sec. Tidal current pattern in numerical simulation were dominated by current leading to west and north. Therefore it is compatible to study conducted by Nurfaida (2009) in the Arifin et al., (2012) in the coastal waters of Makas-sar.
Fig. 4: Pattern of average currents on tidal (a) low tide, (b) lowest tide, (c) high tide, (d) highest tide. (Source: Arifin et al., 2012)
Sea Level Rise Scenario:
Makassar City’s sea level ranges from 1-25 meters from sea surface with an average ground slope 0-5º west bound. Based on the geological map, rock types surrounding Makassar is covered by tertiary and quarter types which are volcanic rocks and alluvial deposits. Based on UNFCCC forum analysis, 100 years in the future sea level will rise as high as 110 cm as a result of the increase in global temperature of 6oC. Therefore it would threaten islands and coastal areas that can submerge the mainland to the limit of height above average sea level (Makassar City Zoning Plan, 2014).
Hidayat (2012) mentioned that the Sea-level rise of Makassar city in 2050 and 2100 is projected to increase by 56 cm and 110 cm. With modifications to the latest projection it is exhibited that the last 10 years starting in 2000-2009 has significant increase in sea levels on average each year by 15.67%.
Based on result mentioned above, the rise in sea level is caused by wind global warming, and tides with 11.56% percentage of feedback is taken and taken the average pool of up to 100 years into the future. By using the projection method of analysis, post-censal (after the increase) predicts that by 2025 the sea level rise up to 32.34 cm or 0.32 m. In 2100 the sea level rise 122.67 cm, or about 1.22 m from the level of the current sea level (Hidayat, 2012).
Table 3: Sea Level Rise Prediction 2025-2100
No Projected Year Flood Projection (cm)
1 2025 32.34
2 2050 62.45
3 2075 92.56
4 2100 122.67
Source: Hidayat, 2012
Stagnant Model of Sea Level Rise:
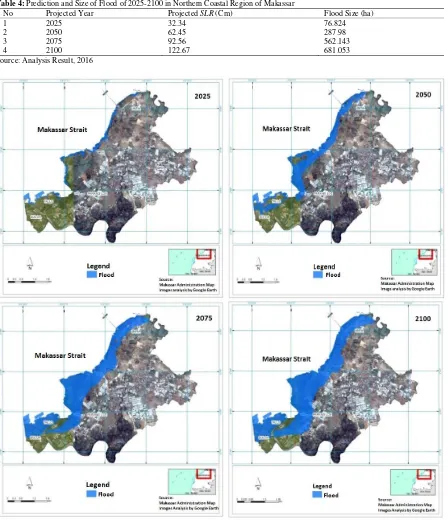
Table 4: Prediction and Size of Flood of 2025-2100 in Northern Coastal Region of Makassar
No Projected Year Projected SLR (Cm) Flood Size (ha)
1 2025 32.34 76.824
2 2050 62.45 287.98
3 2075 92.56 562.143
4 2100 122.67 681.053
Source: Analysis Result, 2016
Fig. 5: Flood Regional Map Sea Level Rise Scenario in 2025, 2050, 2075 and 2100
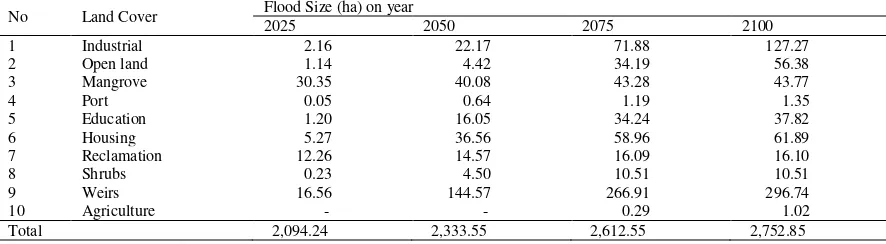
The results of inundation model analysis will provide information on function of land affected by flood in-undation. The overlaying analysis was conducted land function in 2015 which is considered to represent current conditions. The results of the overlay are exhibited in Table 5.
Table 5: Area of Land Function Potential Experiencing Flood based on Sea Level Rise Model Scenario 2025, 2050, 2075 and 2100
No Land Cover Flood Size (ha) on year
2025 2050 2075 2100
1 Industrial 2.16 22.17 71.88 127.27
2 Open land 1.14 4.42 34.19 56.38
3 Mangrove 30.35 40.08 43.28 43.77
4 Port 0.05 0.64 1.19 1.35
5 Education 1.20 16.05 34.24 37.82
6 Housing 5.27 36.56 58.96 61.89
7 Reclamation 12.26 14.57 16.09 16.10
8 Shrubs 0.23 4.50 10.51 10.51
9 Weirs 16.56 144.57 266.91 296.74
10 Agriculture - - 0.29 1.02
Total 2,094.24 2,333.55 2,612.55 2,752.85
Source: Analysis result, 2016
Conclusions:
Rising sea levels are caused by flood inundation in coastal areas north of Makassar. It will potentially occur in the future, although there would be no cause for alarm for current condition. Based on the scenarios of sea level rise, it exhibits that in 2025 the total flooded area is 76.82 hectares and in 2100 increased to 681.05 hec-tares. The land potentially experiencing flood inundation in 2025 and 2050 are industrial area, open land, man-grove forests, port, and education region. Settlements, shrubs and fishpond are located in the reclamation area. In 2075 and 2100, the flood would spread inland towards agriculture region.
REFERENCES
Arifin, Julius and Ismail, 2012. Kondisi arus pasang surut di perairan pesisir kota Makassar, Sulawesi Se-latan. Depik Journal, 1(3): 183-188.
Ewing, L., 2010. Sea Level Rise: major implications to coastal engineering and coastal management.In: Hand book of Coastal Engineering. World Scientific Publishing Co. Pte. Ltd., USA.
Hidayat, 2012. Analisis pengembangan kawasan pesisir berbasis mitigasi Sea Level Rise (kenaikan muka air laut) studi kasus kawasan Kota Lama. Master Thesis. Department of Urban and Regional Planning, Islamic State University of Makassar, Makassar.
Latief, H.H. and O. Dominic, 2010. Synthesis report risk and adaptation assessment to climate change in Lombok Island, West Nusa Tenggara Province. Ministry of Environment, Indonesia.
Lillesand, T.M., and Kiefer, F.W., 1993. Penginderaan jauh dan interpretasi citra. Dubahri, R. (transl.). Gadjah Mada University Press, Yogyakarta.
Makassar Government, 2014. Plan of Zoning on Coastal and Small Island in Makassar. City Government of Makassar.