AMZATUL AKMAM MOKHTAR
PROFESOR MADYA DR. MD. RADZAI SAID
Paper Presented at the Prosiding Seminar Pencapaian Penyelidikan KUTKM (REACH 2006) 18 - 20 Disember 2006, Holiday Inn Resort, Batu Feringgi, Pulau Pinang
UNIVERSITI TEKNIKAL MALAYSIA MELAKA
ABSTRACT
Axial Crushing of Fiber Filled Thin Tubes
Amzatul Alanam Bin Mokhtar
Assoc. Prof. Dr. Md. Radzai Bin Said
Faculty of Mechanical Engineering
(KUTKM)
The energy absorption capacity of a series of axially crushed tubes filled with oil palm fiber is compared with
empty tube. This is to determine the viability of considering the use of such composites or bimaterials in
transportation system especially in automotive application. The cross-sectional of tubes are square and
rectangular in shape. The tubes are filled with Empty Fruit Bunch (EFB) fibers and with Oil Palm Frond (OPF)
fibers; and some of them were added with water or urea formaldehyde. The fibers densities are ranging from 150
kgm·3 to 300 kgm·3. It was also found that the rectangular mild steel tubes filled with 300 kgm·3 Oil Palm Frond
fiber was good in absorbing energy compared with others densities.
KEYWORDS
Energy absorption, transportation, quasi-static, fiber
1. INTRODUCTION
The study of energy absorption is important to the design of safe, crashworthy vehicles [1-4). When a vehicle is
involved in a crash, the kinetic energy of a vehicle must be controlled in such a manner as to prevent injurious
loading to the occupants. The energy can be controlled by using either an active or a passive ener¥y management
system. An example of an active system for aircraft is the ballistic parachute in which a parachute is fired out of
the fuselage and slows the aircraft. Crushable floors and nose cones are also used in aircraft; these devices are
considered passive energy absorbers. In the automotive industry, airbags are the most common form of active
energy management systems used.
One of the current design theories for passenger vehicles is to have a progressively compliant front end and a
rigid passenger compartment. A progressively compliant front end consists of a series of 'crumple zones' each
resisting deflection until a certain load level is reached, and then deforming at that constant load level until the
next zone is reached. The first zone deforms at a very low load level to protect pedestrian and cyclists. The series
of zones that follow are designed for increasing level of load; the final zone is rigid passenger compartment
Which should resist all deflection.
©
Universiti Teknikal Malaysia Melaka
When studying energy absorption there are many important variables. These include materials; manufacturing
methods, microstructure, geometry of specimen, including any crush initiator used; and rate of crush.
An
important parameter when studying energy absorption, and one often used in the automotive industry, is the
energy absorbed per unit mass of crushed material. This is often called the specific energy absorption (SEA). The
SEA provides a measure of energy absorption efficiency of structural component but, of course, says nothing
about the efficiency of the structure in regards to other areas, such as resisting buckling, damping vibrations, or
its ease of manufacture. It is one of several parameters that must be considered in automotive design.
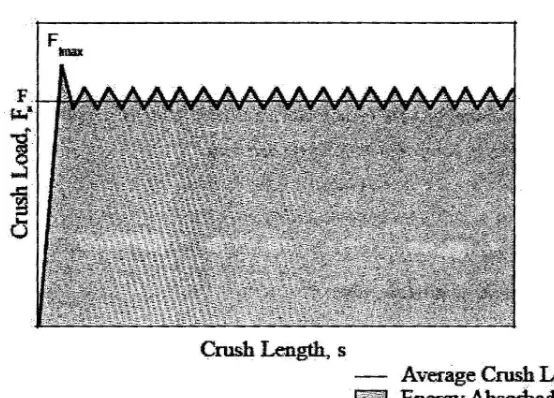
Another important factor in the study of energy absorption for energy management capabilities is the shape of
the crush load vs. crush length trace. Figure 1 shows an ideal crush load vs. crush length trace. As the crushing
begins, the load quickly rises to a peak value, then drops off slightly and stays relatively constant. In this way the
energy absorption is maximized for the length of crushed material. One does not want the initial peak load (Fimax)
to be much greater than the average crush load (F.),
F
nu
Crush Length,
sAverage Crush Load
[image:3.621.202.479.319.518.2]ャセゥ セ@
EnergyAbsoibed
Figure 1: Ideal crush load vs. crush length
because large loads would be needed to initiate crushing, and the goal in energy management is to absorb all the
energy without imparting large forces to the people involved. One measure that is used to characterize the shape
of the trace is called the load ratio. The load ratio, which is defined as
load ratio= Fimax/Fa
is one metric that may be used as another important parameter for measuring crushing efficiency. Karbhari, et al.
cites other sources that suggest that the load ratio should less that 1.25 [7]. The load ratio clearly cannot be the
only measure used to determine that crush efficiency. A member could have an attractive load ratio but also have
very low energy absorption . Catastrophic failures are clearly not acceptable for energy management.
Axial Crushing of Fiber Filled Thin Tubes
2.
BACKGROUND
The usage of fiber materials are often used to reduce the weight of structures [5]. In the automotive industry
weight reduction is important because fuel consumption is directly related to vehicular weight. Federal
regulations requiring increased fuel efficiency are forcing the industry to examine new light weight materials for
major structural components. In addition, there is an increased concern for occupant safety during roadway
accidents. Though active devices such as front, side, and knee airbags, and pop-out devices may be one solution,
using the passive capacity of the structure is also attractive. Metals are currently used in car frames and
integrated frame-body structures, and these and other metallic components are designed to passively
absorb energy during accidents
[6,8].
However, automotive manufacturers are moving towardnontraditional materials, and any new structural materials under consideration should be capable of
participating in the energy absorption process associated with accidents. Recent work has shown that it
is possible to use composite materials as both structural and energy absorbing members.
3.
EXPERIMENTAL DEVELOPMENT
3.1 Specimens
Three parameters are considered in the experiment; geometry, fiber and densities. The fibers used were Empty
Fruit Bunch (EFB) and Oil Palm Frond (OPF). In order to select the best form of fiber that would be put into the
tubes, three type of fiber were tested; dry, added with water and added with urea formaldehyde. Figure 2 shows
the typical Oil Palm Frond (OPF) fiber. Water was added to see if it can help the process of putting the fiber into
the tubes so that the fiber will spread in the tube constantly. The two types of specimens then heated in the oven
[image:4.597.164.384.514.664.2]at about 12 hours.
Figure 2: The typical Oil Palm Frond (OPF) fiber
All specimens subjected to initial experimental works were into the length of 133 mm. Initial experimental works
were done to select the best geometry and forms of fiber that will be put into the tubes. After selecting the proper
combination between those two parameters, the real experimental work would be done. The length of the tube
then changed to 250 mm and the forms of the fiber were decided to be dry at its own. The length was changed
because it is more clearer and easier to observe the. mode of collapse of the tube, and the fiber forms was decided
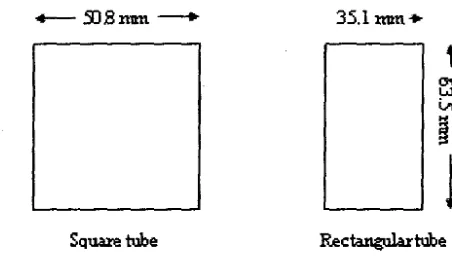
like that because based on the highest SEA of the tubes filled with dry EFB fiber. Figure 4 shows the cross
section geometries of square and rectangular tubes. The fillet radius was 2.5 mm.
-SJ.8mm-+ 35.1 :mm+
Figure 3: Cross section geometry of the tubes
In order to make sure that the comparison was reliable and acceptable the total circumferential length of the two
cross section must be the same.
The initial densities of the fiber were chosen to be 150 kgm·3, 200 kgm-3, 250 kgm-3 and 300 kgm-3. But for
initial experimental works the initial densities were random ranging from 150 kgm·3 to 345 kgm-3•
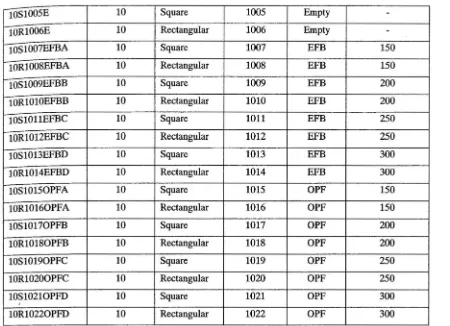
3.2 Cutting/labeling scheme
The tube name is a code that gives the cross-head speed, tube geometry, number of specimen and fiber type that
filled into the tubes. The first character tells the loading rate of the cross-head speed: "5" for 5 mm/minute, "10"
for 10 mm/minute and "20" for 20 mm/minute. Then, the second character tells the tube geometry: "S" for
square cross-section, and "R" for rectangular cross-section. Next, the number, starting from "1001" and ended
with "1018" indicates the number of the specimen. Type of fiber is indicated by its own initial. "EFB" is for
Empty Fruit Bunch, "OPF' is for Oil Palm Frond and "E" is for empty. Lastly, the initial density of fiber that is
put into the tubes is shown by "A", for 150kgm·3, "B", for 200kgm·3, "C" for
RUPォセュM
S@ and "D" for 300kgm·3. Aclear description of the specimen is shown in Table 1 below.
Code of specimen Cross head Tube Number of Type of Density of fiber
speed geometry specimen fiber (kgm-3)
(mm/min)
5S1001E 5 Square 1001 Empty Specimen were
5R1002E 5 Rectangular 1002 Empty used to see if
20Sl003E 20 Square 1003 Empty there is any
20Rl004E 20 Rectangular 1004 Empty significant effect
[image:5.612.201.427.162.290.2]· I crushing of Fiber Filled Thin Tubes
A.rlll
10Sl005E 10
10Rl006E 10
10S1007EFBA 10
10Rl008EFBA 10
10Sl009EFBB 10
lORlOlOEFBB 10
10Sl011EFBC 10
10Rl012EFBC 10
10Sl013EFBD 10
10Rl014EFBD 10
10Sl0150PFA 10
10Rl0160PFA 10
10S10170PFB 10
10R10180PFB 10
10Sl0190PFC 10
10Rl0200PFC 10
10S10210PFD 10
'
10R10220PFD 10
Table 1: Codes details of specimens
3.3 Quasi-static testing
Square Rectangular Square Rectangular Square Rectangular Square Rectangular Square Rectangular Square Rectangular Square Rectangular Square Rectangular Square Rectangular
1005 Empty
-1006 Empty
-1007 EFB 150
1008 EFB 150
1009 EFB 200
1010 EFB 200
1011 EFB 250
1012 EFB 250
1013 EFB 300
1014 EFB 300
1015 OPF 150
1016 OPF 150
1017 OPF 200
1018 OPF 200
1019 OPF 250
1020 OPF 250
1021 OPF 300
1022 OPF 300
The quasi-static testing was performed at Structure and Material Lab II of Kolej Universiti Teknikal Kebangsaan
Malaysia. The quasi-static test setup is shown by Figure 5. These tests were done on an Instron model 8858
displacement-control machine with a 300 kN load cell. The cross-head speed was set at 10 mm/minute. The
specimen was placed on the stationary lower platen and it must be centered so that the load was effectively
crushing the tube. The cross-head was then lowered until the upper platen was just touching the specimen. Using
the software provided, then, balance load step was done to make sure that when the cross-head starting to crush
the tube it is started from approximately 0 N. The head was then set into motion and the load and
[image:6.597.29.479.74.400.2]cross-head displacement were recorded for each test. Some of the tests were recorded with a video camera.
Figure 4: Schematic and picture of the quasi-static test setup
[image:6.597.131.354.636.744.2]3.4 Specimen material analysis
Several measures were taken to determine the quality and consistency of the specimen. Inner and outer diameter
(inner and outer square side lengths were measured for the tubes), length, and mass were measured for each
specimen. Wall thickness measurements were also made for each SQeCimen. The inner and outer side lengths
were measured at two three locations on each of the tubes. Length was measured in three places for each tube
and mass was measured twice. The wall thickness of the specimens was measured in four places on each end.
The wall thickness was measured on each flat and each corner of each end of the specimen because the tubes
were much thinner in the corners than on the flats. The side lengths were measured using calipers. The lengths of
the tubes were measured with steel rulers. A micrometer was used to measure the wall thickness. The mass was
determined using a Mettler PE 16 electronic scale.
3.5 Reduction of data
3.5.l Calculating the Specific Energy Absorb (SEA) and Load ratio
The most important parameter that was determined from each crush test was the specific energy absorption
(SEA). Energy is the product of the force and distance moved at that force level. The crush load, F, and crush
length, s, obtained from the quasi-static tests are shown in Figure 5. The energy absorbed during crush, E, was
then calculated by integrating under the crush load vs. crush distance curve,
E
=r
1F · ds,
0 (1)
where Sp is the final crush length or locking strain point.
The average crush force was calculated continuously as the tube was crushed, as follows:
F=
afoF · ds
s
(2)
To calculate the load ratio, using Equation 2, the value of the crush load at the initial peak, Fimm was divided by
the average crush load,
load mfio
A.rial Crushing of Fiber Filled Thin Tubes
To get the SEA, the energy absorbed during crush (until it reach locking strain) was divided by the mass of the
crushed material, me. The crushed mass was found by the following:
11/c = lll1·Sf,
(4)
where m1 is the linear density or mass per unit length of the tube. The linear density was determined from the
length and mass measurements from each specimen. The force and cross-head displacement (crush distance)
were measured directly during the tests.
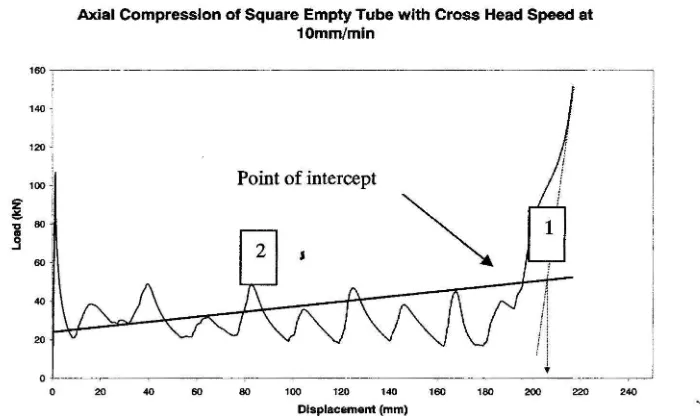
3.5.2 Calculating the energy absorbs
Before getting the SEA of the tubes, the energy absorb at locking must be calculated. Microcal Origin 5.0
software is used to get the energy absorbs. Firstly, the point of the locking strain must be identified. Refer to
graph below; at the end of crushing test, there will be slightly a straight graph or line. By choosing the most
stable and straight line, draw a straight line redundant at the straight line before. Then, using Microsoft Office
Excel gets the regression line that will intercept with the other line. Referring to the interception point, then refer
again to the displacement point at the axis below.
160 '
140
120
100
20
Axial Compression of Square Empty Tube with Cross Head Speed at 10mm/mln
Point of intercept
20 40 60 80 100 120 140 160 180 200 220 240
Displacement (mm)
Figure 5: Two lines that will used to calculate the EA of the tubes; (1) line that is parallel to straight graph and
(2) line is get from regression model of the graph
After obtaining the displacement point or known as locking strain point, refer back to the data regarding the
locking strain point and then using Microcal Origin 5.0, integrate the graph. The energy absorbs then will be
displayed by the software.
[image:8.598.81.431.379.589.2]4. RESULT AND DISCUSSION
4.1 Crushing modes
There were several different modes of crush observed during the static crush tests. Almost all the tubes were
crushed with diamond or multi-lobe mode. Some of them also buckle with mix mode. Mix mode deformation
always happened at the end part of the tube. Depend on the geometry of the end part of the tube, the deformation
can start either upper end or below end. But in some cases the deformation
can
start slightly at the centre part ofthe tube. This is either because the centre part of the tube is the weakest part or the end part was perfectly square
that the centre of the tube becomes the concentrated place of the force.
(i)
(ii)
(iii)
Figure 6: Deformation of the tube starts slightly at the centre (i), upper end part (ii) and lower end part (iii).
4.2 Quasi-static energy absorption characteristics of square tubes
Axial Compression of Square Empty Tube with Cross Head Speed at 1omm1tnln
, .. r--·- ··-- ·- - ·- - - -
--''° 1'
""
f""
]
.. ..
...
0 M ᄋ ᄋᄋ M MLMMᄋ Mセ@ - ·- ·· , - -- -,..--- - . - - . ·--.--· --- -.---- · -- --- -,·- -· ---.- -- ·- ,_... .
-"
.
.,
..
-
セ@- -
セ@ セ@ セ@ セ@Displacement (mm)
(i)
Axial Compression of Square Mild Steel Tube Filled with 150kgm.o EFB
,., r -··- --
---' 140 1 !
'"'
..
,.
0 N M M M MM Mセ@ M M セ MMM M M MMM MM セ MM M セ M M ⦅j@
20 "° • "' - m - セ@ セ@ セ@ m w
Displacement (mm)
(ii)
[image:9.615.182.444.273.396.2]Axial Crushing of Fiber Filled Thin Tubes
Axtal Compression of Square Mild Steel Tube Filled
with 150kgm-3 OPF
-QVPMBセ@ MMMMMMMセ@ 140-; ' I I o L - - - ----.,--I
0
"
60 100 120 140 160 200 220Displacement (mm)
(iii)
Axial Compression of Square Mild Steel Tube Filled
with 200kgm-3 OPF
160
1<0
120
-_
100-セ@
...
s
Axial Compression of Square Mild Steel Tube Filled with 200kgm" EFB
I
20 i
0
MMMセMMMMMMセMMMMMMMイMMMMMMMLMMMMMMMMMMMNMMMMj@
20 160 180 200 220 240
Displacement (mm)
(iv)
Axial Compression of Square Mild Steel Tube Filled
with 250kgm-3 EFB
1601 1401
I
1201
- - - QVPMMMMMMMMMMMMMMMMMセMM
z 100 j
セ@
80
L,
i
,___
____________
MMMMMMセ@20 60 80 100 120 140 160 200 220 240
Dtsplacement (mm)
(v)
Axlal Compression of Square Miid Steel Tube Filled with 250kgm4
OPF
QPPセLMMMMMMMMMMMMMMMMMMMM
20
20 40 100 120 140 160 180 200 220 240
Displacement (mm)
(vii)
Axial Compression of Square Mild Steel Tube Filled with 300kgm-3 OPF
160:---"'1
1ro1z100
i
セ@ i
... セ@
"'
iJ soi
40: '
20
0 MMMMNMMMMMセMMM MMMMMMMセMMMMMMMMMMB@
0 40 60 80 180 200 220 240
Displacement (mm)
(xi)
120
-I
11001
] 80 60
I
J
---100 120 140 160 180 200 220 240
Displacement (mm)
(vi)
Axial Compression of Square Mild Steel Tube Fiiied with 300kgm4 EFB
BGセL@ MMMMMMMセMMMMMMMMMMMセ@
140J I
z QPPセ@
<!!.
1il .. .3 ..
40 20
20 40 60 eo セ@ m - - oo 200 220 セ@
lllsplacement (mm)
(viii)
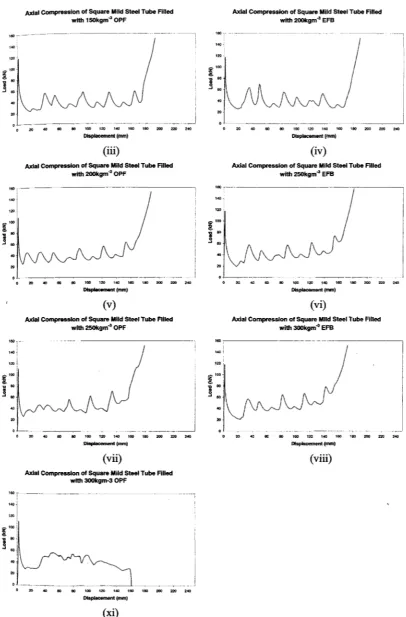
Figure 7: Load vs. displacement curve for axial compression of square tubes. (i) 10S1005E (ii) 10S1007EFBA
(iii) 10Sl009EFBB (iv) 10S1011EFBC (v) 10Sl013EFBD (vi) 10S10150PFA (vii) 10Sl0170PFB (viii)
[image:10.597.42.448.77.694.2]The crush load vs. displacement traces for the quasi-static tests of the square mild steel tubes specimens are seen
in Figure 7, All of the rectangular quasi-static specimens were crushed approximately to 150 kN load limit. It is
seen that for this square tubes, most of the crush load vs. displacement traces approximately show a clear
progressive shape of fluctuation except for. The 300 kgm·3 OPF specimen deforms in Euler buckling mode and
before that it actually show two lobes in diamond mode. All of the curves show the initial peaks above 100 kN
and slightly narrow valley-to-peak variation. Almost all of the peaks and valley of curve starting from initial to
the last show a sharp fluctuation. This phenomenon is actually expected to occur because the geometrical effect
of the tubes.
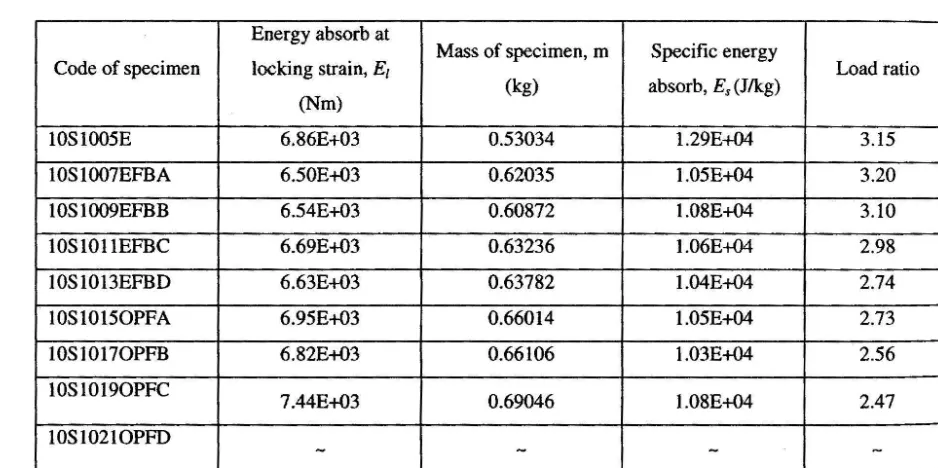
The SEA for empty square tubes shows the best when among filled tubes. When only this characteristic was
considered, the objectives seem not achieved. Load ratio for empty tubes is very high and exceeded
tremendously and also cannot be considered as a good energy absorption device. The SEA for filled tubes is
lower than the empty tubes. Load ratio for filled tubes is better that the empty tubes but cannot be considered as
acceptable because it is exceeded far from 1.25 [7]. It is shown that the best combination between SEA and load
ratio for crushed square tubes is IOSI0190PFC.
Energy absorb at
Mass of specimen, m Specific energy
Code of specimen locking strain, E1 Load ratio
(Nm) (kg) absorb, E, (J/kg)
10Sl005E 6.86E+03 0.53034 l .29E+04 3.15
IOS 1007EFBA 6.50E+03 0.62035 l.05E+04 3.20
1OS1009EFBB 6.54E+03 0.60872 l.08E+04 3.10
10S1011EFBC 6.69E+03 0.63236 l .06E+04 2.98
IOSI013EFBD 6.63E+03 0.63782 l.04E+04 2.74
IOS10150PFA 6.95E+03 0.66014 l.05E+04 2.73
10Sl0170PFB 6.82E+03 0.66106 l.03E+04 2.56
10Sl0190PFC
7.44E+03 0.69046 l.08E+04 2.47
lOS 1021 OPFD
-
-
-
-Table 2: SEA for square mild steel tubes subject to axial loading.
[image:11.613.83.552.346.580.2]Axial crushing of Fiber Filled Thin Tubes
4.3 Quasi-static energy absorption characteristics of rectangular tubes
Axial Compression of Rectangular Empty Tube with
Cross Head Speed at 10mm/min
.. LセMMMMMM ---. ---1
"'
100·
z '
..
§
80 6040 20
160
i
::j
z QPPセL@
..
§
60'
"'
1601
1.0 セ@
I
120J
i
z1001 <!.
§
80120 140 160 200
Displacement (mm)
(i)
Axial Compression of Rectangular Mild Steel Tube Filled with 150kgm .. OPF
MMセL@
I
I
_J
..
100 1<0 160 180"" ""
Displacement (mm)
(iii)
Axial Compression of Rectangular Mild Steel Tube Filled with 200kgm .. OPF
I
'"' .. 80
100 140 180 200 220 240Displacement (mm)
(v)
Axial Compression for Square Mild Steel Tube Filled with 250kgm .. OPF
160 J - - - -MMMMMMMセMᄋMMMMMMMMMMM
i
140 セ@
20 20
!
60 80 100 120 140 160 180 200
Displacement (mm)
(vii)
Axial Compressslon of Rectangular Mild Steel Tube Filled with 150kgm .. EFB
,,, r---
---140 l
---,
I
1201
I
_ 100-z
<!.
]
80 '20
MMMMMMMᄋセMMMMMMMMMMMMMMMMMMMセ@
8Q 100 120 160 180 200 220
Displacement (mm)
(ii)
Axial Compression of Rectangular Mild Steel Tube Filled with 200kgm .. EFB
1801·
1<0""
20
160--140 セ@
""l
20 60
"'
100 120 160""
200 220Displacement (mm)
(iv)
Axial Compression for Rectangular Mild steel Tube Filled with 250kgm .. EFB
""
I
セセMセM
セᄋ@ MセMj@
20 40 so eo 100 120 140 1eo 1ao 200 220 240
Displacement (mm}
(vi)
Axial Compression of Rectangular Mild Steel Tube Filled with 300kgm .. EFB
1 6 C l - ; - · · - - -
-1401
I
- - - -- - - _ _ _ _J
2(1
"
100 180 180 200""
Displacement (mm}140 120 _ 100
セ@
'g BOj
.s ..
40
Axial Compression of Rectangular Mild Steel Tube Fllled with 300kgm"' OPF
Displacement (mm)
(xi)
---,
Figure 8: Load vs. displacement curve for axial compression of rectangular tubes. (i) 10R1006E (ii)
10Rl008EFBA . (iii) lORlOlOEFBB (iv) 10Rl012EFBC (v) 10Rl014EFBD (vi) 10Rl0160PFA (vii)
10Rl0180PFB (viii) 10Rl0200PFC (xi) 10Rl0220PFD
The crush load vs. displacement traces for the quasi-static tests of the rectangular mild steel tubes specimens are
seen in Figure 8, All of the rectangular quasi-static specimens were crushed approximately to 150 kN load limit.
It is seen that for this rectangular tubes, most of the crush load vs. displacement traces approximately show a
stable and progressive shape of fluctuation. All of the curves show the initial peaks below 100 kN and large
valley-to-peak or smooth variation and that is actually a very good shape of curve for energy absorption
characteristics so that the energy can be absorb higher.
The SEA for empty rectangular tubes shows are higher than filled tubes. Load ratio for empty tubes is very high
and exceeded tremendously and also cannot be considered as a good energy absorption device. The SEA for
filled tubes is lower than the empty tubes. The load ratio for 10R1008EFBA and 10Rl0220PFD tubes are almost
the same with suggested by Karbhari, et al. and can be considered as acceptable because it is approximately not
far from 1.25 [7]. It is shown that the best combination between SEA and load ratio for crushed square tubes is
10Rl0220PFD.
Code of specimen Energy absorb at
locking strain, E1 Mass of specimen, m Specific energy
(Nm) (kg) absorb, Es {J/kg) Load ratio
10Rl006E 6.16E+03 0.55883 l.10E+04 3.17
10Rl008EFBA 5.32E+03 0.6385 8.34E+03 1.64
lORlOlOEFBB 5.02E+03 0.6384 7.87E+03 3.21
10Rl012EFBC 5.83E+03 0.66443 8.78E+03 2.84
10Rl014EFBD 6.38E+03 0.66521 9.59E+03 2.45
10Rl0160PFA 5.84E+03 0.69168 8.44E+03 2.63
10Rl0180PFB 6.53E+03 0.69139 9.44E+03 2.01
10Rl0200PFC 6.83E+03 0.71803 9.52E+03 2.25
[image:13.603.97.541.85.294.2]10R10220PFD 7.17E+03 0.71756 9.99E+03 1.89
[image:13.603.98.541.527.743.2]Axial Crushing of Fiber Filled Thin Tubes
4.4 セュ・エイケ@ effect on energy absorption characteristics of tubes
GraphS of mild steel tubes filled with 150 kgm"" EFB
...
M MMᄋ MMMMM M M MMMM セ ᄋ MM セ@ -·· - ---120
: - .
M MM ᄋMセセ
MセM M Mセ M セ
M Mj@
o 20 • IQ IQ - m - - - -
=
-Displacemenl(mm)
(i)
f G ッウ G セ@
セセ@
GraphS of mild steel tubes filled with 200 kgm"" EFB
Q ・ッ L セ MM MM
セBG@
!
IQ IQ•
20
Displacement (mm)
(iii)
Grapha of mild steel tubes filled with 250 kgm"' EFB
::1 - - -.
---···---i
..
200 M MM MNMM M Mセ M MM M MMM セ MMM
0 20 <tO 80 80 100 120 140 160 180 200 220 240
セHュュI@
(v)
Graphs of mild steel tubes filled with 300 kgm -a EFB
160 ; -- - - · - - --- - - · · M MM M M MMMMMM M セ M セ@
"'
セGB@
!
IQ"
,.
0 ---..--·--- ---r----.-- ---· ---.·-ᄋ Mᄋ NNMMMセ@
o 20 '° ao ao - m - - • - m
-Dlsplec;emonl (mm}
(vii)
Graphs of mild steel tubes filled with 150 kgm"' OPF
o • • IQ • - m • • • ""'
=
-- ( m m )
(ii)
Grapha of mild steel tubes filled with 200 kgm-3 OPF
-,--- ---1
セ ェ@
-J I
z-:
,.
.!!. '
セ@
:
' • • IQ IQ - m • • -
-Dilplac:emenc (mm}
(iv)
i
I
Graphs of mild steel lubes filled with 250 kgm-3 OPF
110 T
1.o j
120 1 I セQPP Q@ セ@ IQ..
20セM MMᄋM M MMM MM ᄋ@
--·--- -
J
120 1
; ( ioo j
!
IQ0 . . . .
Dloplocement (nwn)
(vi)
Graphs of mild steel tubes filled with 300 kgm"' OPF
0 - - - . - - - -·- · - - -..---- - ·-- - -______j
""'
(viii)
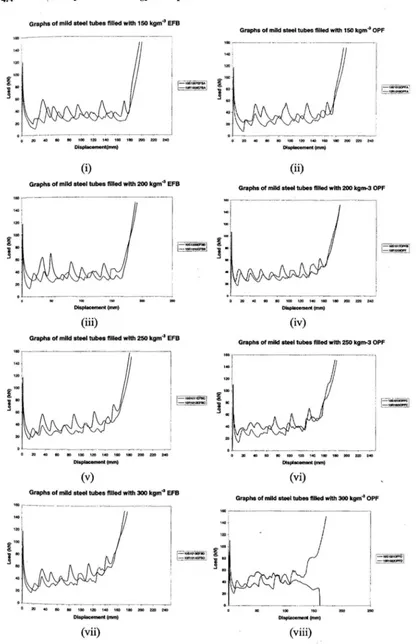
Figure 9: Combination of load-displacement curve between square and rectangular mild steel tubes filled with
EFB and OPF. (i) Combination of 10S1007EFBA and 10R1008EFBA (ii) Combination of 10S1009EFBB and
[image:14.600.51.467.102.746.2]10Rl010EFBB (iii) Combination of 10Sl011EFBC and 10Rl012EFBC (iv) C?mbination of 10S1013EFBD and
10R1014EFBD (v) Combination of 10Sl0150PFA and 10Rl0160PFA (vi) Combination of 10S10170PFB and
10R10180PFB (vii) Combination of 10S10190PFC and 10R10200PFC (viii) Combination of 10Sl0210PFD
and 10Rl0200PFD.
The combination of load-displacement curve between square and rectangular mild steel tubes filled with EFB
and OPF are shown in Figure 9. All of the specimens were crushed approximately up to 150 kN load limit except
for 10Sl0210PFD because it deform in Euler buckling mode and jump out of the load frame before reaching the
load limit. It seems that crush load vs. displacement traces for square tubes show a sharp and stable shape of
fluctuation than rectangular tubes. Initials peaks for the square tubes curves always exceeded 100 kN and
rectangular tubes are below 100 kN. Other than that, almost all the peaks and valleys of square tubes are higher
than rectangular tubes. Rectangular tubes peaks and valleys are smoother than those of square tubes and this is a
good characteristic for energy absorption device. Sharp peaks means there is a sudden change in load that will
create inertia effect and it will also influence the passenger to jump out of the compartment.
The SEA for square tubes is better that rectangular tube. But load ratio for rectangular tubes is lower that those of
square tubes. As a result, rectangular tubes show a better combination between SEA and load ratio to be
considered as a good energy absorption device.
4.5 Type of fiber effect on energy absorption characteristics of tubes
""
- 100 !
セ@
...
.§ ..
•
Graphs of mlld steel tube filled with 150 kgm .. EFB and
OPF
Displacement (mm)
(i)
Graphs of mlld steel tubes filled with 250 kgm4 EFB and
OPF
i
: イ]]Qqaセ@Q ⦅[セQQQQIHIヲ^ヲGc i@ IQ$10119'9C IセセAGᆪNNN@
Dlsplacemont (mm)
Graphs of mild steel tubes filled with 200 kgm .. EFB and
OPF
lllsplocomont (mm)
(ii)
Graphs of mlld steel tubes filled with 300 kgm 4 EFB
and
OPF GBG M MMMMMM MMMセ ᄋ@
•
0 Mᄋ セ M M M MセM M MM M セゥ MM セ M N@
____ J
0 • • • • セ@ - - -
-セHュュI@
(iii) (iv)
Figure 10: Combination of load-displacement curve between types of fibers filled in the tubes. (i) Combination
of 150kgm-3 density fiber filled in the tubes. (ii) Combination of 200kgm·3 density fiber filled in the tubes. (iii)
A,.xial crushing of Fiber Filled Thin Tubes
Combination of 250kgm-3 density fiber filled in the tubes. (iv) Combination of 300kgm-3 density fiber filled in
the tubes.
The crush loads vs. displacement traces between types of fibers filled in the tubes are shown in Figure 10. The
effect of fiber that filled in the tubes is actually having close relation with the density of it. When the density of
the fiber that crushed in the tubes comes into some level, and have a close contact between them and the tubes
then the effect of it will occur. The microstructure of the fiber is the main factors that will effect the energy
absorb by the tubes. Referring to the load-displacement curve above, the effect of fiber start at almost half of the
crush length of the tubes. One of the most significant effect is that the peaks and valleys become smaller and
smoother.
Actually the effect of fibers to the energy absorb, in particular, is really difficult to see unless it involved large
scale of specimen. The effect of fiber is difficult to see because the effect of tube geometry has made it
disappear. Almost all of SEA of OPF is higher from EFB.
4.6 Initial density effect on energy absorption characteristics of tubes
Graphs of equare mild steel tubes filled with EFB
11:=!§§!
KMMM セセセセセセセセセセセセ LMMM\@
0 . . • . . . . セ@ - - - セ@
セHョカョI@
(i)
Graphs of rectangular mild steel tubes filled with EFB
1110 l
140 セ@
i '"' j
I
z,oo l
;
..
セ@
セ@
:r\
iイ セ@
20 j
ᄋ セ セ セセセセセセセセセセ MMNNMMG@
o " • ., "' セ@
= - - •
m=
セ@:- 10Fn001EFBAI
;- 1mitio1DIEl98 1 [⦅ セᄋ Z Z ZZ ZZ Q@
Graphs of mild - I tubes filled with OPF
セBB@
l .. '
...
"
o m • w m too Qセ@
Dlspl-... ( - )
(ii)
190 200 220 240
Graphs ol rectangular mild steel tubes fllled with OPF
.
..
.
..
..
---
-
-
セ@-
セ@(iii) (iv)
Figurell: Combination of load-displacement curve between initial densities of fiber filled in the tubes. (i)
Combination of square tubes filled with EFB. (ii) Combination of square tubes filled with OPF (iii) Combination
of rectangular tubes filled with EFB (iv) Combination of rectangular tubes filled with OPF.
The combination of load-displacement curve between initial densities of fiber filled in the tubes is shown in
Figure [11 ], All of the specimens were crushed approximately to 150 kN load limit but the crush length is
different depend on the densities of the fiber filled in the tube. When the initial densities become higher, the
[image:16.600.40.464.343.674.2]crush length will become shorter. It is mean that the densification effect had occurred through the compression of
. the tubes. Peaks and valleys will become higher and different from the beginning till the end of compression.
Effect of densification has made square tube filled with 300 kgm·3 OPF deform in Euler buckling mode. It jumps
out of the load frame.
Almost all SEA value of the specimens directly proportional to the initial density of fiber filled in the tubes
except to EFB filled in the square tubes. Load ratio seems to be unstable and difficult to be predicted. The best
load ratio is 1.64, and it is rectangular tubes filled with 150 kgm·3 EFB.
5. CONCLUSION
There are three parameters; geometry, type of fiber and initial density of fiber filled, that were used in the
experimental works. The main objectives were to compare how the energy absorption characteristics were
changed by varying these several parameters:
The specimens with square tubes show a stable and progressive fluctuation of load-displacement curve
while rectangular tubes show a smooth and slightly unstable curve. Considering only by geometry effect, SEA
for square tubes is higher at almost all specimens comparing to rectangular tubes. But, load ratio for rectangular
tubes is likely to be very appropriate to act as a good energy absorption device. The highest SEA of all tubes is
square empty tube with l .29E+04 J.
Type of fiber does not show any significant effect to the SEA. But in almost all condition, OPF show a
better value between them except for OPF with 200 kgm·3 filled in square tube. Microstructure seems not really
effect the SEA for both type of tubes.
Densities of fiber show a great effect to EA but not SEA of all tubes. The effects always occur at the
half crush length. It helps to increase the energy absorb by co-operate with the tube itself to act as energy
absorption part especially when the densification effect become higher. When the initial densities are higher then
the crush length will become shorter. In this experiment, square tube filled with 200 kgm·3 EFB and 250 kgm·3
OPF show great value of SAE.
By considering all factors, rectangular tube filled with OPF with 300 kgm·3 density is the best of all
specimens' tests. It absorbs 9.99E+03 J/kg and has a good load ratio of 1.89.
REFERENCES
[l] Johnson W, Ried SR. Metallic energy dissipating systems. Appl Mech Rev 1978;31:277.
[2] Jones N, Wierzbicki T. Structural crashworthiness. London: Butterworths, 1983
[3] Jones N, Wierzbicki T. Structural crashworthiness and failure. London: Elsevier Applied Science, 1993
,4xia1 Crushing of Fiber Filkd Thin Tubes
[4] Morton J. Structural impact and crashworthiness. London: Elsevier Applied Science, 1984.
[5] Farley GL, Jones RM. Crushing characteristics of continuous fiber-reinforced composite tubes. J
Compos Mater 1992;26:37.
[6) Thornton P. Energy absorption by foam filled structures. SAE paper 800081, 1980.
[7] Karbhari, Vistap M., Falzon, Paul J., and Herzberg, "Energy absorption characteristics of hybrid braided
composite tubes," Journal of Composite Material, Vol. 31, No 12.1997, pp. 1165-1186.
[8) Lampinen BE, Jeryan RA. Effectiveness of polyurethane foam in energy absorption structures. SAE
paper820494, 1982.
[9] Reid SR, Reddy TY, Gray MD. Static and dynamic axial crushing of foam-filled sheet metal tubes. Int.
J Mech Sci 1986;28(5)
[10] Abromowicz W, Wierzbicki T. Axial crushing of foam-filled columns. Int. J Mech Sci
1988;30(3/4 ):263
[11) Ashby MF. The mechanical properties of cellular solids. Met Trans 1983;14A: 1755-69.
[12] Gibson U, Ashby MF. Cellular solids: structure and properties. Oxford: Pergamon Press, 1988.
[13] Hanssen AG, Langesh M, Hopperstad OS. Static crushing of square aluminium extrusions with
aluminium foam filler. Int. J Mech Sci 1999;41;967-93.
(14) Reddy TY, Al-Bassani STS. Axial crushing of wood-filled square metal tubes. Int. J Mech Sci
1993;35(3/4 ):231-46.
[15] Singace AA. Analysis of axially crushed tubes deforming in multi-lobe mode. Int. J Mech Sci
1999;41(7):865-90.
[16] Johnson W, Soden PD, Al-Bassani STS. Inextensional collapse of thin-walled tubes under axial
compression. J Strain Anal 1977;12(4):317.
[17] Singace AA, El-Sobky H, Reddy TY. On the eccentricity factor in the progressive crushing of tubes. Int
J Solids Struct 1995;32;3589-602.