ISSN: 2180 – 1053 Vol. 1 No. 1 July – December 2009 53
HYBRID PALM OIL MILLS
MAINTENANCE SYSTEM
Abd. Samad Hasan Basari1, Nanna Suryana Herman2, Mohammad Ishak Desa3
1,2
Faculty of Information and Communication Technology, Universiti Teknikal Malaysia Melaka, Locked Bag 1752, Pejabat Pos Durian Tunggal, 76109 Durian Tunggal, Melaka
{abdsamad1, nsuryana2}@utem.edu.my
3
Faculty of Computer Science and Information System, Universiti Teknologi Malaysia, 83100 Skudai, Johor
ABSTRACT
This paper proposes a technique that enhances snapshot model for cause of
failure and decision analysis in order to easily assist maintenance engineers
during identification and definition of the actual maintenance problem. The
technique is a hybrid of failure mode, effect and criticality analysis,
information technology and decision analysis into the snapshot model. A
tool that automates the hybrid of snapshot modelling for cause of failure
and decision analysis is also developed. This tool aims to ensure
maintenance engineers can conduct snapshot modelling with little or
without the help of operation research experts to facilitate in the cause of
ISSN: 2180 – 1053 Vol. 1 No. 1 July – December 2009 54
KEYWORDS
Hybrid system, maintenance, snapshot modelling
1.0 INTRODUCTION
The cause of failure analysis is the process of identifying, defining, and
diagnosing the maintenance problem. The main purpose of cause of failure
analysis is to avoid tackling the wrong problem. Generally this analysis
involves[1]:
a) Identifying the existence and location of the problem: Which are
recognising the symptoms, seriousness of the problem from the aspect of
cost, downtime as well as the size, and the areas of the fault in the
plant’s machines where the problems are most developed.
b) Determining the problem’s causes: The analysis of the problem’s causes
can be at structural or functional level. Consequently depending on the
level of causal analysis, different solution strategies may be generated.
c) Generating and determining possible solution strategies. Having
identified problem and its nature, location, causes and consequences,
then possible solution strategies could be developed or generated.
However, the data specified above are difficult to be found in any
organisation and also very tedious to be collected on a dynamic basis if
ISSN: 2180 – 1053 Vol. 1 No. 1 July – December 2009 55 this reason the usages of a survey form for collecting such type of data on
periodic basis is suggested. At each failure or maintenance intervention, the
engineer registers the data related to the snapshot model in survey form.
Once finished, OR analyst collects back the survey form and starts the
analysis process. The results of the analysis, will be reported back to the
maintenance engineers which reveal the true status of the plant under the
study.
Despite the usefulness of the snapshot model as one of the important
tools for cause of failure and decision analysis, the implementation of the
model in large scale is doubtful. This is mostly due to, the scarcity and the
reliability of the data related to snapshot model, the problem of analysing
the data, and the problem of interpreting the results of the analysis to the
users (maintenance engineers).
2.0 THE PROPOSED HYBRID SYSTEM
The proposed approach of automating and augmenting snapshot model
aimed to complement such type of modelling. Enriched the various
techniques that have proven appropriate and possible in combining with
snapshot model could give a more effective, ease of use and practically
ISSN: 2180 – 1053 Vol. 1 No. 1 July – December 2009 56
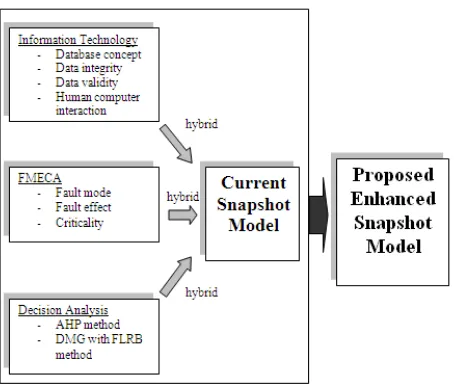
2.1 Elements of Enhancement
The enhancement require the utilisation of the emerging information
technology (IT) and failure mode, effect and criticality analysis (FMECA).
In theory, IT and FMECA can be utilised to produce an enhanced snapshot
model. Once the data collection done, the analysis process needs further
techniques to be enriched. The technique called decision analysis is
introduced. The decision analysis will use analytic hierarchy process (AHP)
method and decision making grid (DMG) by utilising fuzzy logic rule base
(FLRB) method. Figure 1 shows the conceptual merger of above mentioned
techniques into the current snapshot model.
ISSN: 2180 – 1053 Vol. 1 No. 1 July – December 2009 57
2.2 Information Technology
The computer technology can increase the involvement of maintenance
engineers in the development of the snapshot model by allowing the
replacement of the survey form with a more general computer form that
contains feature of checking the validity and consistency of the data and can
be applied for different machines. It can also permit maintenance engineers
to carry out the snapshot analysis with little assistance of or without OR
analysts.
2.3 Failure Mode, Effect and Criticality Analysis
The failure mode and effect analysis that could combined with the snapshot
analysis include:
Major fault areas and their modes. This analysis will analyse all number
of failures for each component according to their mode.
Failure mode and their cause analysis. This analysis provides guidelines
and directions to which is need to be done for specific failure mode.
Failure modes and their cost analysis. This analysis identifies the
consequences of each failure mode in term of the cost.
Failure modes and their downtime. This analysis will lead to identify the
ISSN: 2180 – 1053 Vol. 1 No. 1 July – December 2009 58
Failure modes and means of prevention analysis. This analysis identifies
the viable means of preventing each type of failure mode.
Criticality analysis (CA) is a procedure by which each potential failure
mode is ranked according to the combined influence of severity and
probability of occurrence. The procedure for obtaining the criticality
analysis is as follows [2]:
The number of failure for each mode will be calculated from the
collected data.
The total number for all the failure of the machine will be calculated.
The failure mode frequency ratio (FMFR) will be calculated by dividing
the number of failure for each mode by the total number of failure for
the machines.
Obtain the estimated probability of stopping, Ps, of the machine if the
failure in a given mode should occur.
Obtain the component unreliability Q by subtracting the component’s
predicted reliability from 1 or 100 (if calculated in %).
Calculated the Criticality CR = (FMFR) x (Ps) x (Q).
By using the above steps, criticality ranking will be conducted for the
ISSN: 2180 – 1053 Vol. 1 No. 1 July – December 2009 59
2.4 Decision Analysis
Decision analysis is particularly a techniques which is part of the framework
to achieve world class maintenance [3]. Among the established method to
implement decision analysis are AHP and DMG based on FLRB method.
The AHP is a decision support tool, which can lead the decision makers to
model a complex problem in a hierarchical structure showing the
relationship of the goal, objective (criteria), sub-objectives and alternatives
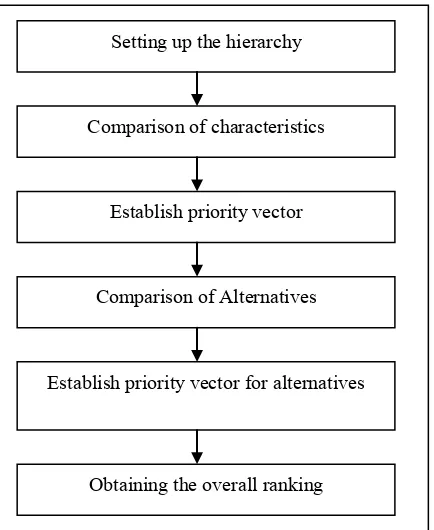
[4]. Figure 2 show the workflow of AHP process.
Figure 2 Analytic Hierarchy Process (AHP) Workflow
Setting up the hierarchy
Comparison of characteristics
Establish priority vector
Comparison of Alternatives
Establish priority vector for alternatives
ISSN: 2180 – 1053 Vol. 1 No. 1 July – December 2009 60 There are four major steps to calculate AHP which are:
1) Setting up the hierarchy: The first step in AHP is to develop hierarchy by
breaking the problem down into components. This level is also known as
design phase. The three major level of hierarchy are the goal, objectives and
alternatives.
2) Comparison of characteristics and establish priority vector:
Characteristics refer to the objectives or criteria that located in the second
level of the hierarchy. In this phase, it is known as evaluation phase.
Decision maker needs to perform comparison between each objective in a
one-to-one (N x N) matrix form. Pair wise comparison is used to determine
the relative importance of each alternative in term of each criterion. The pair
wise comparison expresses the qualitative answer of a decision maker into
some numbers, which is easy to manipulate in the calculation and solve the
problem of inconsistency unit of measurement for each criterion. Table 1
showed the proposed scale where the scale member set is {9, 8, 7, 6, 5, 4, 3,
2, 1, 1/2, 1/3, 1/4, 1/5, 1/6, 1/7, 1/8, 1/9}.
By referring to the above standard scale, a matrix of characteristic
(objectives) can be constructed. For consistency, it is necessary to set aji
=1/aij (this state the obvious fact that if objective 1 is slightly more
important than objective 3, than the objective 3 is slightly less important
ISSN: 2180 – 1053 Vol. 1 No. 1 July – December 2009 61
Table 1 Scale of Relative Importance
Intensity of Importance
Definition Explanation
1 Equal importance Two activities contribute
equally to the objective
3 Weak importance of
one over another
Experience and judgement slightly favour one activity over another
5 Essential or strong
importance
Experience and judgement strongly favour one activity over another
Hence the concept of putting values in a matrix conform the following rules:
a) The equal attribute in the matrix is put as 1 (diagonal).
b) The decision maker only needs to fill the upper right triangle of the
ISSN: 2180 – 1053 Vol. 1 No. 1 July – December 2009 62 c) For the lower left triangle of the matrix, the value should be the
inverse of the corresponding cell in upper right.
3) Comparison of alternatives and establish priority vector for alternatives:
The previous steps are determined the weight of each objectives, so the next
step is to determine how well each alternative score on each objective. The
process of calculation is almost similar with the previous step where a pair
wise comparison matrix for each objective is constructed by referring to the
scale.
4) Obtaining the overall ranking: The final step is to obtain a vector of
overall scores for each alternative, which can accomplish by multiplying the
weight calculated by each alternative associated to each of the criteria. The
first ranked alternative will have the highest weight (highest priority).
One foundation of the AHP is the observation that the human
decision-making is not always consistent. Consistency suffers when the criteria being
compared are subjectively in nature. The AHP provides a standard by which
the degree of consistency can be measured. If inconsistency exceeds an
established threshold, then participants can re-examine their judgements. In
the AHP, the pair wise comparisons in a judgement matrix are considered to
be adequately consistent if the corresponding consistency ratio (CR) is less
than 10%. First, the columns in the judgement matrix A, multiply with the
ISSN: 2180 – 1053 Vol. 1 No. 1 July – December 2009 63 yield an approximation of the maximum eigenvalue, denoted by max (an
eigenvalue of a square matrix A is a scalar c such that Aw = cw holds for
some nonzero vector w).
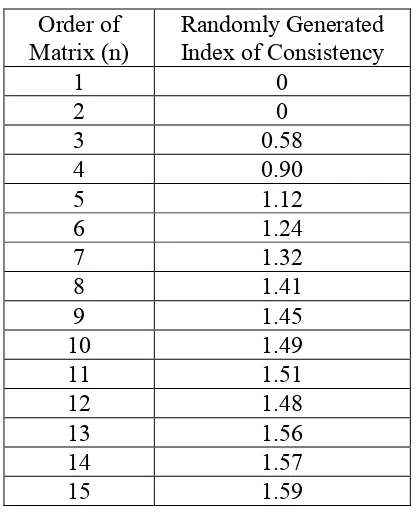
Then the consistency index (CI) value is calculated by using formula
CI = (max – n)/(n-1). Next, the consistency ratio (CR) is computed by
dividing the CI value by the random index (RI). The CR is the average CI of
sets of judgements (from a 1 to 9 scale) for randomly generated reciprocal
matrices. The consistency index is shown in Table 2.
For a perfectly consistent decision maker, each ratio in Step 2 equal to n.
This implies that a perfectly consistent decision maker has CI = 0. The
values of RI in Table 2 give the average value of CI if the entries in, for
example A were chosen at random (subject to the constraints that aij's must
equal 1, and aij = 1/aji). If the ratio of CI to RI is sufficiently small, then the
decision maker's comparison is probably consistent enough to be useful. If
CI/RI<0.10, then the degree of consistency is satisfactory, whereas if CI/RI
> 0.10, serious inconsistencies exist and AHP may not yield any meaningful
results [5].
The features to enhance the snapshot model are:
1) First level-Criteria evaluation: This steps need the decision maker
prioritises his/her preferences on different criteria such as fault mode, effect,
ISSN: 2180 – 1053 Vol. 1 No. 1 July – December 2009 64
Table 2 Random Index/Random Consistency Index for Different Value of n
2) Second level-Sub criteria evaluation: This steps need the decision maker
prioritises his/her preferences on different sub criteria such as number of
fault, machine downtime, cost and criticality.
3) Third level-Alternatives selection: The machines are ranked according to
their weights. Weights are obtained through running an AHP algorithm in an
absolute mode and hence a consistency ratio of value zero is assured.
The above mentioned three level of AHP method is a complimentary of
three type of analysis provided by snapshot model which are major fault
ISSN: 2180 – 1053 Vol. 1 No. 1 July – December 2009 65 FMECA features called fault mode, effect and criticality analysis embedded
to snapshot model, they also will be added features to decision analysis
process.
The three steps of the fuzzy controller are Fuzzification, Rule evaluation
(Inference) and Defuzzification [6]. Each of these steps is described below:
1) First step-fuzzification: The first step in the fuzzy controller is the
fuzzification process. The membership function, universe of discourse U, is
the classifications that are considered in the problem. It is assumed that both
frequency and downtime can be classified into `High', `Medium' and `Low'.
2) Second step-rule evaluation: The rule evaluation step can also be
explained as an input-output system. In this step, inputs are expert rules, and
fuzzy inputs obtained from the first step (that is values of m), while outputs
are fuzzy values of maintenance actions to be carried out. Given two
variables of frequency and downtime with each having three subsets of Low,
Medium, and High, then one needs at least nine (3x3) rules to describe the
model (system). These rules are in the form of IF . . . THEN . . . statements.
Examples of maintenance prescriptions are as follows:
a) Operate To Failure (OTF)
b) Fixed Time Maintenance (FTM)
c) Skill Levels Upgrade (SLU)
ISSN: 2180 – 1053 Vol. 1 No. 1 July – December 2009 66 e) Design Out Maintenance (DOM)
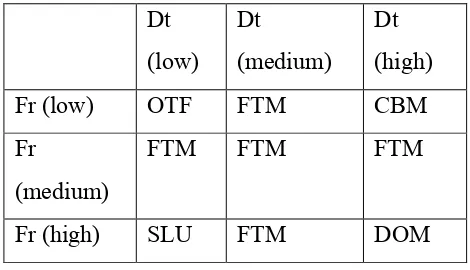
A summary of the application of each action, based on the values of
Frequency (Fr) and Downtime (Dt), is given in Table 3. An example of a
rule can be `IF downtime is low and frequency is high, THEN improve
operators skill. This rule can be written as follows:
IF frequency is HIGH and downtime is LOW THEN S. L. U (Rule 7)
Rule 7 is shown in the third row, and first column in Table 3. The summary
of rules is presented in Table 3.
Table 3 Summary of Rules for Maintenance Actions
Dt
Once rules are constructed, and given the values of the fuzzy inputs for
(mfl, mfm, mfh, mdl, mdm, mdh) one can apply the minimum and
maximum (AND & OR Zadeh) inference computations.
3) Third step-defuzzification: This is the final step in the fuzzy controller.
This process is based on the idea of deriving a crisp value from a fuzzy
ISSN: 2180 – 1053 Vol. 1 No. 1 July – December 2009 67 gravity of the area under the curve of the function. Given the cost function
of each maintenance action, one can arrange the maintenance actions, the
fuzzy output, and the cost scale function. The feedback mechanism offered
by the rules grid or DMG of fuzzy logic, as shown in Table 3, in addition to
the feedback already offered in AHP in the form of consistency ratio,
provides an effective performance.
The above-mentioned FLRB method will be used as an enhancement of
snapshot model features called prevention action analysis.
3.0 THE CASE STUDY AND RESULT
This case study demonstrates the application of the above-mentioned
techniques and its effect on maintenance performance. This company is used
as a pilot study in order to test whether the system meets the user
expectation and preference. A number of experts were interviewed and
proposed during the design and develop the targeted system.
3.1 Company Background
The company is a palm oil mills (POM), which the main job is extracting
the Fresh Fruit Bunches (FFB) to Crude Palm Oil (CPO). In this particular
company there are about 50 major machines or plants. Since the aim of this
ISSN: 2180 – 1053 Vol. 1 No. 1 July – December 2009 68 action, the case study related to an old POM, which are operated more than
ten years and use a conventional method of cause of failure and decision
analysis techniques.
3.2 The Result
Most of the maintenance information found at POM at the time of the study
commenced is originated from the unstructured daily and lubricant report.
The unstructured daily report only has the date of the report, time of the
report and the description of works. The lubricant report just gives the
machine that need a top up or change the lubricant oil, the quantity of oil
needed and a description of work or problem occurs that might cause the
need to top up or change the lubricant oil.
The snapshot model will be built based on the data collected from POM
concerning the most problematic machine namely, Screw Press. Example of
the result using the hybrid cause of failure and decision analysis techniques
ISSN: 2180 – 1053 Vol. 1 No. 1 July – December 2009 69
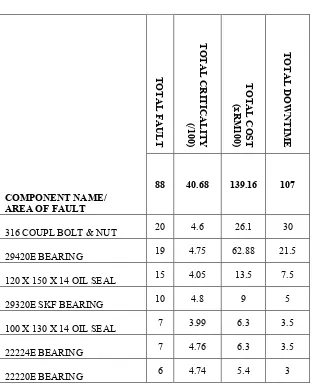
Table 4 The Combined Major Fault Area with the Number of Fault, Criticality, Cost and Downtime Analysis for the
ISSN: 2180 – 1053 Vol. 1 No. 1 July – December 2009 70
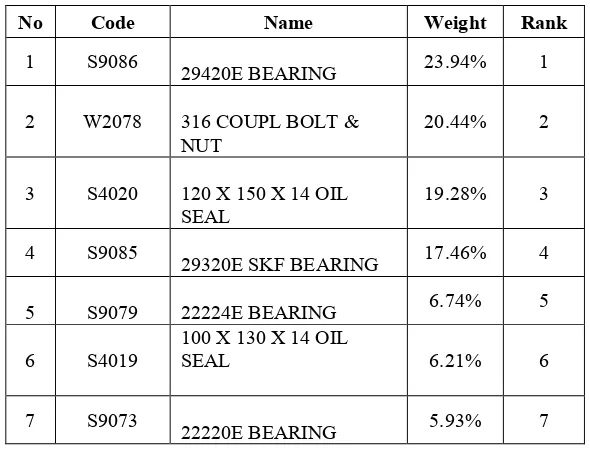
Table 5 Final Result based on the AHP Method in the Decision Analysis Technique to Select the Most Critical Components for the Period from
1.8.05 to 30.9.05
Table 6 Final Result based on the FLRB Method in the Decision Analysis Technique to Select Prevention Action for the
Period from 1.8.05 to 30.9.05
No Code Name Policy Code Description
ISSN: 2180 – 1053 Vol. 1 No. 1 July – December 2009 71
4.0 CONCLUSION
It is recognised the importance of the snapshot model as a tool for cause of
failure and decision analysis. The recent development in the computer
technology in terms of speed and capacity coupled with the successful
research in the human computer interaction play considerable role in the
development of a successful tool that capable of constructing snapshot
model. From the result, it shows that the use of hybrid maintenance cause of
failure and decision analysis could significantly improve the decision
context by adding the features of snapshot model. In term of efficiency of
decision-making process, the result shows that the reduction of time to reach
decision among the decision makers. The hybrid cause of failure and
decision analysis techniques could not deny the use of human judgments
during the survey that have been conducted. Further enhancement could be
done by embedding the techniques with the computerised maintenance
management system (CMMS). The quality of data also could be the major
issues and it could be done by using the automated data capturing
techniques such as using condition monitoring method.
5.0 ACKNOWLEDGEMENT
ISSN: 2180 – 1053 Vol. 1 No. 1 July – December 2009 72
6.0 REFERENCES
[1] L. Liu (1997), Development of an Integrated System for Machine Fault
Diagosis, PhD in Industrial Engineering, University of Houstan.
[2] D. Kececioglu (1991), Reliability engineering handbook, Englewood
Cliffs, NJ: Prentice Hall.
[3] A.W. Labib (1998), World Class Maintenance using Computerised
Maintenance Management System, Journal of Quality in Maintenance
Engineering, Vol. 4, pp. 66-75.
[4] T.L. Saaty (1977), A Scaling Method for Priorities in Hierarchical
Structures, Journal of Mathematical Psychology, Vol. 15, pp. 234-281.
[5] T.L. Saaty (1990), How to Make a Decision: The Analytic Hierarchy
Process, European Journal of Operational Research, Vol. 48, pp. 9-26.
[6] R.K. Sharma, D. Kumar and P. Kumar (2007), FM - A Pragmatic Tool
to Model, Analyse and Predict Complex Behaviour of Industrial Systems,
Engineering Computations: International Journal for Computer-Aided