DOI: 10.12928/TELKOMNIKA.v14i2A.4346 307
Heading Homing Simulation System Based on Image
Intelligent Recognition
Zhao Ke*1, Ziba Eslami2
1
Research Center of Zhenjiang Watercraft College, Zhenjiang, China
2
Lockheed Martin Space Systems Company, Paraná, Brazil *Corresponding author, e-mail: [email protected]
Abstract
Channel line recognition is one of extremely important technologies in intelligent driving field. In recent years, machine vision has been the mainstream method to solve channel line recognition problems. To overcome such deficiencies of existing channel line recognition algorithms as being complicated, slow and short of robustness, the Thesis provides a new and rapid channel line recognition algorithm which firstly obtains outline pixel of channel line through analysis on the images’ grayscale differences and then applies B-Spline curve to fit the channel line profile, thus getting the final recognition effect picture. The experiments show that excellent performances in both speed and recognition rate can result from the algorithm. Besides, in embedded platform, the speed of the algorithm in the Thesis results in 12 frames per second, which conforms to the real demands of intelligent driving.
Keywords: Machine vision; Channel line recognition; B-Spline; Curve fitting; Random sampling consistency; Embedded system
1. Introduction
Ship Intelligent Handling and Control Simulation Platform is a simulation test platform for automatic ship collision avoidance researches and shipping intellectualization and its control module is one of the major innovative points of the Platform [1-3]. The main content of shipping intellectualization includes realizing intelligent decision-making support and intelligent target ship function for automatic ship collision avoidance. Besides, there are two automatic control models for the ship, course and track control modules, which can achieve automatic ship collision avoidance and automatic track monitoring respectively and be applied in algorithm tests of both automatic ship collision avoidance and intelligent control [4-6]. As the development of researches on shipping sciences and technologies has been focusing on improving shipping safety and to realize automatic ship collision avoidance, minimize and completely eradicate collision accidents by human factors from happening earlier, there is an increasing number of shipping simulator projects such as automatic yacht handling and control training and simulation platform entrusted by enterprises during the construction process of implementing platform projects. For long-term considerations, the realization of shipping intellectualization requires that the navigation equipment is equipped with a function of intelligent track control; and for short-term considerations, the shipping intellectualization module of Ship Intelligent Handling and Control Simulation Platform requires the realization of automatic ship control (intelligent control in course and track) function [7-9].
2. Methods Applied in the Thesis
Read video images
Extract information of channel line profile
Fit the profile using B-Spline
Final recognition results
Figure 1. Algorithm flow diagram
2.1. Extraction of Channel Line Profile
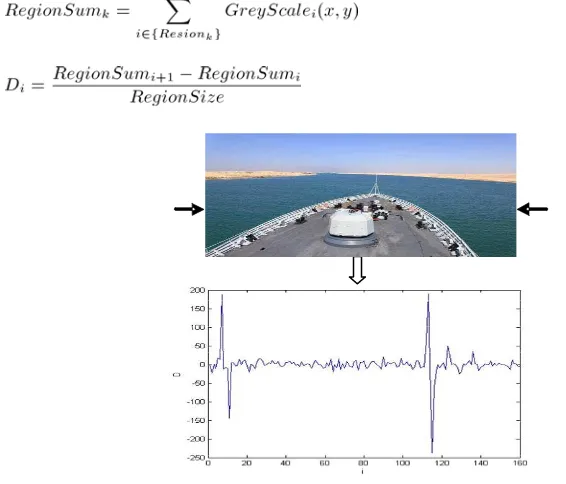
Generally, channel lines are white or yellow lines which are outstanding under the background of river surface and other ships in the images. In the Thesis, the profile is extracted by adopting the characteristics of grayscale differences of channel lines. To keep a balance among Channel R, G and B, in the Thesis, the value of grayscale is defined as:
(1)
In the Thesis, image on the same line is divided into several regions and each region contains certain number of adjacent pixels. After obtaining the total grayscale of each pixel of each region, we can analyze the grayscale differences of channel line in the images. The definitions are as follows: and in the equation refer to Region K and grayscale difference between Regions i+1 and i respectively. The value of region is determined by the width of the channel line while in the Thesis it’s 6.
(2)
(3)
Figure 2 has shown the read original grayscale image and the changing curve of region i with D of certain line, the pixel of the line is marked with arrows in the original image. It can be clearly seen from the figure that there is a pair of positive and negative values of D curve where the channel lines lie.
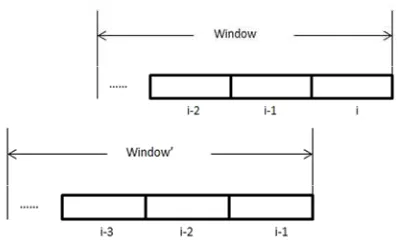
The objective of the Thesis is to find out the channel line profile through these peak values. In the algorithm, for the convenience of extracting peak values, several adjacent regions are combined into one window where local maximum grayscale differences are to be found. The area of the window is related to the width of the picture. In the Thesis, we set that there are 20 regions in each window, i.e. 120 pixels. Figure 3 is a schematic diagram of window, where I, i-1…represent the regions in the window. The initial position of each window is located at the right end of each line’s pixel, which moves to the left after algorithm and turns into Window’ until the left end [13-16]. The algorithm procedures are as follows:
(1) Calculate all D’s values in the Window using Equation (3).
(2) Find out the maximal and minimal D values and record their positions; the profile location of channel lines can be presented by a pair of adjacent positive and negative value.
(3) Filter the peak value. The positive peak value shall be larger than the minimum grayscale difference between the channel line and background road. Through statistic comparison, the threshold value in the Thesis is defined as 25.
(4) Move the window towards left and repeat Step 1 till the window lies at the left end of the image.
Figure 3. Schematic diagram of window and its internal region’s structure
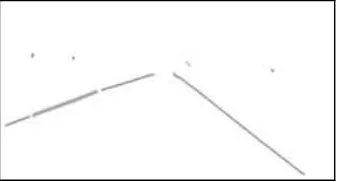
Figure 4 shows the recognition result of channel line profile. The original picture is the first half in Figure 2.
Figure 4. Profile of the channel line
2.2. Matching of Channel Line Profile
adopted the B-Spline curve to fit the profile for three times and obtain a mathematical expression as follows:
(4)
Where , , , and are 4 control points of the curve. The algorithm procedures are as follows:
(1) Random sampling. When randomly sample among profile pixel of channel lines, the probability for a pixel to be selected is proportional to its grayscale difference D. Such a sampling probability distribution should benefit to select the profile pixel of channel lines more effectively and eliminate noise disturbance.
(2) Curve fitting. Conduct B-Spline fitting using least square method based on the randomly sampled points.
(3) Fitting curve evaluation. Generally, the fitting results are evaluated by focusing on obtaining the distances from all points to the fitted curve based on a fitting method of random sample consensus algorithm. Given the huge calculations involved in this method, we here adopt another simpler evaluation method. In most instances, channel lines in images are relatively long curves with pretty small curvature. Through this characteristic, we can determine a parallelogram area using fitting curve, as is shown in the dashed box of Figure 5. Then we record the profile points S of channel lines within the area. The larger S is, the better the fitting curve meet the demands. Besides, the width of the parallelogram is half of the window’s aforesaid.
Figure 5. Schematic diagram for evaluating the quality of the fitted curve
The curve with maximum S, i.e. the objective curve, should be resulted from repeating the above procedure of random sampling-fitting-algorithm till certain numbers of circulations are finished. Figure 6 shows the effect picture after RANSAC fitting (the original image is the first half in Figure 2). It can be found that, compared with previous profile extract effect picture (Figure 4), RANSAC –based curve fitting can effectively extract channel line pixels conforming to model features from images containing large amount of noises. Further channel line fitting results will be discussed hereunder.
3. Experiment Result and Coresponding Analysis
In order to verify the rapid identification algorithm of channel lines provided in the Thesis, we conduct several groups of experiments, the results of which prove not only the high efficiency and accuracy of the algorithm but also its excellent effect on embedded equipment as well as its application and real practice. The experiment contains two parts: the first part is verification experiments which are many performed on desk computers to test the recognition results and running speed of the algorithm; and the second part are transplant experiments which applies the algorithm in embedded platform to test its efficiency in practical application.
3.1. Verification Experiments
To verify the effectiveness of the rapid channel line identification algorithm, a series of images are randomly collected from the images shared by the Machine Vision Lab of The Ohio State University, USA. The detailed numbers are as shown in Table 1 and the image resolution is 640×480. Several channel line recognition effect picture are shown in Figure 7 which covers various conditions including different road section, channel line type and backgrounds. In Figure 7, the left parts are the original images while the right parts are the recognized channel line image. The figure has clearly proven that the algorithm in the Thesis can effectively recognize channel line under conditions that there are barriers on the road or other sailing ships or the channel lines are depicted using whether solid line or dotted line, straight line or curve, thus presenting a good robustness.
Table 1. Source and number of the experiment images
Source of the sailling routes Number of image (frame)
wpt001 1000 wpt002 400 wpt004 800
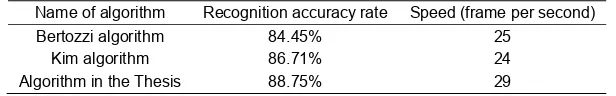
In the Thesis, the detailed algorithm accuracy rate is resulted from manually marking the channel lines of the 15% images randomly selected from the test images. Several other relatively typical algorithms are also selected to compare with the algorithm provided here, including the channel line recognition method based on perspective transformation and Hough transformation by Bertozzi and channel line recognition method [12] based on artificial intelligent neutral network and curve fitting by Kim. The experiment results are as shown in Table 2. The platform in the verification experiments is normal PC computer, the processor of which is Intel Core 2 Dual-Core 1.8 GHz. To ensure fairness, all algorithms in the verification experiments are performed only using C language and without further optimizations.
Table 2. Experiment and test results from different channel line algorithm
Name of algorithm Recognition accuracy rate Speed (frame per second)
Bertozzi algorithm 84.45% 25
Kim algorithm 86.71% 24
Algorithm in the Thesis 88.75% 29
It’s can be easily found out from contrast experiments that the channel line recognition algorithm in the Thesis results in better effect compared with other two representative ones—the former has higher accuracy and speed. The main causes include:
Table 3. Noise proportions of various channel line profile extraction algorithm
Name of algorithm Noise proportion
Algorithm in the Thesis 68.54%
Sobel operator 80.72%
Perwitt operator 78.15%
Roberts operator 76.63%
The quicker RANSAC fitting method is adopted in the Thesis. When sampling data with RANSAC of the algorithm, the sampling probability is proportional to the grayscale difference D, which makes it easier to extract the real channel line pixel, thus effectively reduce the number of iterations—through the RANSAC method in the Thesis, only 35 iterations are required while 50 circulations are needed in the RANSAC adopted by Kim. As mentioned above, the calculation of curve fitting is pretty large. Therefore, less iteration can greatly improve the running speed of the algorithm.
3.2. Realization in Embedded Platform and the Test Results
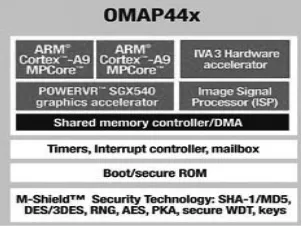
After verifying the algorithm’s advantages in recognition accuracy and speed, we test the algorithm in an embedded platform and optimize its performance. As both the internal ship space and function are limited, embedded equipment has been the optimized choice for ship intelligent driving system. Therefore, the running efficiency of channel line recognition algorithm in embedded equipment shall decide its application future in real intelligent driving system. The experiment platform in the Thesis is an experiment panel based on TI OMAP4430 chip, an embedded processing chip equipped with dual-core ARM Cortex and have been widely applied in various mobile equipment (such as ship-load navigation equipment, e-book reader and smart phone etc.), and 512MB SDRAM. Figure 7 shows the internal structure [17] of OMAP 4430 chip.
Figure 7. Internal structure of OMAP 4430 chip
Given the processing feature of the embedded platform, the following optimizing procedures are conducted in transplanting the algorithm:
(1) Use fixed-point number as the calculation form. The OMAP chip is more effective in processing fixed-point number calculation than floating-point number calculation, so where there require floating-point number calculation shall be transferred into fixed-point numbers.
(2) Make full use of the DSP calculation module in OMAP 4430 chip—use DSP to speed up the curve fitting part with larger data calculations (other parts shall be processed by ARM dual-core processor as their if-else is multiple—making full use of the hardware property of the platform).
Table 4. Test results on embedded platform
Name of algorithm Speed before optimizing Speed after optimizing
As shown in Table 4, after being optimized, the running speed of the algorithm in embedded platform can be up to 12 frames per second, 33% quicker than the speed before optimizing. Generally, the driving speed of ship on highways is around 100km/h (≈28m/s) and lowers on municipal non-overhead roads. Under conditions that the visibility is not too bad (except extreme atrocious weather such as heavy fog, rain and snow etc.), a frame of image can totally grasp the road condition 30m ahead. Therefore, the rapid channel line recognition provided in the Thesis can keep a relatively rapid running speed in embedded equipment and can satisfy the demand of real intelligent driving system.
4. Conclusion
The Thesis provides a rapid channel line recognition algorithm on the basis of machine vision which firstly outlines the profile pixel of channel line using the grayscale differences between channel lines and background roads and then fit the profile pixel using RANSAC based on B-Spline model. From the results of several verification experiments, we find that the recognition rate and speed of this method is up to 88.75% and 29 frames per second respectively, which has obvious performance advantages compared with the classic algorithm in the domain. Besides, aiming at the demands of real ship intelligent driving system, the algorithm is also tested and optimized on embedded platform. The optimized speed can reach 12 frames per second, which has huge application potential in intelligent sailing domain.
References
[1] Soni RA. A Study on Android Application Development. Journal of Telematics and Informatics. 2013; 1(2): 89-96.
[2] Lv Z, Li X, Zhang B. Managing Big City Information Based on WebVRGIS. IEEE Access. 2016; 4: 407-415.
[3] Corbier C, Badaoui ME, Ugalde HMR. Huberian Approach for Reduced Order ARMA Modeling of Neurodegenerative Disorder Signal. Signal Processing. 2015, 113: 273-284.
[4] Su S, Wang S. Simple Monitoring Network System of Wireless Sensor Network. Bulletin of Electrical Engineering and Informatics. 2012; 1(4): 251-254.
[5] Jiang D, Xu Z, Lv Z. A multicast delivery approach with minimum energy consumption for wireless multi-hop networks. Telecommunication Systems. 2015; 1-12.
[6] Liu Y, Yang J, Meng Q. Stereoscopic image quality assessment method based on binocular combination saliency model. Signal Processing. 2016; 125: 237-248.
[7] Lv Z, Yin T, Han Y. WebVR-web virtual reality engine based on P2P network. Journal of Networks. 2011; 6(7): 990-998.
[8] Yang J, Zhou J, Lv Z. A Real-Time Monitoring System of Industry Carbon Monoxide Based on Wireless Sensor Networks. Sensors. 2015; 15(11): 29535-29546.
[9] Jiang D, Ying X, Han Y. Collaborative multi-hop routing in cognitive wireless networks. Wireless Personal Communications. 2016; 86(2): 901-923.
[10] M Abdar, SRN Kalhori, T Sutikno, IMI Subroto, G Arji. Comparing Performance of Data Mining Algorithms in Prediction Heart Diseases. International Journal of Electrical and Computer Engineering (IJECE). 2015; 5(6): 1569-1576.
[11] Lv Z, Halawani A, Feng S. Multimodal hand and foot gesture interaction for handheld devices. ACM Transactions on Multimedia Computing, Communications, and Applications (TOMM). 2014; 11(1s): 120-128.
[12] Cui Y, Zhang S, Chen Z, Zheng W. A New Digital Image Hiding Algorithm Based on Wavelet Packet Transform and Singular Value Decomposition. TELKOMNIKA Indonesian Journal of Electrical Engineering. 2014; 12(7): 5408-5413.
[13] Pennestrì E, Belfiore NP. On Crossley's contribution to the development of graph based algorithms for the analysis of mechanisms and gear trains. Mechanism & Machine Theory. 2015; 89: 92-106.
[14] Lv Z, Halawani A, Fen S. Touch-less Interactive Augmented Reality Game on Vision Based
Wearable Device. Personal and Ubiquitous Computing. 2015; 19(3): 551-567.
[15] Ontrup J, Wersing H, Ritter H. A computational feature binding model of human texture perception. Cognitive Processing. 2004; 5(1): 31-44.