1
Determination of Damage Location in Reinforced Concrete Beams
Using Mode Shape Curvature Square (MSCS) Method
Fadillawaty Saleh
1,2*1Department of Civil Engineering, Muhammadiyah University of Yogyakarta, Indonesia
2
School of Architectural, Civil and Mechanical Engineering, Victoria University, Australia *[email protected]
Keywords: reinforced concrete, damage detection, frequency response functions, vibration testing
Abstract
This paper presents a numerical algorithm technique to detect cracks propagated in concrete beams based on the frequency response curve of the beam determined from vibration testing. Impact tests on simply supported reinforced concrete beams were conducted to measure vibration on the beam. The ICATS software was carried out to capture the Frequency Response Functions (FRFs) data at each load step. Utilizing the FRFs data, a numerical algorithm based on finite different methods was performed to compute the different FRFs between undamage and damage beams based on the mode shape curvature square (MSCS) method. The numerical damage location was defined by subtracting the MSCS undamage to damage beams. Therefore, the accurate damage location was identified by comparing the numerical and observed experimental results.
Introduction
Dynamic system identification of RC beams i.e. natural frequencies, damping ratios and mode shapes are of high importance due to their special roles in most civil engineering structures. Dynamic characteristics of reinforced concrete (RC) structural beams can be recognized as dynamic system identification. In general damage in the RC structural system is detected by comparing the identified dynamical indices of the undamage (intact) and damage structures. With this regard,
various studies have been conducted by previous researchers [2, 6]. Spyrakos et al.[8] performed a
series of experiments on a set of beams. Each beam was given different damage scenarios (type, location and degree), and low-level free vibration tests were performed. They found a definite correlation between the level of damage and the dynamic characteristics of the structure. Ren and Roek [4] experimentally developed a methodology of structural damage identification through changes in the dynamic characteristics. They used concrete beam stiffness for damage assessment and the proposed methodology relied on the fact that damage leads to changes in the dynamic properties of the structure such as natural frequencies and mode shapes.
2
present SDIM through some numerically simulated damage identification tests.
This paper reports preliminary results on undamage and damage RC beams investigated through dynamic testing in order to assess damage location due to cracking correlated to static loading. Two out of ten beam specimens were initially tested to determine damage location. As for RC beams, the comparison of response between those two beams was developed considering the effects of increasing loading. Dynamic investigation was carried out on both undamage (intact) and damage RC beams measuring natural frequencies and evaluating vibration mode shapes. The dynamic tests allowed recording frequency response variations at different modes of vibration as well as verifying that frequency values of natural vibration were reduced by damage due to cracking [9].
Description of Damage Detection Techniques
Natural Frequencies and FRFs
Rytter [5] introduced a damage state classification system, which has been widely accepted by the community dealing with damage detection and Structural Health Monitoring (SHM). Generally, identification of the damage type and extent require prior knowledge of the structural behavior in the presence of each of the possible expected failure modes for future correlation with experimental data, which is normally achieved by resorting to analytical models [10]. For example, in operational monitoring, the modal parameters of the damaged structure must be compared to the parameters of the structure in its undamage state, in what is called global diagnostics.
Methods based on natural frequency shifts often fall into one of two categories: the forward and the inverse problem. The forward problem comprises in determining what the natural frequency changes due to a known damage case (which may include its location, extension and type) will be. Typically, damage is modeled numerically and the natural frequencies are measured experimentally and compared to those related to each of the damage cases initially predicted. The inverse problem consists of determining damage parameters, such as crack length or location, from changes in the natural frequencies.
Mode Shape and FRF Curvature
Mode shape and FRFs curvatures are widely used as an alternative to damage identification from mode shape changes. Salawu and Williams [7] evaluated the performance of some procedures for locating damage using mode shape curvature (MSC) and mode shape changes. The first method estimates the mode shape curvatures using a central difference approximation [3]. Since a local reduction in stiffness results increase in the curvature, it is reasonable to suppose that these can be used to detect, locate and quantify damage. The second method studied by Salawu and Williams [7] is based on the mode shape relative differences [1], in which a graphical comparison of displacement mode shapes is used to indicate damage position.
A previous research [2] attempted to evaluate whether the presumption that damage is located at the point where the mode shape change is the greatest is valid using both simulated and experimental data, since the differentiation process enhances the experimental variations inherent to mode shapes. There are five methods based on mode shapes and their derivatives: flexibility index (FI), mode shape curvature (MSC), mode shape curvature square (MSCS), mode shape slope (MSS) and mode shape amplitude comparison (MSAC). However, this paper exploited the possibility to detect the damage of reinforced concrete beam structures by simply using the changes of frequency response function measurements so called MSCS. Other methods will be explored in the future publication elsewhere.
Experimental research on RC beams
3
were carried out in laboratory. Damage was due to cracks propagation obtained in the beam by incremental static loads. During the experimental research, four groups of beam with different confinement ratios were tested. Table 1 presents typical beam specimens and confinement detail used in this research. The different types of beam specimens were chosen to represent the typical beams used in practical design varying in confinement ratios. After testing, the compressive
strengths of concrete (fc’) was averaged ranging from 33.30 to 45.6 MPa and were used for entire
beam specimens. In this research, all typical beam specimens were strengthened with reinforcing bars consisting of longitudinal reinforcements and stirrups. Tensile yield stresses of reinforcing bar
(fy) were 350 MPa and 260 MPa for diameter of 10 mm (Ø10) and 6 mm (Ø6), respectively. Two
pairs of longitudinal reinforcements with the diameter of 10 mm were placed at the top and bottom beam for the flexural resistance. Whilst, the shear reinforcements with diameter of 6 mm were used in all three typical beam specimens having a variety of stirrup pitches ranging from 60 to 150 mm.
Table 1. Typical beam specimen and confinement detail
Beam
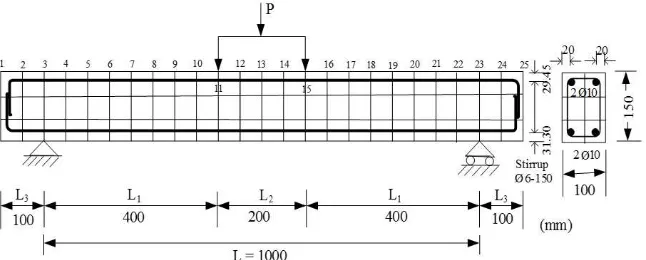
Dynamic tests developed with the same procedure were carried out on the ten RC beams having a dimension of 1.20 m in length (1.00 m in clear span) and with a rectangular section area of
100x150 mm2. The first group beam specimen was reinforced with four longitudinal steel bars with
a diameter of 10 mm without stirrups, while other three groups were confined differently as tabulated in Table 1. Fig. 1 depics the flexural reinforcements used in overall beam specimens. The
stirrups were positioned along L1 = 400 mm length from the support. The RC beams were subjected
to monotonic loads at two points loading of nodals 11 and 15. 2Ø10 2Ø10
Stirrups
Ø6-150 Ø6-150 Ø6-100 Ø6-200 Ø6-100 Ø6-150 Ø6-150
2Ø10
2Ø10
4
Fig. 1. Typical RC beam specimen and reinforcement detail
The test beam was applied to static two-point bending tests to introduce crack-damage in a controlled way. The loading steps were incrementally performed on a universal testing machine by controlling the displacement. The static load was applied to the beam specimen until the ultimate load reached. Since the beam length was larger than the width of the testing bench, the beam had to be mounted orthogonal to the plane of the machine. The middle section of the test beam was instrumented with a dial gauge at midspan to measure the vertical deflection. Each beam was applied to static load steps, which were gradually increased to reach the ultimate load. The loading arrangement on each beam was ranged between 5 to 10 steps depending on the confinement ratio used. The load step was recorded from the beginning up to failure occurred in order to measure the deflection value and crack propagation.
A modal test utilizing a dual channel signal analyzer and other devices was setup to collect frequency response functions (FRFs) at each specified node. During the dynamic test, the Imperial College Analysis & Testing Software (ICATS) was carried out. A feature of the software so called Modacq program was used in the data acquisition from IEEE (Institute of Electrical and Electronics Engineers) interface analyzers and sine sweep with frequency response analyzers. Another program so called Modent was carried out to extract the modal parameters from measured data while the corresponding predictions could be obtained using the finite element package. The preliminary dynamic test to record the FRFs data was firstly undertaken on an undamage beam utilized as a control beam. Other dynamic tests to measure the FRFs data were continuously performed on the damage beam specimens after completing each step of static loading.
Results and Discussion
Load displacement response
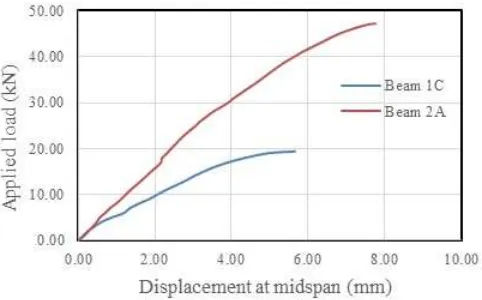
It has been clearly described that four beams type 1 were reinforced with four longitudinal reinforcing bars without confining with stirrups mounted along the beam length. Whilst other beams were similarly used four flexural reinforcements and confined with varying stirrup pitches disposed along specified length, L1. Whilst at midspan L2 was simply applied to minimum confinement ratio. During the test, applied load, vertical deflection, and crack propagation were consistently recorded. Fig. 2 presents load-displacement responses of two different beam specimens (types 1C and 2A) extremely show how the experimental model works. Both specimens are briefly described in Table
2 following with the maximum of frequency and modulus FRF-MSCS difference for predicting
5
Fig. 2. Load-displacement relationships for beams 1C and 2A
Table 2. Load step correlated to the maximum of frequency and modulus FRF-MSCS difference
Static
Frequency Abs. Mod. FRF-MSCS diff. Frequency Abs. Mod. FRF-MSCS diff.
(kN) f
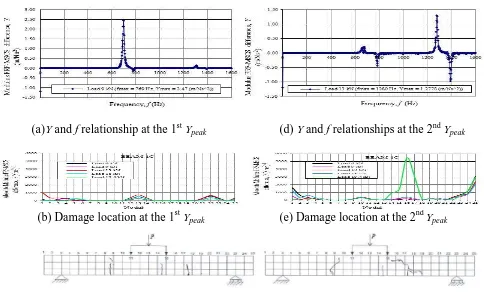
Fig. 3 presents a set of damage location scenario for the beam specimen 1C considering every static load step, maximum frequency as well as maximum modulus FRF-MSCS difference (Table 2) to define the initial and final damage locations. The FRFs data collection during the dynamic tests was consistently conducted until maximum static load achieved. The dynamic impact loading was accomplished by hitting the hummer on the top specimen in the transversal direction. The resulted vibration signal was recorded with ICATS, and was subsequently analyzed by carrying out the ICATS software. The natural frequencies were based on the maximum natural frequency at node where the accelerometer was put in the same place with the applied impact load using the hummer. The captured FRFs data presents the best FRF signal at every applied static loads step (Fig. 3a and Fig. 3d). After extracting all FRFs, it has been found that the third mode shape is always the most sensitive to the damage due to the maximum natural frequency appear at the mode shape number three. The rest problem was most likely affected by bad FRF data capturing. Whilst other maximum natural frequencies appear at modes 2, 4, 5 and 6, but it is still in normal condition. In addition, the maximum natural frequency at every applied load was recorded to prove that every static load increased the maximum natural frequency decreased and the damage developed from small to largest damage. In other words, only at the maximum natural frequency relating to mode shape number three could accurately detect the presence of damage due to the maximum natural
frequency and maximum energy (E, or Amplitude) as presented in Fig. 3b and Fig. 3e for the first
and second peaks of its modulus FRF-MSCS difference, respectively. Based on the FRF curve approach, when the beam damage progressively succeeded the beam stiffness severely reduced resulting the residual strength remains very small as shown in Fig. 3c and Fig. 3f.
6
Fig. 3a and Fig. 3d show two dimensional plots at nodes 13 and 16 between magnitude FRF and frequency. To determine the damage location, it can be generally calculated by taking into account the modulus FRF-MSCS difference at maximum frequency that may be occurred at particular nodal along the beam length. Utilizing the method of FRF-MSCS difference, at frequency 769 Hz
produced maximum magnitude FRF of 2.47 m/N-s2. Fig. 3b and Fig. 3e depict the results of
damage detection for scenarios 1 (first highest frequency) and 2 (second highest frequency) where severity damage possibly occurs. Furthermore, the damage location predicted by dynamic test is now compared to the observed damage location subjected to the static load (Fig. 3c and Fig. 3f).
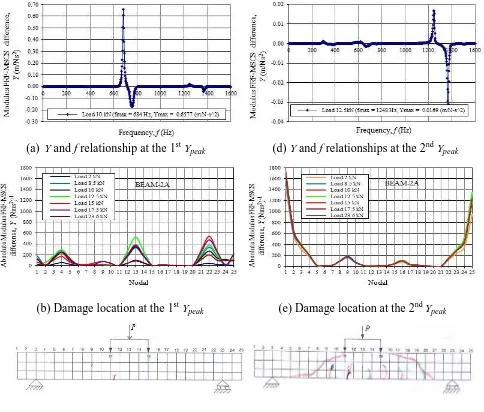
Potential damage of the beam type 2A subjected to 10 kN applied static load, for instance, could be identified at the maximum frequency of 684 Hz (Fig. 4a). Based on this frequency, the damage location could be accurately figured out. Analogous procedures for other applied static loads; damage locations at each load could be plotted together as presented in two-dimensional representation (Fig. 4b and Fig. 4e). It can be noted from this figure that the locations of damage were occurred at mid span and nearby both supports. Using the same procedure, numerical computations were carried out by the developed Matlab program resulting the damage location either in two or three-dimensional representation as shown in Fig. 4b and Fig. 4e. For a sake of comparison of the damage location, the dynamic tests may precisely predict the damage location subjected to seismic action. It is obvious that the accurate results consistently present the same locations as observed experiment due to static loads (Fig. 4c and Fig. 4f).
In addition to the discussion of damage location subjected to static load, vertical small cracks associated with flexural cracks initially propagated at mid points along L2 and continuously spread out at the tensile fiber concrete. When the applied load increased step-by-step, flexural cracks in
combination with shear cracks were experienced along L1. At the final stage of loading, long-line
diagonal wide-cracks were dominated by shear force occurring at nearby both supports across the points loaded. Although the concrete contributes to resist small shear force, however the beam seriously suffers shear and flexural cracks damage. Similarly to the beam specimen 1C, Fig. 4 completely presents the damage location scenario for the beam specimen 2A.
(a)Y and f relationship at the 1st Ypeak (d) Y and f relationships at the 2nd Ypeak
(b) Damage location at the 1st Ypeak (e) Damage location at the 2nd Ypeak
(c) Observed initial crack propagation (f) Observed damage beam
7
(a) Y and f relationship at the 1st Ypeak (d) Y and f relationships at the 2nd Ypeak
(b) Damage location at the 1st Ypeak (e) Damage location at the 2nd Ypeak
(c) Observed initial crack propagation (f) Observed damage beam
Fig. 4. Damage location scenario for the reinforced concrete beam 2A
Concluding Remarks
Based on the results and discussion, the conluding remarks can be summarized in the following important pointers.
1. The damage location can be accurately identified by the FRF-MSCS method producing
measured frequency response functions and demonstrating the accurate damage location that can be realized by using frequency response functions with an unlimited amount, therefore identification of the magnitude of damage can be achieved with high degree of accuracy as a result of an appropriate method adopted.
2. Although the frequency of beam mostly decreases, but its maximum amplitude of vibration
increases when eccentric mass and dynamic load increase.
3. The results indicate that maximum amplitude of vibration, bending stiffness and natural
frequency of beam decrease with increasing degree of cracking.
4. The proposed FRF-MSCS method has accurately predicted the damage location of RC beams as
8
References
[1] C. H. J. Fox, The Location of Defects in Structures: A Comparison of the Use of Natural
Frequency and Mode Shape Data”, Proceedings of the 10th International Modal Analysis
Conference, San Diego, California, Vol. 1, (1992), p. 522-528.
[2] Y. K. Ho, and D. J. Ewins, On Structural Damage Identification with Mode Shapes,
Proceedings of COST F3 Conference on System Identification and Health Monitoring,
Madrid, Spain, p. 677-686 (2000).
[3] A. K. Pandey, M. Biswas, M., M. M. Samman, Damage detection from changes in curvature mode shapes”, J. Sound Vib., Vol. 145 (2), (1991), p. 321-332
[4] W. X. Ren, and G. De Roeck, Structural damage identification using modal data. I: Simulation Verification, J. Struct. Eng., Vol. 128 (1), (2002), p. 87-95.
[5] A. Rytter, Vibration based inspection of civil engineering structures, Ph. D. Dissertation, Department of Building Technology and Structural Engineering, Aalborg University, Denmark, 1993.
[6] O. S. Salawu, Detection of Structural Damage through Changes in Frequency: A Review,
Engineering Structures, Vol. 19, No. 9, (1997), p. 718-723.
[7] O. S. Salawu, and C. Williams, Damage Location Using Mode Shapes, In proc. of 12th
International Modal Analysis Conference, (1994), p. 933 – 939.
[8] C. Spyrakos, H.L. Chen, J. Stephens, and V. Govidaraj, Evaluating Structural Deterioration Using Dynamic Response Characterization, Proc. Intelligent Structures, Elsevier Applied
Science, (1990), p. 137–154.
[9] M. Ohtsu, Recommendation of RILEM TC 212-ACD: acoustic emission and related NDE techniques for crack detection and damage evaluation in concrete, Material and Structures, Vol. 43 (2010), p. 1183-1186.