UNIVERSITI TEKNIKAL MALAYSIA MELAKA
HEAD-UP DISPLAY (HUD) INTERFACE DESIGN FOR
AUTOMOTIVE APPLICATION
This report submitted in accordance with requirement of the Universiti Teknikal Malaysia Melaka (UTeM) for the Bachelor Degree of Manufacturing Engineering
(Manufacturing Design)
By
OOI CHIN POW
B051110053
900315075239
DECLARATION
I hereby, declared this report entitled “Head-Up Display (HUD) Interface Design for Automotive Application” is the results of my own research except as cited in references.
Signature : ………
Author’s Name : ………
APPROVAL
This report is submitted to the Faculty of Manufacturing Engineering of UTeM as a partial fulfillment of the requirements for the degree of Bachelor of Manufacturing Engineering (Manufacturing Design) (Hons.). The member of the supervisory is as follow:
i
ABSTRACT
ii
ABSTRAK
iii
DEDICATION
To my beloved parents
iv
ACKNOWLEDGEMENT
v
LIST OF ABBREVIATIONS, SYMBOLS AND NOMENCLATURE xi
CHAPTER 1: INTRODUCTION 1
1.1 Background 2
1.2 Problem Statement 3
1.3 Research Objectives 4
1.4 Scope and Limitations 5
CHAPTER 2: LITERATURE REVIEW 7
2.1 Head-up Display 8
2.2 Working Mechanism of Head-Up Display 9
2.3 Principle of Human-Machine Interface 13
2.4 User Centered Design 17
2.5 Usability Evaluation Method 19
2.6 Car Technology Acceptance Model 22
vi
CHAPTER 3: METHODOLOGY 29
3.1 Research Framework 30
3.2 Phase 1: Theoretical Study 31
3.3 Phase 2: Exploratory Study 31
3.3.1 Car Technology Acceptance Model Survey (CTAM) 32
3.3.2 Kansei Study 33
3.3.3 Design Elements 36
3.4 Phase 3: Interface Development 37
3.5 Phase 4: Interface Evaluation 38
Chapter 4: RESULT AND DISCUSSION 40
4.1 Result of Exploratory Study 41
4.1.1 Result of Car Technology Acceptance Model Survey 41
4.1.2 Result of Kansei Engineering 42
4.1.2.1 Kansei Survey 42
4.1.2.2 Design Elements 46
4.1.2.3 Partial Least Squares Regression 51
4.2 Interface Development 54
Car Technology Acceptance Model 64
vii
Survey Results 66
Performance Expectancy 66
Effort Expectancy 68
Attitude towards Using Technology 70
Social Influence 72
Facilitating Conditions 74
Self-Efficacy 76
Anxiety 78
Behavioral Intention to use the System 81
Perceived Safety 82
Partial Least Square Regression 85
Easily to Differentiated 85
Easily to Recognize 85
Easily to Read 86
Useful to Driver 87
Easily to Guess Their Functions 87
Easily Seen and Clear 88
Easy to Understand 88
Modern Design 89
Simple Design 90
viii
LIST OF TABLES
2.1 Definition of determinants. 23
3.1 Kansei survey questions. 34
4.1 First design element table. 47
4.2 Second design element table. 48
4.3 Third design element table. 49
4.4 Fourth design element table. 50
x 4.7 The summed coefficients of design elements. 52
4.8 Preliminary icons of the new interface. 54
xi
LIST OF ABBREVIATIONS, SYMBOLS AND
NOMENCLATURE
AR - Augmented Reality
CPA - Multimodal Critical Path Analysis CTAM - Car Technology Acceptance Model DALI - Driving Activity Load Index DLP - Digital Light Processing FOV - Field of View
GM - General Motor
GPS - Global Positioning System HA - Heuristic Analysis
HCI - Human Computer Interaction HDD - Head-down Display
HMI - Human Machine Interface HTA - Hierarchical Task Analysis HUD - Head-up Display
IVIS - In-Vehicle Information System IVS - In-Vehicle System
LA - Layout Analysis
xii PGU - Picture Generation Unit
PLS - Partial Least Square
SHERPA - Systematic Human Error Reduction and Prediction Approach SUS - System Usability Scale
TAM - Technology Accept Model
TI - Texas Instruments
UCD - User Centered Design
1
CHAPTER 1
INTRODUCTION
This work address the design and development aspect in the context of automotive head-up display interface. Head-head-up display (HUD) directly displays the driving information onto the windshield or combiner, and this would greatly reduce the frequency and duration of the driver’s vision shifted away from the road (Kiefer, 1991; Kaptein, 1994). Driver able to acquire necessary information while remains focus on the road condition. Hence, the driving performance is improved and road safety is ensure. Nevertheless, some researches on head-up display has been carried out, Smith and Fu (2010) used Kansei Engineering to study the relationship between HUD interface and driver’s emotions; Liu and Wen (2004) have studied the driving performance of conventional head-down display and head-up display. Besides, the literature have suggested the design of HUD interface should base on consumer viewpoint and satisfaction.
2
1.1 Background
Generally, the head-up display was developed to assist pilots operate aircraft. In 1960s, the first operational HUD was used in Blackburn Buccaneer (Liu, 2003), an aircraft designed to carry a nuclear bomb below the radar coverage. Later on, in early 1970s, the first civilian use head-up display was used on McDonnell Douglas MD-80, to display guidance and flight information. For automotive, it is first introduced by General Motor (GM), an American company, in their Oldsmobile and Pontiac models. In recent years, automotive manufacturers have implemented HUD technology in their luxury car to attract buyers. For example, BMW, Cadillac, Toyota, Buick LaCrosse, Lexus, Kia, Hyundai, Mercedes and Peugeot are equipped with head-up display. Driving information such as speedometer, fuel level, engine speed, warning lights, gear position and navigation are presented on HUD. The image of HUD is presented either on the windshield or any transparent display, according on the preference of automotive manufacturers.
3
1.2 Problem Statement
For many years, people have debated about the causes of car accident. And one of the causes would be the driver’s distraction while on the road (French, 1990; Wierwille, 1995). According to David (2012) distraction is an act of inattention which the driver focus on other tasks while driving. Distractions may come from built-in devices in the vehicle, smartphone or from persons who on board. There are several kind of distractions, where the driver have to look away from the windshield and focus on a particular task, where the driver give away the control of steering wheel to perform certain task and where the driver is thinking on other matters while on road. Beside the impact is not only limited by type, but also the frequency and duration of the task. Although a task might be less distraction compared to the others, but with high frequency or long duration, it can increase the risk of car accident.
America National Highway Traffic Safety Administration (NHTSA) stated an estimated of 899,000 cases are involved distraction of driver in 2010 and out of 3 percent is related to built-in system of the vehicle. Therefore, NHTSA have conducted several studies to identify the relationship between distraction and driving safety. A guidelines have been developed to reduce the distraction and car accident.
4 HUD improve the driving performance and reduce the collisions occurred (Burnett, 2003; Yung Ching, 2003; Liu and Wen, 2004; Charissis et al, 2008).
However, with HUD, distraction still occurs, where the driver subconsciously focused on the driving information presented on HUD (Gish and Staplin, 1995; Prinzel and Risser, 2004; Tufano, 1997). It is also caused by switching of vision between two sources, HUD and the road environment, especially in high traffic areas. Therefore, HUD should provide a simple and easily recognition design to reduce the attention and focus of driver on HUD. As an example, when a driver looking at the icons of HUD and hesitate for a seconds, it will cause the driver to focus at thinking and eventually loss concentration on the road event. Therefore, the purpose of this study is to design and develop a head-up display interface to resolve the distraction problem as well as identify needs and requirements of consumer. All the methods employ will based on consumer viewpoint to fulfill customer satisfaction and easier to adopt new technology.
1.3 Research Objectives
5 1. To identify the consumer usability requirements on the head-up display interface. 2. To translate the consumer emotions into the aspects of interface design.
3. To evaluate and verify the performance of new interface.
The detail explanation of objectives are as follow:
1. In order to makes head-up display applicable and accept by the consumer, the consumer emotion on the interface must be investigated. The purpose is to understand how consumer think and feels when using the interface and what they expected to have on the interface.
2. To translate the consumer emotions, the results that collected from first objective must carefully analyzed. With the result of the analysis, the preference of the consumer on the design features can be determined easily. Fulfilling the preference can makes the consumer to think that the new interface is specially designed for them.
3. To evaluate and verify the performance of new interface, a suitable evaluation method must be discovered or developed. The evaluation method helps to benchmarks the performance of new interface and verify the feasibility.
1.4 Scope and Limitations
6 and usability of the technology. Besides that, this study focus on designing the virtual interface of head-up display, hence actual head-up display device is not employed.
In term of participants, it is focus on university or college student who acquired driving license at least 1 year. The age group of the participants would be limit within age 19 to 30. It is to avoid the excessive variation of participant behavior. Therefore, the data interpretation later would be easier to conduct, with focus on particular group of young people.
7
CHAPTER 2
LITERATURE REVIEW
The research on automobile head-up display has discussed how head-up display performs compare to convention head-down display (Liu and Wen, 2004), Kansei Engineering in head-up display (Smith and Fu, 2010), effects of using head-up display (Liu, 2003) and others. This especially makes sense in the context of using head-up display in automobile, where the head-up display may improve the driving performance but also cause additional distraction to the driver. This happen when the driver focus on the head-up display and less awareness to the road events ahead. According to Tufano (1997), head-up display possess two potential issues on driving safety. The focal distance of display and its effect on the cognition of actual objects when driving, and how the design of head-up display affect visual attention. This is where interface design comes in and play an important role in the efficiency and effectiveness of head-up display, which improve the driving performance as well as increase the road safety to all road users.
8 and design in Human-Computer interaction (HCI), includes the issues concerning automotive user interface, to further improve the design and usability.
Next, the chapter reviews technique that used to acquire the consumer information, example like Kansei study. These techniques capable to extract important information regarded head-up display from the consumer. In addition, the chapter reviews existing method in evaluating the usability of user interface. It is to explore and investigate their suitability in evaluate the In-Vehicle Systems (IVSs). Lastly, the chapter reviews previous studies on HUD to understand the findings of other researchers and their purpose of the studies. However, those studies did not target the interface design and the relation between interface design and overall performance. Thus, this study focus on the interface design in the aspect of usability to fill in the gap that have missed by other researchers.
2.1 Head-up Display
As mentioned in previous chapter, head-up display originally is used in military aircraft to assist the pilot in sighting weapons and provide an artificial horizon for navigation (Weed, 2011). In contrast to conventional head-down display, HUD collect the driving information and present it on the view of external world (Swift and Freeman, 1986). Therefore, the driver can view the information directly from the windshield without move away the eyesight from the road. As a result, the driver has a quicker response time than using conventional head-down display and the speed control of automobile are more consistent (V. Charissis, S. Papanastasiou, 2010; V. Charissis, S. Arafat, W. Chan, C. Christomanos, 2006; Y. C. Liu, M. H. Wen, 2004). Hence, the driving safety is improved along with the head-up display.
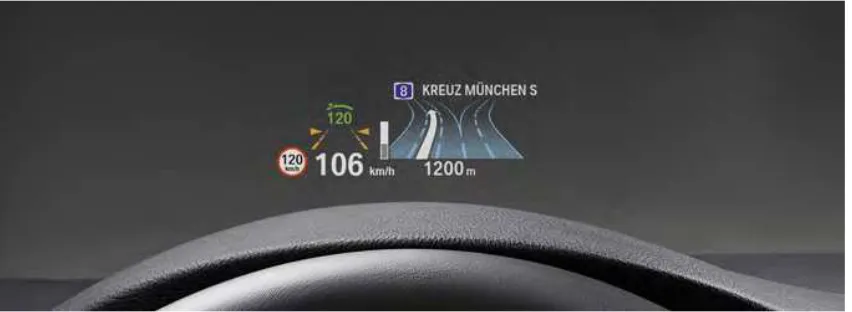
9 information by the preference of driver. The driving information presented by HUD includes speedometer, rpm meter, navigation directions, warning signals, fuel level, speed limit and estimated destination time. The speedometer works as conventional speedometer, which present the current speed of the automobile, so that the driver can easily keep track of their speed without risking their life. With the navigation directions feature of HUD, the driver no longer need extra navigation device or holding their smartphone as navigation device. The built-in navigation system of the automobile or by connecting to the smartphone, the HUD present the navigation directions right in front of the driver, which improve the ease of use, efficiency and the driving safety.
Some HUDs come with new features called “Pedestrian in the road”, lane departure warning and adaptive cruise control. “Pedestrian in the road” is to detect pedestrian and reduces the driver reaction time, further ensure the driving safety on road. For lane departure warning, it helps to keep the vehicle in the lane by warning the driver if departure happens. Lastly will be the adaptive cruise control, which able detect the speed of the vehicle or object ahead and adjust the vehicle speed accordingly.
2.2 Working Mechanism of Head-Up Display