Master of Computer Science (Database Technology)
Faculty of Information and Communication Technology
ANALYSIS PERFORMANCE OF DATABASE
PROGRAMMING FOR COMPUTATION IN STATISTICAL
APPLICATION
Nurul Najwa Binti Abdul Rahid @ Abdul Rashid
DECLARATION
I declare that this thesis entitle “Analysis Performance of Database Programming for
Computation in Statistical Application” is the result of my own research except as cited in the references. The thesis has not been accepted for any degree and is not concurrently submitted in candidature of any other degree.
Signature : ………
Name : Nurul Najwa Binti Abdul Rahid
@ Abdul Rashid
APPROVAL
I hereby declare that I have read this dissertation/report and in my opinion this dissertation/report is sufficient in terms of scope and quality as a partial fulfilment of Master of Computer Science (Database Technology).
Signature :………..
Supervisor Name : Dr. Noraswaliza Binti Abdullah
DEDICATION
i ABSTRACT
ii ABSTRAK
iii
ACKNOWLEDGEMENTS
Alhamdulillah, all praise and gratefulness is due to Allah. Thank you Allah for giving me good health and strength throughout my journey in completing this study.
First and foremost I also would like to offer my sincerest gratitude to my supervisor Dr. Noraswaliza Binti Abdullah, who has supported me, guided me with her patient, knowledge and experience. I gratefully acknowledge her for the supervision, advice, and contribution.
I also would like to express my gratitude to Universiti Teknologi MARA (UiTM) and Ministry of Education Malaysia for the sponsorship throughout the study.
My special thank goes to my family members, especially to my parent and my sister for their inseparable, inspirable and prayers. It is also pleasure to express my appreciation to my friends for supporting and encouraging me to complete this project. Without their support and encouragement, I would not able to complete it.
iv
1.6 Significant And Research Contribution 7
2. LITERATURE REVIEW 8
v
3.2.2 Design and Development 30
3.2.2.1 Database Design 30
3.2.2.2 Construct Stored Procedure for Computation 32
3.2.2.3 Develop Prototypes 33
3.2.2.3 Evaluation and Analysis 40
4. EXPERIMENT CONDUCTED 41
4.1 Introduction 41
4.2 Experiment Design 41
4.2.1 Experiment Setup 41
4.2.2 Experiment Environment and Framework 42
4.3 Evaluation Methods 43
4.3.1 Data Set 43
4.3.2 Evaluation Metric 44
4.3.3 Evaluation Description 46
4.3.4 Result and Discussion 48
5. RESULT AND DISCUSSION 49
5.1 Introduction 49
5.2 Result 49
5.2.1 Data Entry 49
5.2.2 Computational in Generating Chart 52
5.3 Discussion 58
5.4 Conclusion 59
REFERENCES 60
vi
LIST OF TABLE
TABLE TITLE PAGE
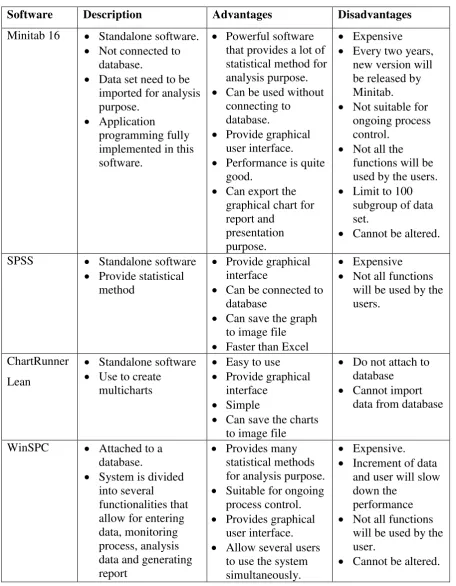
Table 2.1 Shows the summary of several types of statistical software 11
Table 2.2 Optimize application using stored procedure 22
Table 3.1 Sample of TaperedSpacer (ChartRunner sample data) 30
Table 3.2: Table in database descriptions 30
Table 3.3 Formula 36
Table 4.1 Example data set with subgroup size 4 44
Table 4.2 Example data set for Control Calculation (3 data values) 44
Table 4.3: Evaluation process for Data Entry module 46
Table 4.4 Evaluation description process for computation control chart
module
47
Table 5.1 Elapsed Time for processing data set 1 50
Table 5.2 Elapsed time for processing data set 2 50
Table 5.3 Elapsed time for processing data set 3 51
Table 5.4 Elapsed Time for processing 3 data 53
Table 5.5 Elapsed time for processing 10 data 53
Table 5.6 Elapsed time for processing 30 data 54
Table 5.7 Elapsed Time for processing 3 data 55
Table 5.8 Elapsed time for processing 10 data 56
vii
LIST OF FIGURES
FIGURE TITLE PAGE
Figure 1.1 Type of control charts 6
Figure 2.1 General structure of control chart 9
Figure 2.2 Interface of Minitab 16 12
Figure 2.3 WinSPC implementation proposed by DataNet Quality System 14
Figure 2.4 AFFINITY framework 19
Figure 2.5 SYMEX algorithm 20
Figure 2.6 iDBPQL support concurrency 21
Figure 3.1 Research Flow Summary 27
Figure 3.2 ER Diagram 31
Figure 3.3: Centralized database for prototype applications 32
Figure 3.4 Type of control charts 34
Figure 3.5 Concept of prototype application 34
Figure 3.6 Generating Control Chart 36
Figure 5.1 Elapsed time for data entry 52
Figure 5.2 Figure 5.2: Elapsed time for Xbar-R Chart 55
viii
LIST OF APPENDICES
APPENDIX TITLE PAGE
A1 Formula for Xbar-R 65
A2 Formula for Xbar-S 67
B Example of Modules 69
1 CHAPTER 1
INTRODUCTION
1.1 Background of study
Nowadays, products become more complex. Due to the complexness, data of each
product will be increased. The increase amount of data forces the manufacturer to
implement good strategies to control the production quality. A collection of techniques and
strategies are being implemented in manufacturing line and known as Statistical Process
Control (SPC). The SPC has been introduced by Dr. Walter during 1920s and adopted by
most of production lines today. The SPC is used to monitor and control the quality in the
production lines based on statistical analysis.
Currently, the technology evolves affect the way SPC is being implemented in the
production line. The automation system for SPC has been developed to replace the
traditional way of SPC. Today, SPC software can be divided into two categories. The first
category is SPC software for ongoing process and another category is SPC software for
post analysis. The increase amount of data for each product in assembly line such as
length, thickness, weight, and diameter affect the performance of the SPC software. Time
taken for processing the data becomes a critical issue.
Shorten time execution to generate an output can be a competitive advantage for
any area especially for manufacturing and production sector. One of statistical method in
SPC is control chart. The control chart is designed to identify abnormal patterns of
variability in a process. It detects changes in the process. Faster process in generating
2
in more efficient way. The faster process of generating the control chart also will help the
production and quality assurance team to identify any issue or problem in the production
floor. Shorten the process of generating the charts, analysis can be done in a faster way.
By using the SPC post analysis such as Minitab 16, much time is needed to
generate the charts and do the analysis based on the charts created.User must import the
data set from their database or file into the software. Then the user must follow certain
steps to generate the charts for analysis purpose.This software only processes certain
amount of data in a time. For example, it will only able to handle up to 100 subgroups of
data for creating control charts.
The SPC software for ongoing process control is more preferable for processing
large amount of data and allow the user to generate the control charts within a shorten
period of time. The software generate the control in real time, so the user will able to see
any changes on the charts using the monitoring feature that available in the software.
For example, in the production line of a pencil, the diameter and the length are
measured. In this situation, the control chart application system is used to control process
of production. The value of diameter and length will become the input of application.
From the data, the application will continue with the computation and generating the
output which is control chart. Analysis will be done based on the generated control chart.
Most of production sites prefer to have a real-time system to control their
operation. Using this system, it will help -them to improve the productivity, reduce costs,
and react quickly to the process changes and to make decision on the production floor.
Real time application that can directly connect to the database would be more effective for
monitoring and will reduce the time taken to generate the result. By having the real time
application, we can eliminate the process of importing the data into the application. In a
3
read, create, update and delete data. Therefore, it is important to improve the accessing
process of the data between the application and the database. This research proposes to use
database stored procedures in generating a control chart and thus can improve the
accessing process of data.
A stored procedure is a set of SQL command that can be executed by an
application. It has been compiled and stored in the database server (Shao, W. et. al., 2010).
There are several advantages of using the stored procedure. It can be called and executed
repeatedly by the application. By using the stored procedure with the application client,
only calling statement will be transferred rather than a number of SQL statement. This will
reduce the network traffic. The stored procedure also is pre-compiled before it has been
used. It is optimized and analysed when we execute the stored procedure for the first time.
Then, the final execution plan is given and stored in the system table. This will lead to
faster the execution process using the stored procedure (Shao, W. et. al., 2010).
1.2 Problem Statement
One of the advantages of using the stored procedure is to improve the performance
of the system and application. Previous research has found that a stored procedure
technology can be a method to optimize the system performance. Shao, W. et. al. (2010)
proposed the use of stored procedure in an Online Monitor System for Key Pollution
Sources. They applied the stored procedures in accessing data from the database. Bahua, T.
and Ling, Z. (2010) also applied the stored procedure technology in their Relational
Database System (RDBS) project which is Query Service System of Teaching Affairs as
the optimization method. However, the stored procedure has not widely applied especially
4
The statistical application is used for statistical analysis to ensure the service or
product quality. The complexity of a product leads to increase the amount of data in a
production line. Bicycle is taken as product in assembly line for an example. There are
many parts of the bicycle need to be measured for ensuring the quality of the bicycle such
as diameter of tyre, thickness of every component, length of paddle and weight of each
component.
When the statistical application encounter a large amount of data, the processing
time of the data for analysis purpose will increase. This scenario will lead to slower the
performance of the client application to produce the result. In order to overcome this issue,
the stored procedure technology is proposed in this project for statistical application. The
scope of this project is reduced to one of the statistical method in SPC which is the
variable control chart. By applying the stored procedure in computation, processing task
can be separated between the client application and the database server. Only the calling
statement will transfer on the network when the client application calls the store procedure
rather than a number of SQL statements.
1.3 Research Questions
There are three research questions will be answered in this project as below:-
- How the current method being implemented in statistical application?
- How stored procedures can be implemented in statistical application?
- Do stored procedures improve the process of computation instatistical
5 1.4 Research Objective
The purpose of this research is to investigate the effect of separating the task of
computational using database stored procedures towards the performance of application to
generate a control chart. Instead of doing all tasks at the application programming site, the
computational tasks are delegated to the database server by using stored procedures.
Below are the objectives of this research:-
1. To investigate the current methods of computational in statistical application.
2. To construct methods to dividing the computational tasks using database stored
procedures.
3. To evaluate the performance of developed methods over the current methods in
term of time execution.
1.5 Scope of Study and Limitation
The scope of study for this research can be divided into two parts which are
developing two different prototypes of real time control chart applications and analysis
process of the performance.
The first prototype is developed using application programming language and the
second prototype is developed using combination of stored procedure and application
6
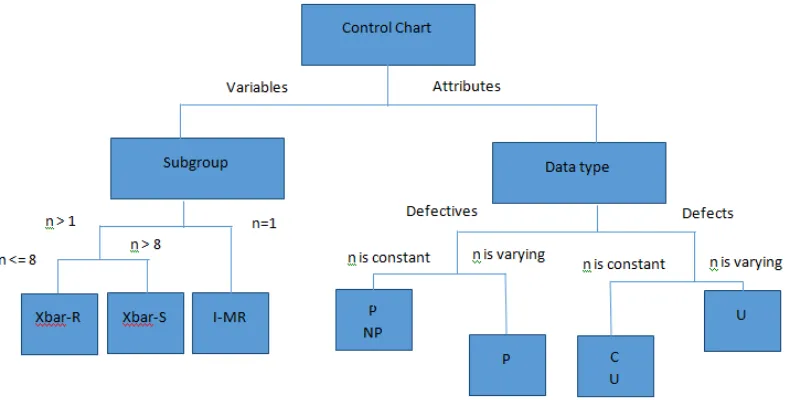
Figure 1.1: Type of control charts.
The control chart is divided into two which are variable control chart and attribute
control chart. The variable control chart is based on subgroup size of data set and the
attribute control chart is based on data type of data set.
For the variable control chart, if the subgroup size is one, the statistical analysis
will be based on Individual Move Range chart (I-MR). If the subgroup size is bigger than
one and less than nine, the statistical analysis will be based on Xbar Range chart (Xbar-R).
If the subgroup size if bigger than eight, the statistical analysis will be based on Xbar
Standard Deviation chart (Xbar-S).
For the attribute control chart, this type of chart is designed to monitor attribute
data that describe quality characteristic which is difficult to measure such as the absence of
a component in an assembly and the presence of any imperfections in a painted surface.
The attribute data is divided into two which are defectives and defects. For the defectives
data, if the subgroup size of data set is constant, the statistical analysis will based on either
7
For the defects attribute data, if the subgroup size is constant, the statistical analysis will be
based on either U chart or C chart. If the subgroup size is varying, the analysis will be
based on U chart.
The analysis process is focusing on evaluating the performance of the proposed
method which is by analysing the execution time of computational process in generating
the control chart. This research will compare the execution time for both prototype
applications.
1.6 Significant and Research Contribution
Instead of using the stored procedures for create, update and delete data in a
database to enhance the application performance, a new way of using the stored
procedures in statistical computational can be identified. Moreover, it can be lead to
8 CHAPTER 2
LITERATURE REVIEW
2.1 Introduction
The literature review consists of five parts which are control chart, statistical
software, stored procedure, current work and summary. In the first part which is Control
Chart, two categories of statistical application that used to generate the control chart have
been identified and will be discussed. Rather than that, the definition and functions of
control chart will be discussed too. The second part will discuss on current statistical
software that available in market. Then the characteristics and benefits of using stored
procedures in developing a system will be discussed in the next part. Next, the current
works that have implemented the stored procedure as the method to enhance the system
performance will be discussed. The last part of this chapter will summarize all parts that
have been discussed in this chapter.
2.2 SPC and Control Chart
Statistical Process Control (SPC) is a set of technique and strategies used to
monitor the ongoing process to ensure the quality. Control chart is a statistical approach
and a part of Statistical Process Control (SPC). It is used to ensure whether the process in a
production floor or manufacturing line is stable and in control or not. The control chart can
be used to control the ongoing process (Nakamura, N. et. al., 2011). It is used to monitor
9
fall within the upper control limit and lower control limit, the process is in control.
Otherwise, the process is out of control.
The control chart is a graphical plot to help identify abnormal patterns of variability
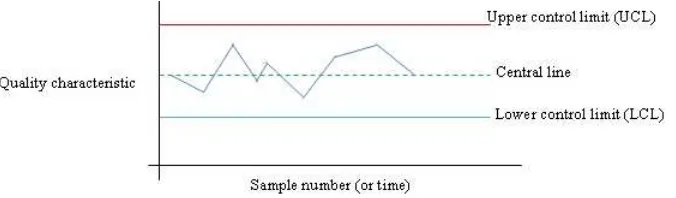
in a process. It is used to detect changes in the process over time (Minitab, 2010). Figure
2.1 shows the general structure of the control chart. The Upper Control Limit (UCL) is a
limit of maximum value for the set of data and the Lower Control Limit (LCL) is a limit of
minimum value for the set of data. The central line is the average value of the set of data.
Figure 2.1 : General structure of control chart
Amitava Mitra (2012) wrote in his book Fundamentals of Quality Control and
Improvement that control chart is a part of statistical process activities. The control chart is
a graphical tool for monitoring real time process. The control chart shows us the upper
control limit, central line and the lower control limit. It is useful to help management to set
their target and monitor ongoing process (Mitra, A., 2012). The control chart is used to
monitor time-ordered data for a particular quality characteristic, such as product color,
weight, or temperature. The used of the control chart will answer several questions in the
manufacturing line as below (Minitab, 2010):-
Is the process mean or variation shifting due to different lots of raw
10
Is monitor time-ordered data for a particular quality characteristic, such as
product color, weight, or temperature?
Is the variation between production runs or batches higher than expected?
The control chart can be generated manually. However, developing an application
to generate the control will benefit us in monitoring the ongoing process on a real time.
This will help us to produce the control chart, monitor the ongoing process and make a
decision in a faster way.
2.3 Statistical Software
Currently, there are two categories of statistical software that can generate the
control chart which are a real-time SPC and post-analysis software. Both have features that
related to the statistical method but are used in different environment. The post-analysis
software is used off-line and focuses on exploratory analyses such as experimental design
(DOE) techniques, multiple linear regressions, ANOVA, MANOVA, and other high-end
statistical studies. This type of software is typically used in office computer by engineers
and statisticians. It is standalone software and do not connected to the database. Minitab 16
is one of the examples of this software.
The real-time SPC software is focused on data collection and analysis on the
production floor or manufacturing line. The real-time SPC products are developed to be
used by operators for collecting data at the time of manufacture and making that data
instantly accessible across a company network. Most of the real-time products are allowed
to communicate with electronic gauges such as scales, micrometers, and coordinate
measurement machines. This type of software is focused on SPC analyses such as control
11
Table 2.1 shows the summary of several types of statistical softwares.
Software Description Advantages Disadvantages
12 2.3.1 Minitab 16
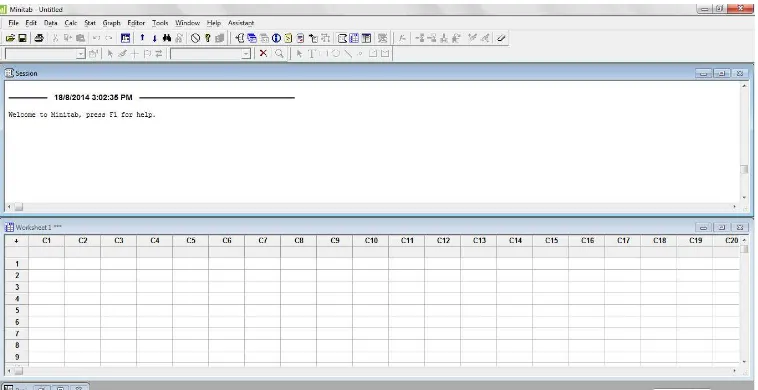
Minitab 16 is statistical software developed by Minitab Incorporation. This
is a powerful software for statistical analysis and very expensive. The price range
of this software is more than RM5000. There are several license types available for
this software. However, the most popular license types are single user and annual
multi user license.
Minitab 16 is a standalone application. Data will be imported manually to
generate control chart and analysis. The result (control chart generated) can be
exported to Microsoft PowerPoint or Microsoft Word as a report.
Figure 2.2: Interface of Minitab 16
Minitab 16 offers graphical user interface that allowed the user to use it in
an easy way. The performance of this software is quite good. It also allowed the
user to import data from the database server directly before the user can manipulate