Optimum MV Feeder Routing and Substation siting
and rating in Distribution Network
Ihsan Jabbar Hasan
Faculty of Electrical Engineering Universiti Teknikal Malaysia Melaka(UTeM) Melaka, Malaysia.
Mohd Ruddin Ab Ghani
Faculty of Electrical Engineering Universiti Teknikal Malaysia Melaka(UTeM) Melaka, Malaysia.
Chin Kim Gan
Faculty of Electrical Engineering Universiti Teknikal Malaysia Melaka
(UTeM) Melaka, Malaysia.
Abstract— A distribution network planning consists of several complexity aspects due to the multiple decision variables. The main objective of the distribution system planning is to find the optimum number of substation, location, size and feeders routing.This paper proposes an evolutionary algorithm to determine the optimum distribution substation placement and sizing by using the particle swarm optimization algorithm and optimum feeder routing using modified minimum spaning tree algorithm. The proposed algorithm evaluates on the distribution network case with 164 load blocks. The results showed the effectiveness of the proposed algorithm to find the acceptable location and sizing of distribution substations with a proper routing of the feeder.
Keywords— MV Feeder Routing, Distribution Substation placement, MST, PSO, OpenDSS.
I. INTRODUCTION
The electrical energy produced at the generating station is transferred to the consumers through transmission and distribution networks. Power generated by power plant and sent to the high-voltage transmission lines (765,500,400,220 or 132 KV). These transmission lines carry the power to medium voltage (e.g. 33 or 11 KV). The distribution networks supply power to consumers. The major objective of utility is to supply the power demand with good quality of service, through a proper planning for the distribution networks. Distribution planners are always be faced with several difficulties in designing due to the numbers of decision variables which are influenced to distribution networks. Feeder routing for MV and LV network and MV/LV substation placement and sizing are always one of the important challenges in distribution network planning. Meanwhile, it is crucial to reconfigure the existing distribution network due to the high load density and incremental cost of power distribution equipment and significant power losses in LV network which is 50% of the total losses of power system.
Serveral works has been carried out in field of distribution system planning. The first step in distribution system planning is to determine the location of distribution transformers. In [1] the authors codified the coordinates of the candidate substations and applied an evolutionary computation by using genetic algorithms to find the optimal location. Since the placement of the transformers will somehow define the route of feeders, some researchers have tried to proceed both
optimizations simultaneously. Some papers have applied the concept of minimum spanning tree to get an approximation of the initial work, as an indication of the optimal network layout electrical or geographical constraints are not take into consideration [2], [3]. Minimum Spanning Tree (MST) is a weighted connected graph whose total edge cost is minimized. Heuristic methods integrated in [4] to obtain the optimal feeder route (based on shortest path algorithm) and the optimal placement of substation on criteria of minimum losses. In reference [5] an attempt to minimize the cost of feeders by selecting the optimal conductor size and kind of feeders segment. The paper implemented a new computer algorithm and heuristic optimization technique.
In this paper [6] A comprehensive algorithm is developed to obtain optimal location, number and service area of substation using genetic algorithm and a generalized algorithm is modified for optimal feeder route on minimum total cost criteria. Power flow problem is one of the important issues of distribution network planning due to the large of the network. Therefore, this work has tried to use OpenDSS engine as power flow calculator in distribution network planning in order to determine the voltages, currents, real and reactive power flows and losses of the network during optimization procedures.
This paper presents the application of an efficient Particle Swarm Optimization (PSO) algorithm for the optimal design distribution system, solving the optimal placement and sizing of substation, also MST algorithm used for optimal feeder routing in MV networks. The total cost minimization is the objective function of proposed optimization algorithm. The objective function consists of the fixed and variable costs of substations and annualized cost of the total network losses.
II. PARTICLE SWARM OPTIMIZATION
The Particle Swarm Optimization has shown to be an efficient, robust and simple optimization and is one of the evolutionary computation techniques which has introduced to solve the optimization issues and since then, their efficiency to be applied in optimization problems has been explained in reference [7]. In this technique, the movement towards the optimal position is gained from the best information of each particle which is included in the initial population (Best Personal Position) and the optimal position that is found by
the neighbor’s positions (Best Global Position).
non-linear engineering problem, especially in planning of distribution system, control applications, multi-objective optimization problems with multiple constraints, design application and etc. [8]. Since the capacitor installation in distribution system has the non-linear and discrete equation, therefore, this work used PSO algorithm as one of the efficient techniques to resolve the substation location and sizing problem. The steps of this algorithm have been described in [9], [10]. Fig. 1 shows the particle movements based on PSO algorithm.
Best Personal Position Previous
Position
Current Position
Best Global Position Next Position
Fig. 1. Principle of the PSO particle movement
II. OPENDSS
The power flow solutions are needed in planning of distribution network to evaluate the network. To get this purpose, the Open Distribution System Simulator (OpenDSS) is a comprehensive electrical system simulation tool for electric utility distribution systems. The OpenDSS is an open source developed by the Electric Power Research Institute [11]. The OpenDSS engine comprise the COM interface which can be used in other simulation programs such as MATLAB, VBA, C# and etc. The OpenDSS engine can assist the researchers to get a set of important knowledge about the simulated power system. In this paper, OpenDSS engine is used as a power flow calculator so as to determine the power system parameters such voltages, currents, real and reactive power flows and losses of the network during optimization procedures.
III. METHODOLOGY
Based on the new prospect of distribution networks planning which is aim to bring the small scale of substation beside the load centers so as to minimize the distribution network losses, this paper has tried to introduce the initial adjustments of the algorithm based on this purpose. Therefore, the minimum numbers of distribution substations are estimated based on the maximum branching rate and number of load block (load centers) for each branches. These are the constraints of the minimum substation selection. In this paper,
three branching rate and maximum 10 load blocks has been selected for each substation. Which means; minimum Sn substations are need for a network with n branches and m numbers of load blocks for each branch, which Sn can be written as follows:
n
m
N
nS
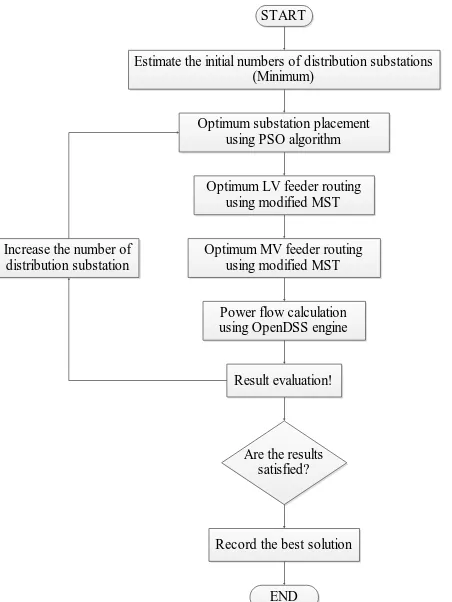
(1)where, N is the numbers of the load blocks. Therefore, the estimation of minimum required substation can be consider as a first step of optimization algorithm that shown in Fig. 2.
START
Estimate the initial numbers of distribution substations (Minimum)
Optimum substation placement using PSO algorithm
Optimum LV feeder routing using modified MST
Optimum MV feeder routing using modified MST
Power flow calculation using OpenDSS engine
Result evaluation!
Are the results satisfied?
Record the best solution
END Increase the number of
distribution substation
Fig. 2. The proposed flow chart of optimum substation placement and sizing and feeder routing for distribution networks
designing the network to run the power flow and capturing the required information for network evaluation. The obtained results will be evaluated in the next step. The algorithm will record the captured solution, if the results have satisfied in terms of substation placement standards, desire losses and in range voltage profile. If not, the algorithm will repeat once more time by increasing the number of distribution substation. This loop will continue to get the best possible solution to the substation location, routing and sizing whenever find the optimum network designing.
A. Optimum Substation Placement Using PSO:
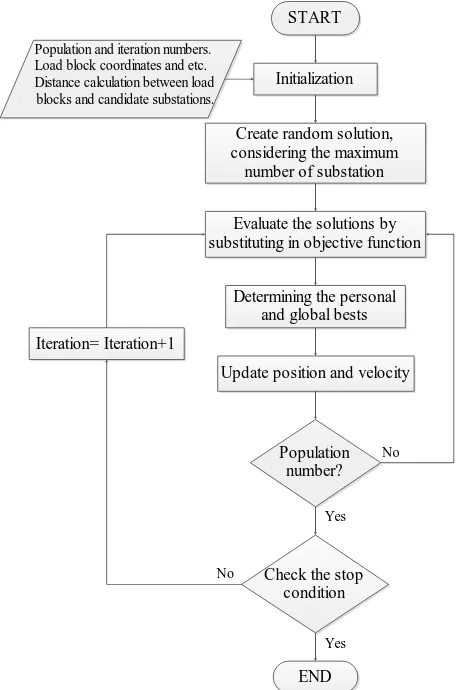
An adequate placement of distribution substation can be affected the other parts of network such as primary/secondary substations and feeders routing. In other word, if the placement of substation is not done with appropriate precision, the economic and technical difficulties will be encountered to MV feeders and other parts of the distribution networks. Therefore, define the suitable location of distribution substations is decisive. In this paper a comprehensive algorithm for substation placement and defining the number of distribution substation has been applied. The Particle Swarm Optimization (PSO) method is applied to optimize the best reasonable location of distribution substations. The only substation placement problem has considered in this section. Fig. 4 illustrates the PSO algorithm flowchart in terms of optimum distribution substation placement. Fig. 3 shows the numbers of selected distribution substations after optimization. Nine numbers of distribution substations have been selected among the 81 candidate substations. Meanwhile, this figure indicates the numbers of load blocks which assigned to their particular substation.
30 40 50 60 70 80
40 45 50 55 60 65 70 75
X [km]
Y
[
km
]
Fig. 3. Selected MV substations after optimization
START
Initialization
Create random solution, considering the maximum
number of substation
Evaluate the solutions by substituting in objective function
Determining the personal and global bests
Update position and velocity
Population number?
Check the stop condition
END
Population and iteration numbers. Load block coordinates and etc. Distance calculation between load
` blocks and candidate substations.
Iteration= Iteration+1
Yes
Yes No
No
Fig. 4. The optimum substation placement flowchart using PSO
B. Optimum Feeder Routing Using MST
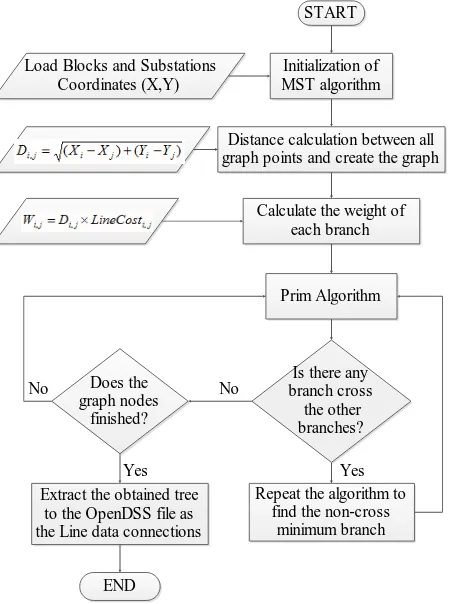
As described in the introduction the prim’s algorithm has been used in this paper to locate the paths of optimum feeders for distribution networks. But the only prim’s algorithm cannot perform our desire optimal routing. The modified prim algorithm needs to be implemented because of some technical requirement such as, open loop feeders and not allowed branches pass through each other.
Fig. 5 shows the proposed modified algorithm using the
prim’s algorithm in MST so as to locate the optimum feeder
routing in the distribution network.
START
Initialization of MST algorithm
Distance calculation between all graph points and create the graph
Calculate the weight of each branch
Prim Algorithm
Is there any branch cross
the other branches?
Extract the obtained tree to the OpenDSS file as the Line data connections
END
Repeat the algorithm to find the non-cross
minimum branch Load Blocks and Substations
Coordinates (X,Y) Does the graph nodes finished? Yes Yes No No
Fig. 5. The flowchart of modified MST algorithm in order to solve the optimum feeder routing in distribution network
30 40 50 60 70 80
40 45 50 55 60 65 70 75 2 32 61 64 67 70 77 79 89 92 93 112 117 152 156 161 22 34 42 55 66 75 78 86 109 116 132 138 144 154 5 12 20 39 58 59 73 76 83 8788 90 94 101 113 115 129 139 151 1 9 27 28 29 49 56 72 97 100 102105 126 128 131 137 157 7 11 15 1617 19 24 30 31 44 47 48 69 71 74 91 99 111 119 125 140 149 160 163 6 8 10 26 40 46 51 52 54 82 106 110 121 122 123 130 133 146 147 150 153 4 25 33 35 37 43 45 50 63 68 80 84 8598 108 114 120 124 127 134141 145 3 18 36 38 53 57 62 95 104 118 136 142 159 162 13 14 21 23 41 60 65 81 96 103 107 135 143 148 155 158 164 X [km] Y [ km ]
Fig. 6. Obtained network after optimum feeder routing for MV in 164 load blocks distribution network
IV. PROBLEMFORMULATION
In distribution system planning, the distribution of loads density and allocation of feasible candidate substations are the important information in the study year. Based on optimization viewpoint, the following candidates must be satisfied so as to optimal distribution substation allocation and feeder routing, which are: a) supplying all the load blocks of the networks, b)
accepted voltage drop at the receiving bus, c) Maximum load capacity of all substation, and d) Minimization cost of new substation construction. As, the objective functions of substation placement and sizing can be formulated as follows:
nlb i i Loss LP
C
CL
18760
.
.
(2)where CL is the total losses cost for a study year, CL [$/kWh] is the cost of real power losses which is provided in [12]
(CL= 168 $/kW/year]),
i Loss
P
[kW] is the real power losses at load block i and nlb is the number of load blocks.The investment cost of distribution substations have to be annuitized to able for accumulate with other network costs [13]. Thus, to annuitize the investment cost of distribution network, the considerations have to be implemented.
nlb i lb ns jS
C
j
d
j
i
VC
1 1
var
(
)
.
(
,
)
(3)
ns jfix
S
C
j
FC
1)
(
(4)S S
S
VC
FC
C
(5)where VCs is the total substation variable cost, Cvar(j) is the cost of substation j per MVA, dlb(j,i)is the load block demand i which connected to substation j. FCs represents the total fixed cost of substations and Cfix(j) is the fixed cost of substation j. The variable cost of substation included the cost of operation and maintenance, and the fixed cost consists of installation and other related fix cost of substation such as land and equipment prices and etc.
ns j l j SC
C
IC
1*
(6)1
)
1
(
)
1
(
*
T Td
d
d
IC
CC
(7)where IC stand for Investment Cost [$], CS is the total substation installation and operation costs [$], Cl is the total cost of the lines [$], CC is the annuitized capital cost [$/year], d is the discount rate and T is the number of operation years.
Thus, the main objective function that needs to be minimized can be written as follows:
Min
Z
CL
CC
PF
(8)05
.
1
95
.
0
V
i
(9)The next constraint of distribution network planning is the longest distance of each load block from the distribution substation which introduced by substation radius based on maximum voltage drops in distance which has been obtained from reference [14]. To consider this constraint the following condition must be considered:
j i j
R
D
max (10)where i j
D is stand for distance between substation j to load
block i and Rj
max is the maximum acceptable radius of
substation j that can supply the load blocks (11/0.4 transformer). Based on the standard, in 11kV feeders in generally up to 3km and for rural networks is up to 20km.
V. RESULTSANDDISCUSSION
A generated model of distribution networks with details in APPENDIX has been used so as shown the efficiency of the proposed algorithms of substation placement and sizing in distribution network and feeder routing in MV. The candidate MV substations are generated randomly based on load density, which after optimum placement, nine numbers of substation have selected as shown in Fig. 3 3. The optimization progressive is illustrated in Error! Reference source not
found. for selecting the number of required substations with
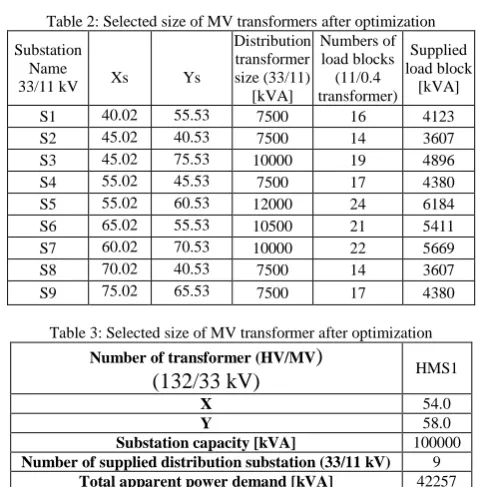
considering the acceptable voltage drop and minimum losses of networks. Table 2 indicates the selected the distribution substation placement and transformers sizes after optimization. The voltage drop based on distance for all distribution substations and 164 load blocks are shown in Fig. 7. It indicates all the buses allocated within the standard range of voltage drop which stated in previous sections. A HV/MV substation is placed at the fix position that was shown in Fig. 6 and the selected substation size is shown in
Substation Name
33/11 kV Xs Ys
Distribution transformer size (33/11)
[kVA]
Numbers of load blocks (11/0.4 transformer)
Supplied load block
[kVA]
S1 40.02 55.53 7500 16 4123
S2 45.02 40.53 7500 14 3607
S3 45.02 75.53 10000 19 4896
S4 55.02 45.53 7500 17 4380
S5 55.02 60.53 12000 24 6184
S6 65.02 55.53 10500 21 5411
S7 60.02 70.53 10000 22 5669
S8 70.02 40.53 7500 14 3607
S9 75.02 65.53 7500 17 4380
Table 3. To select the size of substation sizing has been tried
to follow the standard of distribution transformer by IEEE/ANSI C57.12.00 [15].
Fig. 7. The distance voltage drop from substations to load blocks
TABLE 1: The PSO progress in different number of substations Number of
transformer (33/11 kV)
Minimum Voltage
[p.u]
Total Losses [kW]
Best Cost [$/year]
5 0.87064 1795.9265 1595427
6 0.88847 1781.0730 1807879
7 090635 1138.7664 2022740
8 0.92004 1303.9305 2236497
9 0.95748 881.0599 2455879
Table 2: Selected size of MV transformers after optimization
Substation Name
33/11 kV Xs Ys
Distribution transformer size (33/11)
[kVA]
Numbers of load blocks (11/0.4 transformer)
Supplied load block
[kVA]
S1 40.02 55.53 7500 16 4123
S2 45.02 40.53 7500 14 3607
S3 45.02 75.53 10000 19 4896
S4 55.02 45.53 7500 17 4380
S5 55.02 60.53 12000 24 6184
S6 65.02 55.53 10500 21 5411
S7 60.02 70.53 10000 22 5669
S8 70.02 40.53 7500 14 3607
S9 75.02 65.53 7500 17 4380
Table 3: Selected size of MV transformer after optimization
Number of transformer (HV/MV
)
(132/33 kV)
HMS1X 54.0
Y 58.0
Substation capacity [kVA] 100000
Number of supplied distribution substation (33/11 kV) 9
Total apparent power demand [kVA] 42257
VI. CONCLUSION
feeder routing. The proposed algorithm evaluates on the distribution network case with164 load blocks. The results show the proposed algorithm has successfully find the suitable placement and sizing of distributed generation with adequate feeder routing.
ACKNOWLEDGEMENT
The authors would like to gratefully acknowledge the funding support provided by the Ministry of Higher Education Malaysia under the research grant NO. MTUN/2012/UTEM-FKE/7 M00015.
REFERENCES
[1] E. Miguez, E. Diaz-Dorado, and J. Cidras, “An application of an
evolution strategy in power distribution system planning,” in
Evolutionary Computation Proceedings, 1998. IEEE World Congress on Computational Intelligence., The 1998 IEEE International Conference on, 1998, pp. 241–246.
[2] S. Najafi, S. H. Hosseinian, M. Abedi, A. Vahidnia, and S.
Abachezadeh, “A framework for optimal planning in large distribution
networks,” Power Syst. IEEE Trans., vol. 24, no. 2, pp. 1019–1028,
2009.
[3] G. Jimenez-Estevez, L. S. Vargas, and R. Palma-Behnke, “An evolutionary approach for the greenfield planning problem in
distribution networks,” in Neural Networks, 2007. IJCNN 2007.
International Joint Conference on, 2007, pp. 1744–1749.
[4] R. Ranjan, B. Venkatesh, and D. Das, “A new algorithm for power
distribution system planning,” Electr. Power Syst. Res., vol. 62, no. 1,
pp. 55–65, 2002.
[5] S. J. Islam and M. R. A. Ghani, “Economical optimization of conductor
selection in planning radial distribution networks,” in Transmission and
Distribution Conference, 1999 IEEE, 1999, vol. 2, pp. 858–863.
[6] B. M. Kalesar and A. R. Seifi, “Optimal substation placement and feeder
routing in distribution system planning using genetic algorithm,” Elixir
Int. J. Electr. Enggineering, pp. 3908–3915, 2011.
[7] J. Kennedy, “Particle swarm optimization,” in Encyclopedia of Machine
Learning, Springer, 2010, pp. 760–766.
[8] S. A. Taher, A. Karimian, and M. Hasani, “A new method for optimal location and sizing of capacitors in distorted distribution networks using
PSO algorithm,” Simul. Model. Pract. Theory, vol. 19, no. 2, pp. 662–
672, Feb. 2011.
[9] M. Shamshiri, C. K. Gan, K. Jusoff, I. J. Hasan, M. Ruddin, M. Yusoff,
E. Engineering, M. Utem, H. T. Jaya, D. Tunggal, and T. Jaya, “Using
Particle Swarm Optimization Algorithm in the Distribution System
Planning,” Aust. J. Basic Appl. Sci., vol. 7, no. 3, pp. 85–92, 2013.
[10] J. I. Hassan, C. k. Gan, M. Shamshiri, B. B. Isamdi, and G. A. M.
Ruddin, “Losses Reduction and Voltage Improvement Using Optimum Capacitor Allocation by PSO in Power Distribution Networks.,”
Intrnational Reveiw Model. Simul., vol. 6, no. August, pp. 1219–1226, 2013.
[11] R. Dugan, “OpenDSS Introductory Training Level 1 Introduction,” 2009.
[12] A. Eajal and M. El-Hawary, “Optimal capacitor placement and sizing in
distorted radial distribution systems part III: Numerical results,” 4th Int.
Conf. Harmon. Qual. Power, pp. 1 – 8, 2010.
[13] C. K. Gan, P. Mancarella, D. Pudjianto, and G. Strbac, “Statistical
appraisal of economic design strategies of LV distribution networks,”
Electr. Power Syst. Res., vol. 81, no. 7, pp. 1363–1372, Jul. 2011. [14] T. C. Yu, Principles and design of low voltage systems. Singapore: Byte
Power Publications, 1996.
[15] T. Committee, I. Power, and E. Society, IEEE Standard for Standard General Requirements for Liquid-Immersed Distribution , Power , and Regulating Transformers, vol. 2006, no. February. 2007.
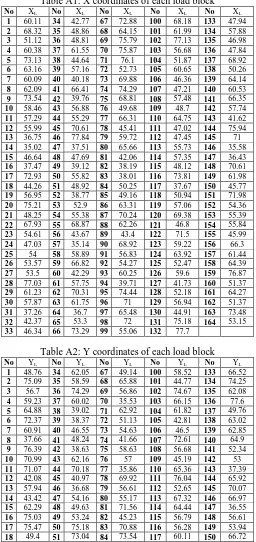
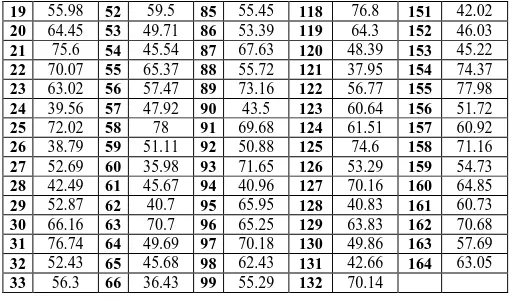
APPENDIX
The initial assumptions of the utilized distribution network model are as, 81 MV candidate substations and 164 load blocks. Tables A1 and A2 show the X and Y coordinates of the test network and Table A3 illustrates the load block demand which is considered for all the load blocks as same value.
Table A1: X coordinates of each load block No XL No XL No XL No XL No XL
1 60.11 34 42.77 67 72.88 100 68.18 133 47.94
2 68.32 35 48.86 68 64.15 101 61.99 134 57.88
3 51.12 36 48.81 69 75.79 102 77.13 135 46.98
4 60.38 37 61.55 70 75.87 103 56.68 136 47.84
5 73.13 38 44.64 71 76.1 104 51.87 137 68.92
6 63.16 39 57.16 72 52.73 105 60.65 138 50.26
7 60.09 40 40.18 73 69.88 106 46.36 139 64.14
8 62.09 41 66.41 74 74.29 107 47.21 140 60.53
9 73.54 42 39.76 75 68.81 108 57.48 141 66.35
10 58.46 43 56.88 76 49.68 109 48.7 142 57.74
11 57.29 44 55.29 77 66.31 110 64.75 143 41.62
12 55.99 45 70.61 78 45.41 111 47.02 144 75.94
13 36.75 46 77.84 79 59.72 112 47.45 145 71
14 35.02 47 37.51 80 65.66 113 55.73 146 35.58
15 46.64 48 47.69 81 42.06 114 57.35 147 36.43
16 37.47 49 39.12 82 38.19 115 48.12 148 70.61
17 72.93 50 55.82 83 38.01 116 73.81 149 61.98
18 44.26 51 48.92 84 50.25 117 37.67 150 45.77
19 56.95 52 38.77 85 49.16 118 50.94 151 71.98
20 75.21 53 52.9 86 63.31 119 57.06 152 54.36
21 48.25 54 55.38 87 70.24 120 69.38 153 55.39
22 67.93 55 68.87 88 62.26 121 46.8 154 55.84
23 54.61 56 43.67 89 43.4 122 71.5 155 45.99
24 47.03 57 35.14 90 68.92 123 59.22 156 66.3
25 54 58 58.89 91 56.83 124 63.92 157 61.44
26 53.57 59 66.82 92 54.27 125 52.47 158 64.39
27 53.5 60 42.29 93 60.25 126 59.6 159 76.87
28 77.03 61 57.75 94 39.71 127 41.73 160 51.37
29 61.23 62 70.31 95 74.44 128 52.18 161 64.27
30 57.87 63 61.75 96 71 129 56.94 162 51.37
31 37.26 64 36.7 97 65.48 130 44.91 163 73.48
32 42.37 65 53.3 98 72 131 75.18 164 53.15
33 46.34 66 73.29 99 55.06 132 77.7
Table A2: Y coordinates of each load block No YL No YL No YL No YL No YL
1 48.76 34 62.05 67 49.14 100 58.52 133 66.52
2 75.09 35 58.59 68 65.88 101 44.77 134 74.25
3 56.7 36 74.29 69 56.86 102 74.67 135 62.08
4 59.23 37 60.02 70 35.53 103 66.15 136 77.6
5 64.88 38 39.02 71 62.92 104 61.82 137 49.76
6 72.37 39 38.37 72 51.13 105 42.81 138 63.02
7 60.91 40 46.55 73 54.63 106 46.5 139 62.85
8 37.66 41 48.24 74 41.66 107 72.61 140 64.9
9 76.39 42 38.63 75 58.63 108 56.68 141 52.34
10 70.99 43 62.16 76 57 109 45.19 142 53
11 71.07 44 70.18 77 35.86 110 65.36 143 37.39
12 42.08 45 40.97 78 69.92 111 76.04 144 65.92
13 57.94 46 36.68 79 56.61 112 52.65 145 70.07
14 43.42 47 54.16 80 55.17 113 67.32 146 66.97
15 62.29 48 49.63 81 71.56 114 64.44 147 36.55
16 75.03 49 53.24 82 45.23 115 56.79 148 56.61
17 75.47 50 75.18 83 70.88 116 56.28 149 53.94
19 55.98 52 59.5 85 55.45 118 76.8 151 42.02
20 64.45 53 49.71 86 53.39 119 64.3 152 46.03
21 75.6 54 45.54 87 67.63 120 48.39 153 45.22
22 70.07 55 65.37 88 55.72 121 37.95 154 74.37
23 63.02 56 57.47 89 73.16 122 56.77 155 77.98
24 39.56 57 47.92 90 43.5 123 60.64 156 51.72
25 72.02 58 78 91 69.68 124 61.51 157 60.92
26 38.79 59 51.11 92 50.88 125 74.6 158 71.16
27 52.69 60 35.98 93 71.65 126 53.29 159 54.73
28 42.49 61 45.67 94 40.96 127 70.16 160 64.85
29 52.87 62 40.7 95 65.95 128 40.83 161 60.73
30 66.16 63 70.7 96 65.25 129 63.83 162 70.68
31 76.74 64 49.69 97 70.18 130 49.86 163 57.69
32 52.43 65 45.68 98 62.43 131 42.66 164 63.05
33 56.3 66 36.43 99 55.29 132 70.14
Table A3: Load Block Demand Data