FINANCIAL LEVERAGE AND ITS EFFECT ON
RETURN ON EQUITY (ROE) AND EARNINGS PER SHARE (EPS) (An Empirical Analysis of Mining Industry Listed in Indonesia Stock Exchange)
By Andal Pradipta
604081000002
ヲIゥエ」イゥョセN@
<11>ri
Tgl. 1'o. lnduk
セ@ · ,ffikasi
; .. エエャエエLNャヲhAャャイセGGGGGサッオオG@
: .J..l .. ;;.,, ..
ーNセLセゥᄋᄋセャᄋᄋᄋᄋ@
...
: Q.J,_.'1),,. .. QJ.;;> ...._..K.;:Q ...
.'.2 .. -INTERNATIONAL PROGRAMMANAGEMENT MAJOR
FACULTY OF ECONOMICS AND SOCIAL SCIENCES STATE ISLAMIC UNIVERSITY SY ARIF HIDAYATULLAH
JAKARTA
PEHPUST!\KAt.\N tH/\MA
UIN S'(_:J,_i1_;;J Nj⦅ᄋ|ゥMMMLjZNNfセ@ f_:}\
FINANCIAL LEVERAGE AND ITS EFFECT ON
RETURN ON EQUITY (ROE) AND EARNINGS PER SHARE (EPS) (An Empirical Analysis of Mining Industry Listed in Indonesia Stock Exchange)
Thesis
Submitted to Faculty of Economics and Social Sciences
To Meet the Requirements in Achieving Degree of Bachelor of Economics
By
f\ndal Pradipta
604081000002
Under Supervision of Academic Supervisor I
Pro[ Dr. Ahmad Rodoni, MM NIP. 150 3 I 7 955
イキイBBᄚBOGセュゥGセ@
/
セ_Mj@
---
-·-Prof. Dr. Azzam Jasin, MBA
MANAGEMENT MAJOR
Academic Supervisor II
Dr. Rofikoh Rokhim
We have administered comprehensive examination to i\ndal Pradipta student
If) 604081000002 on Wednesday. 6 August 2008 with the title
"FlNANCIAL LEVERAGE AND ITS EFFECT ON RETURN ON EQUITY AND li:ARNINGS PER SHARE (AN セセmpirical@ ANALYS1S OF MINING INDUSTRY LISTED IN ll'ilOONESIA STOCK EXCHANGE)". After proper examination of the student.
we
decided that this thesis is accepted as partial requirements for the title of Bachelor of Economics on the field of Management, State Islamic University SyarifH idayatul lah Jakarta.
Ciputat, 6 August 2008
Comprehensive Examination Team
Prof. Dr. Abdul Hamid, MS Deputy Dean
Biography Abstract Abstrak Preface
CONTENTS
CHAPTER I. INTRODUCTION A. Background
B. Problem Identification C. Purpose and Significance
CHAPTER II. LITERATURE REVIEW A. Company Sources of Fund B. Financial Leverage
c.
LiquidityD. Return on Equity E. Earnings per Share
F. Previous Research G. Theoretical Framework H. Consideration Framework
Page
11
12
14 16
19
22
25
27
28
CHAPTER III. RESEARCH METHODOLOGY A. Research Scope
B. Sampling Method C. Data Collection Method D. Analysis Method
E. Research Variable Operational
CHAPTER IV. FINDINGS AND ANALYSIS
A. General View on Research Object B. Findings and Analysis
CHAPTER V. CONCLUSION A. Conclusion B. Implication
REFERENCES
APPENDIX
30 31 32 33
40
44
60
76 77
List of Tables
Page
Table 1.1 Company's Debt and Debt to Equity Ratio 7
Table 2.2 List of Previous Research 27
[image:6.519.33.439.146.516.2]List of Figures
Page
Figure 1.1 ROE Change Sensitivity upon EBIT Change 8
Figure 1.2 Directional Factor of Return on Equity Line 9
Figure 2.3 Corporation's Capital Scheme Philosophical Framework 28
Figure 2.4 Return on Equity 29
Figure 2.5 Earnings per Share 29
Figure 4.6 Elnusa 44
Figure 4.7 Aneka Tambang 46
Figure 4.8 Petrosea 47
Figure 4.9 International Nickel Indonesia 49
Figure 4.10 Radiant Utama Interinsco 50
Figure 4.11 Ti mah 53
Figure 4.12 Central Korporindo Internasional 56
[image:7.519.37.442.107.615.2]I. PERSONAL IDENTITY
1. Name
2. Place and date of birth 3. Address
4. Phone 5. Email
II. EDUCATION
I. Elementary school 2. Junior high school 3. Senior high school
BIOGRAPHY
: Anda! Pradipta
: Jakarta, February 17, 1987
: JI. Karya Pemuda No.9 Beji Timur, Depok : 0818998628
: SD Baiturrahmah Padang : SMPN 2 Padang
: SMA Pribadi Depok
III. ORGANIZATIONAL EXPERIENCE
1. Jakarta Debating Competition committee
2. Organizing committee on MoU between Intel and UIN
IV. FAMILY BACKGROUND
1. Father
2. Place and date of birth 3. Address
4. Phone
5. Mother
6. Place and date of birth 7. Address
8. Phone
: Riya:ntoko
: Sragen, August 2, 1955
: JI. Karya Pemuda No.9 Beji Timur, Depok : 08121033941
: S. Neni Budi Ratni
: Yogyakarta, Febrnary 17, 1960
ABSTRACT
This study is an empirical work that investigates the effect of a firm's leverage
on returns and earnings. Writer undertakes the tests based on the explicit valuation
model of some researcher and tested in the mining industry in Indonesia. This is
consistent with the findings of Modigliani and Miller (1958). Results are robust to
other factors.
Using several measures for debt capacity, writer finds that the negative effect
is stronger for firms with limited debt capacity. Moreover, firms with an increase in
leverage ratio tend to have less futme investment, controlling for the potential
negative effect of growth option on leverage ratio.
These findings are consistent with a dynamic view of the pecking-order theory
that an increase in leverage reduces finns' safe debt capacity and may lead to future
underinvestment. Writer finds that the observed patterns are stronger for changes in
the long-term debt than that in the short-term debt and remain significant among
financially healthy firms.
Further, while leverage seems to be working well for few
cヲセエ・ァッイゥ・ウ@of
companies, it is affecting some others negatively. Companies that are moderately
geared i.e. in the range of gearing ratio of 50 percent to 85 percent have been able to
generate a good ROE. In a nutshell, it is the management who take the lead and
responsible for the usage of company's external somce of fund to leverage their
company as to maximize the practice.
ABSTRAK
Penelitian ini adalah studi empiris yang menyelidiki efek dari hutang perusaharu1 terhadap pengembalian modal dan pendapatan. Penulis menjalankan tes berdasarkan model penghitungan dari beberapa peneliti yang selanjutnya di tes pada industri pertambangan di Indonesia. Ini konsisten dengan penemuan dari Modigliru1i dan Miller (1958). Hasilnya adalah bagus terhadap faktor-faktor lain.
Menggunakan beberapa pengukuran untuk hutang, penulis menemukan bahwa perusahaan dengan kapasitas hutang yang terbatas mempunyai efek negatif yang lebih kuat. Selebihnya, perusahaan dengan peningkatan dalam rasio hutang cenderung untuk memiliki investasi masa depan yang lebih kecil, mengendalikan pertumbuhru1 yang potensial terhadap efek negatif pada rasio huta11g.
Penemuan ini konsisten denga11 pru1da11gan dinamis dari teori pecking-order
yang menyatakan bahwa peningkata11 hutang menurunkan kapasitas aman huta11g dari perusahaa11 itu dru1 dapat berujtmg pada investasi yru1g kecil pada masa depan. Penulis menemukan bahwa pola yang diteliti lebih kuat untuk perubahan pada huta11g jangka pru1jang daripada lrntang jangka pendek dan tetap signifikan diantru·a perusahaan denga11 finansial yang sehat.
Lebih jauh lagi, ketika hutang bekerja dengan baik untuk beberapa perusahaan, temyata hutru1g memberika11 efek negatif pada perusahaa11 lain. Perusahaan denga11 rasio hutang yang moderat yang berada dalrun rasio a11tara 50% dan 85% bisa menghasilkan pengembalian modal yffi1g baik. Selanjutnya, adalah ma11ajemen perusahaan yang memimpin dan bertanggung jawab terhadap penggunaan dana ekstemal untuk operasional perusahaa11 dan memaksimalkarmya.
PREFACE
In the name of Allah SWT, writer would like to say thank you for the completion of this paper with the title "Financial Leverage and its Effect on Return on Equity and Earnings per Share". This paper is a framework that aims to shed some light on the financial structure of mining industry and further analyzes the impact of leverage on it. The writer would like to say thank you to the following that have given their support in making this paper possible:
1. My beloved parents for their great support and endless courage to help me finishing this paper.
2. Dean Faculty of Economics and Social Sciences Drs. Faisal Badroen, MBA.
3. Academic supervisor I Prof. Dr. Ahmad Rodoni, MM and academic supervisor II Dr. Rofikoh Rokhim for their extremely helpful assistance along with the consent to finish this paper.
4. Bisnis Indonesia for providing data to meet my data requirement for my thesis.
6. All the staff in International Program office for handling the required document especially Mrs. Fitri, and Mr. Syamsudin.
7. My tennis mates Bono, Sofyan, Rama; you guys rock.
8. Asus WSF for limitless contribution; my dependent partner; hail on you.
9. My handy 2 gigabyte HP thumb drive for maximum mobile data transfer.
l 0. Bignet for internet connection 111 KP9 to let me connect to virtual
world along with surfing for international journals.
11. Canadian corner in main library for providing cozy place to write this paper.
12. The legendarily powerful yet efficient l ZZ-FE for making me conveniently move from one place to another.
13. 'Attack' package to power up my energy to run the day; 3 packages at a time is considered normal.
A. Background
CHAPTER I
INTRODUCTION
Facing an open competition in the globalization age is one of the toughest tasks for either state own enterprise or private company. Corporations are highly obliged to offer excellent products or services throughout the competition. Consumer will have more variety of choices to products or services available in the market. Subsequently, it is just the matter of time to survive in the competition; consumer will judge which product is the best. Along with increasing market share, all firms aim to expand their operation.
At the same time, corporation is trying its best to create value added, which is at the end will attract investors to put and invest their money in it. From many indicators for investor, some of them are return on equity (ROE) and earnings per share (EPS) of that particular corporation (Sunarto, 2001). Investors are looking for the best performance stock, which is represented by constantly increasing price or at least maintain its price at the particular range. That point, later, indicates the profitability, as well as its return and earnings. By doing so, they will be able to draw large amount of capital to develop their size in terms of market share.
Information needed by investors in capital market is not only fundamentally precise, but also technically defined (Sunarto, 2001 ). Fundamental inf01mation is internally derived while technical information is acquired externally, such as economy, politic, finance, and other factors. Information obtained internally is usually taking form in financial report. Fundamental and technical information can be used as a basis for investor to predict return, risk, amount, time, and other factors related to activity in cap ital market.
operationally as the standard deviation or beta (Keown, 2005:190). The practice of corporate risk management has changed dramatically over the past two decades. Originally, risk management was implemented on an uncoordinated basis across different units of the firm. The primary focus of these ad hoe risk management programs was to minimize costs. Today, however, risk management of currency exposure has, in many cases, evolved into a firmwide exercise that addresses both short-te1m and long-term exposures and encompasses financial as well as operational hedges.
The ultimate goal of firmwide risk management is to reduce risk while placing the firm in a position to benefit from opportunities that arise from exchange rate changes. For example, Davis and Militello (1995) describe how Union Carbide employs a firmwide perspective in risk management. The company uses a one-year horizon for financial hedges (e.g., foreign-exchange derivatives), whereas for longer horizons, operational adjustments are made in sourcing, utilization of different plant locations, and pricing.
foreign currency cash flows. The latter depends on the firm's competitive position in the industries in which it operates. The fo1mer indicates whether the MNC utilizes operational hedges and financial hedges to manage currency exposure.
Leverage is traditionally viewed as arising from financing activities: finns boITow to raise cash for operations. The standard measure of leverage is total liabilities to equity. However, while some liabilities-like bank loans and bonds issued are due to financing, other liabilities--like trade payables, deferred revenues, and pension liabilities-result from transactions with customers and suppliers in conducting operations. Financing liabilities are typically traded in well-functioning capital markets where issuers are price takers.
Compared to many areas of corporate finance, relatively little is known about the fundamental detenninants of the expected rates of return of individual firms-that is, how the characteristics of a paiticular firm affect
'
expected returns earned by security-holders.
MM's Proposition II stated that the rate of return on common stock of companies whose capital structure includes some debt is equal to the appropriate capitalization rate for a pure equity stream plus a premium related to financial risk (Sivaprasad, 2007). The impact of these propositions on corporate finance is immense but the original sample they used is very limited. Further empirical work uses much larger samples but results are mixed. Some authors (Hamada, 1972; Bhandari, 1988) show that returns increase in leverage, others show that they decrease in leverage (Dimitrov and Jain, 2005; Penman 2007).
Financial leverage, in turn, results from a company resorting to debts. Their role in the structure ensures a greater return on equity in the case of prosperity, but in the case of a slump brings about greater losses, as it increases liabilities. Each of these decisions has advantages and involves risk at the same time. Analysis of leverage aims at providing infonnation al;>out the advantages and risk resulting from it. By putting emphasize into financial leverage, it is a step closer to reduce risk as well as predicting the return.
depleted, debt is issued, and when it is not sensible to issue any more debt, equity is issued. This theory maintains that businesses adhere to hierarchy of financing sources and prefer internal financing when available, and debt is preferred over equity if external financing is required.
Mining industry has been the main source of income for Indonesia for a long time. Given the abundant resources, Indonesia is one of the most attractive places for foreign investors. According to PricewaterhouseCoopers' research, the contribution of mining industry to the economy of Indonesia in 2003 reached around Rp. 19.5 trillion, which is mostly in the form of government income (Rp. 9.3 trillion) and purchases from local suppliers (Rp. 7.1 trillion).
Expenditure for the public interest is quite large such as for regional
I
and social development, reached around Rp. 604 billion (2003), staff training (Rp 164 billion), research and development (US$ 1.04 million). Meanwhile, expenditures for the reclamation, mine closure and environmental control reached US$ 83.6 million.
the data is entered for various types of minerals industry, the numbers will cettainly increase and affect the entire figures.
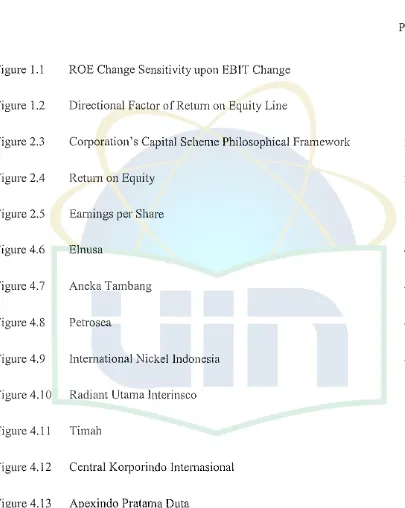
Below is the list of go public mining company in Indonesia (figures in Rupiah expressed in thousands, data of2007):
Table I.I
Comoanv's Debt and Debt to Equitv Ratio
No Company Short term debt Long term debt DER
1 A TPK Resources 18,995,251,422 1,350,972,348 0.11
2 Bumi Resources 7,984,974,395,526 5,338,504,954,160 1.26 3 Indo Tambangraya Megah 2,245,990,428,000 755,213,882,000 0.68 4 Resource Alam Indonesia 60,762,715,000 29, 708,899,000 1.09 5 Perdana Karya Perkasa 76,675,215,684 76,785,475,234 0.88 6 Tambang Batubara Bukit 695,010,000,000 421,789,000,000 0.40
7 Asam 496,740,688,000 182,048,658,000 0.95
8 Petrosea 463,854,200,814 1,933,740,064,186 1.09
9 Apexindo Pratama Dula 918,095,000,000 277,169,000,000 1.26
10 Elnusa 3,688,450,000,000 2,337,494,000,000 1.80
11 Energi Mega Persada 3,548,668,475,674 10,505,938,001,544 2.85 12 Medco Energi Internasional 121,440,162,625 111,038,745,798 l.29 13 Radiant Utama Interinsco 1,798,816,747,000 1,474,300, 753,000 0.37
14 Aneka Tambang I 94,792,000,000 114,063,000,000 1.69
15 Cita Mineral Investindo 2,366,059,276,000 2,339,218,588,000 0.36 16 International Nickel Indonesia 1,350,230,000,000 323,163,000,000 0.50
17 Timah 50,837,822,000 54,437,767,000 0.16
18 Central Korporindo Int' I 117, 166,000,000 21,315,000,000 3.29
19 Citatah Industri 102,024,224,000 2,680,594,000 5.33
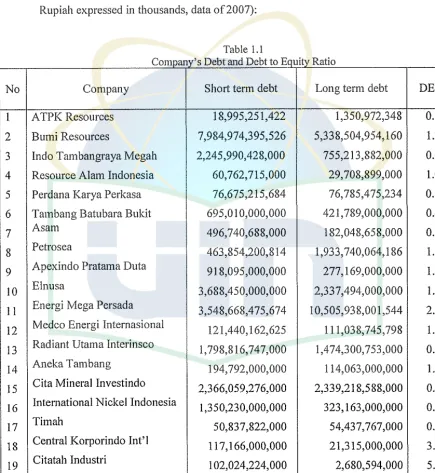
[image:19.518.42.477.178.651.2]An alternative measure of overall company performance is return on equity (ROE). A company's ROE is affected by the same income statement items that affect ROA as well as by the company's degree of financial leverage, which is shown as follows (Ross, 2006:467):
ROE ROA x Leverage measure
Net income Net income Total assets
x
[image:20.522.87.427.169.513.2]Equity capital Total assets Equity capital
Figure 1.1
ROE change sensitivity upon EBIT change
(Source: Tadeusz Dudycz, "The Different Faces of Leverage")
B also leads to a higher sensitivity of changes in return on equity to changes in
EBIT. The sensitivity depends on changes in the
J3
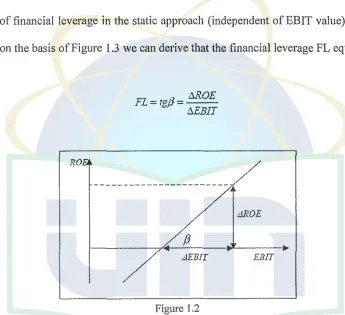
angle.If we assume that, just as in the case of operating leverage, the sensitivity of changes in return on equity (ROE) to EBIT change is a measure of financial leverage in the static approach (independent ofEBIT value), then on the basis of Figure 1.3 we can derive that the financial leverage FL equals:
}{_()
!!.ROE FL=wfJ· =
[image:21.521.83.428.201.516.2]--· f!.EBIT
Figure 1.2
/
.dROE
Directional factor (slope) ofretum on equity line (Source: Tadeusz Dudyez, "The Different Faces of Leverage")
The leverage measure is simply the inverse of the capital ratio (when only equity counts as capital). The higher the capital ratio, the lower the leverage measure and degree of financial leverage.
natural that financial leverage plays important role on the development of a firm. While exercising financial leverage, the cost of that leverage is also increasing. This is also affecting net income, ROE, and BPS of that particular firm.
This paper contributes to the existing literature on the relationship of returns and capital structure in three directions. First, this is a study which expands the limited work carried out on leverage and returns by examining leverage as an independent variable and its impact on returns. Second, the paper tests for linearity of leverage and return. This is an important test to
I
enable the better understanding of the traditionalist theory of capital structure and optimal capital structure. Thirdly, the writer undertakes robustness checks with several factors.
B. Problem Identification
Attracting and convincing investors have never been easy for it ties with company's value, performance, goodwill, as well as its reputation. It is also important to know the relation between financial leverage and ROE along with EPS. Therefore, corporation can consider how large in taking external financing to can-yon their operation.
In fact, each and every year, under certain condition, there is always corporation with the closest relation on the topic chosen for the research: the higher the financial leverage, the higher the ROE and EPS (Pamela, 2006). Based on the background explained previously, the writer wants to focus on the problem needs to be addressed which is impact of leverage in terms of its effects on ROE and EPS in mining industry. Aside from main focus of the problem, there are also other problems:
1. Does financial leverage and liquidity affect ROE for listed mining company in Indonesia Stock Exchange from year 2005-2007?
C. Purpose and Significance
I. Purpose
This research seeks to analyze relation between financial leverage and ROE as well as EPS. The aims of the paper are:
a. To examine the significance of financial leverage and liquidity towards ROE for listed mining company in Indonesia Stock Exchange from year 2005-2007.
b. To examine the significance of financial leverage and liquidity towards EPS for listed mining company in Indonesia Stock Exchange from year 2005-2007.
2. Significance
Separately, there are various conditions that later influence the significance of the research:
a. Academically, this research expects the contribution for the development of lmowledge and general information on effect of leverage in mining industry, and parties related to the problem of research.
b. Practically, this research offers initiative for corporation, particularly mining company, related to the problem ofresearch.
c. Socially, this research provides idea that keenly brings changes in the way people think, act, as well as providing general knowledge for society.
CHAPTER II
LITERATURE REVIEW
A. Company Sources of Fund
Sources of fund for a company in general include the following (Husnan, 1994):
I. Internal
a. Retained earning, influenced by:
l) Amount of earning in that particular period
2) Dividend policy
The higher the dividend, the lower the retained earnings. Vice versa.
3) Reinvestment
b. Depreciation accumulation
2. External
b. Owners' equity
Equity from owners of the company for limitless time. Accordingly, it is an equity being staked for all business risk as well as other risk. Sources of financing from owners' equity:
I) Common stock
It represents the ownership in a company. Common stock does not have a maturity date, but exists as long as the firm does. Nor does common stock have an upper limit on its dividend payment. The common shareholders have the right to the residual income after bondholders and preferred stockholders have been paid.
2) Preferred stock
Security with characteristics of both common stock and bonds. It is similar to common stock because it has no fixed maturity date, the nonpayment of dividends does not bring on bankruptcy, and dividends are not deductible for tax purposes. Preferred stock is similar to bonds in that dividends are limited in amount.
3) Cumulative preferred stock
B. Financial Leverage
The study of the combination of internal and external financial resources in company liability has generated controversy over the years. Especially significant is Miller and Modigliani's (Ml\i!) important contribuuion to capital structure theory of 195 8, which showed that, given a company's investment policy, and not taking taxes and transaction costs into account, the choice of financial policy does not affect the current market value of the company. However, because real markets are far from the so-called "perfect capital markets" on which MM based their work, numerous studies have shown the interdependence among investment decisions, financing decisions, and fitm value. Continued interest in this topic justifies further study of a company's financial decisions that determine its level of debt.
In MM tests of proposition II, returns to shareholders are approximated by actual shareholder net income and estimations are made in the cross section of all firms in a risk class for a single year. As the authors discuss amongst themselves, this is very crude. The writer uses panel data that contains information for three consecutive years and combines the cross section with the time series. The writer represents returns to shareholders as stock returns in excess of risk-free rate.
based on book values is associated with lower average returns, whereas leverage based on market is associated with higher returns (Fama and French, 1992; henceforth FF). He concluded that this variation in their findings is explained and absorbed by the book-to-market effect. In MM, the only independent variable is the leverage ratio to test for the linearity of the relationship. In this study, on top of the leverage ratio, the writer uses variables that reflect average leverage in every risk class and idiosyncratic risk, including the FF risk factors.
total assets for the leading firms in an industry over the he year period. He too found that relatively large amounts of leverage tend to raise industry profit rates, more leverage implying greater risks. In this study, in addition to the
I
leverage ratio and its square, the writer uses three variables that reflect leverage, including its ratio and the particular return and earnings.
From various financial ratios, there are some ratios and corporate financial information that can be used to predict return. Financial ratio is divided into five categories (Ang, 1997): (I) liquidity ratio; (2) activity ratio; (3) profitability ratio; (4) leverage ratio; and (5) market ratio. Profitability ratio consists of seven ratios: gross profit margin (GPM), net profit margin (NPM), operating return on assets (OPROA), return on asset (ROA) or return on investment (ROI), return on equity (ROE), and operating ratio (OPR).
C. Liquidity
Liquidity is the speed and ease at which an asset can be converted into cash. The more cun-ent assets that a firm has relative to its current liabilities, the greater the firm's liquidity (Keown, 2005:41). Or else, the ability of a firm to pay its bills on time. Measuring a firm's liquidity is not an easy task, for it has two approaches. The first approach compares cash and the assets that should be converted into cash within the year. The assets here are the current assets, and the debt is the current liabilities in the balance sheet. The current ratio measured by its current assets relative to its current liabilities. Furthermore, remembering that the three primary current assets include cash, accounts receivable, and inventories, it is possible to make the measure of liquidity more restrictive by excluding inventories, the least liquid of the current assets, in the numerator. This revised ratio is called acid-test ratio.
year, or the accounts receivable turnover ratio, measured by the number of times its accounts receivable are collected during a year.
As a general rule, management would want to collect receivables sooner rather than later-that is, reduce collection period and increase inventory turnover. However, it may be that a company's management would intentionally extend longer credit terms as a policy for reasons it deems justifiable. Alternatively, slower collection could mean that management is simply not being as careful at enforcing its collection policies. In other words, it may not be managing receivables effectively. Some people may want to know the same thing for inventories that is just determined for accounts receivable: How many times are a firm turning over inventories during the year? In this manner, some insight can be gain into the liquidity of inventories. The inventory turnover ratio indicates the relative liquidity of inventories, as measured by the number of times a firm's inventories are replaced during the year.
creates the need to reduce the probability of costly default by lowering the leverage. Yet models that predict a non-positive effect argue that lower asset liquidity makes it more costly for managers to expropriate value from bondholders. Thus, lower asset liquidity reduces the costs of debt, and as a result, companies use more debt. Despite substantial progress in modeling the relation between asset liquidity and leverage, limited empirical evidence pertains to this effect because of the difficulty of obtaining a measure of asset liquidity. In turn, existing studies that examine the relation between asset liquidity and leverage - such as Alderson and Betker (l 995), Kim (1998), and Benmelech, Garmaisc, and Moskowitz (2005) - tend to limit their attention to narrow and specific samples offinns or assets.
The expected impact of corporate diversification on liquidity is unclear. There are arguments and evidence supporting both a positive and negative relationship between diversification and liquidity. Chang and Yu (2004) suggest diversified firms have reduced adverse selection costs since firm-level prices are less sensitive to information asymmetries arising in individual divisions. In addition, Benston and Hagerman (1974) point out that since market makers hold undiversified portfolios, corporate diversification reduces inventory holding costs by reducing volatility. The reduction in either adverse selection costs or inventory holding costs would reduce spreads for diversifying firms. Alternatively, Nanda and Narayanan (1999) suggest that allowing each of a diversified firm's divisions to trade independently facilitates price discovery by investors. More accurate market prices would mitigate adverse selection problems and improve liquidity. Note that price discovery arguments do not preclude offsetting diversification effects.
D. Return on Equity
(1%) with earning prediction is net income to net worth (NINW) or retnrn on equity (ROE) (Machfoedz, 1994).
The financial structure of a corporation provides the market with information about the firm, with the market value of the firm increasing with the level of debt (Ross, 1977). This can be taken to mean that, if managers raise the level of debt, then it is because their expectations for the future of the company permit it to meet its obligations, making it clear that the risk of insolvency is not relevant. The value of a company and the size of its debt are positively correlated (Raviv, 1990). Variations in the company's level of debt will affect its market value, since the firm's change in capital structure transmits information about the future expectations of the company. For example, an announcement of the reduction of the number of common stocks in exchange for a debt offering has a positive effect on the market, which becomes a negative effect when the reverse happens (Copeland and Lee, 1991).
sample lacks sufficient firms to yield statistically significant coefficients. Industry classification is indeed a good proxy for business-risk across industries (Bradley, 1984), the writer undertakes cross-sectional analysis separately for each firm. Stock returns is inflation adjusted (Bhandari, 1988) whereas the writer defines stock returns in excess of the risk free rate that encompasses the inflation adjustment. He conducts his tests in the cross section of all firms without assuming different risk classes. On the other hand, the writer defines leverage as the ratio of book value of debt to the book value of equity. Nevertheless, the writer accounts for the difference between the two measures by using book-to-market ratio as a risk factor (FF, 1992).
E. Earnings per Share
Firm size has been one of the variables most commonly used in explaining a company's level of debt. Study has made it clear that the size of a firm is positively related to its use of debt as a source of financing (Requejo, 1999). The larger a firm is, the more information is expected to be available about it, which reduces the level of information asymmetries in the market, making it possible to obtain financial resources from lenders.
The tangible assets of a firm can be considered representative of the real guarantees that it can offer its creditors. Therefore, the importance of those assets among total assets influences its level of debt, which rises with the increase of warranties offered by the firm to satisfy its obligations arising from contracted debt (Requejo, 1999).
are those that expect to remain in the market for a long time (Myers, 1977). For them, honesty is the best policy.
The EPS formula does not include preferred dividends for categories outside of continued operations and net income. Earnings per share for continuing operations and net income are more complicated in that any preferred dividends are removed from net income before calculating EPS. Remember that preferred stock rights have precedence over common stock. If preferred dividends total Rp. 10,000,000,000 then that is money not available to distribute to each share of common stock.
F. Previous Research
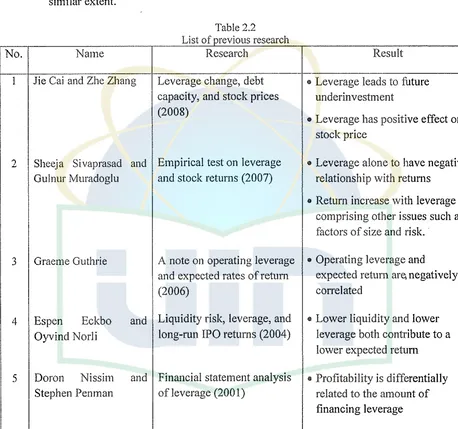
[image:39.518.32.490.149.578.2]The following is list of previous literature study or research conducted in the similar extent.
Table 2.2
L' 1s o previous researc t f 1
No. Name Research Result
I Jie Cai and Zhe Zhang Leverage change, debt • Leverage leads to future capacity, and stock prices underinvestment
(2008)
• Leverage has positive effect on stock price
2 Sheeja Sivaprasad and Empirical test on leverage • Leverage alone to have negative Gulnur Muradoglu and stock returns (2007) relationship with returns
• Return increase with leverage comprising other issues such as factors of size and risk.
3 Graeme Guthrie A note on operating leverage • Operating leverage and and expected rates of return expected return 。ョセ@ negatively
(2006) correlated
4 Espen Eckbo and Liquidity risk, leverage, and • Lower liquidity and lower Oyvind Norli long-run IPO returns (2004) leverage both contribute to a
lower expected return 5 Doron Nissim and Financial statement analysis • Profitability is differentially
r:), J
·3-r
LJif\l :f' ,-1(;G. Theoretical Framework
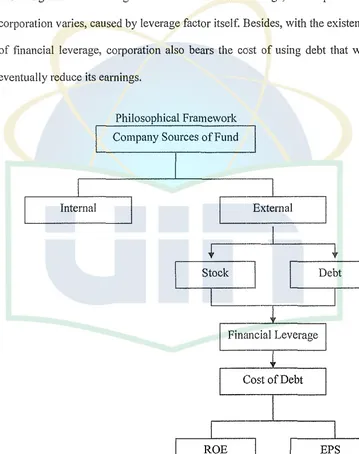
In order to expand the business, a corporation needs capital support wherein one of the alternatives is debt. When using debt, a corporation is also executing financial leverage. Due to the financial leverage, the output of the corporation varies, caused by leverage factor itself. Besides, with the existence of financial leverage, corporation also bears the cost of using debt that will eventually reduce its earnings.
Philosophical Framework Company Sources of Fund
Internal
+
セ}@
セMMMdセ・「エ@
I
Financial LeverageLCost ofDeht
[image:40.521.84.443.194.648.2]EPS Figure 2.3
With the purpose of knowing the effect of financial leverage towards earnings, therefore the writer will calculate financial leverage executed by each corporation from its financial report while the earnings of that pai1icular corporation is expressed both in ROE and EPS.
As for knowing the effect of financial leverage towards earnings, whichever both measured by ROE and EPS, the mining industry wit! be selected for it has the one of the highest development in recent years yet the most supporting pillar for the economy of the country.
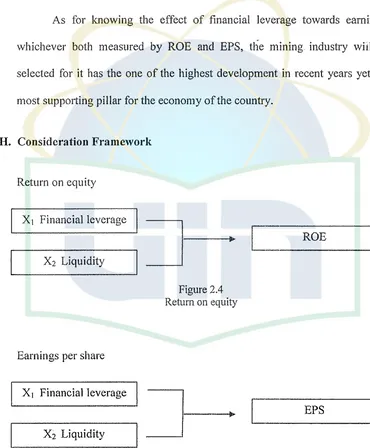
H. Consideration Framework
Return on equity
X1 Financial leverage
1
セセMクセRMlMゥMアオ⦅ゥ⦅、MゥエMケセ⦅⦅Lヲ@
____!
[image:41.518.64.434.196.644.2]Earnings per share
Figure 2.4
Return on equity
IJ-r---il
X2 Liquidity .X1 Financial leverage
Figure 2.5 Earnings per share
[
[
ROE
A. Research Scope
CHAPTER Ill
RESEARCH METHODOLOGY
This research aims at knowing firm's financial leverage measured by financial leverage, as well as its impact in terms of its effects on return on equity (ROE) and earnings per share (EPS) in mining industry. Financial leverage describes the using of financial capital in order to finance the corporation while financial leverage ratio shows how assets are financed, whether using debt or equity. Financial leverage (FL) is used to measure how large assets are financed by creditor. The bigger financial leverage, the higher financial capital used to make profit.
B. Sampling Method
Sampling is part of statistical practice concerned with the selection of individual observations intended to yield some knowledge about a population of concern, especially for the purposes of statistical inference. Each observation measures one or more properties (weight, location, etc.) of an observable entity enumerated to distinguish objects or individuals. Survey weights often need to be applied to the data to adjust for the sample design. Results from probability theory and statistical theory are employed to guide practice (Kish, 1995).
In this study, population selected as research object is mining firms that have been listing (go public) in Indonesia Stock Exchange (IDX). Criterion in choosing the population is because only firms that have been listing can be monitored constantly. There are total 19 go public mining firms listed in Indonesia Stock Exchange (IDX) with the exception of stock that is started to listing and delisting in addition to the availability of information during the research.
C. Data Collection Method
Data used in this research is secondary data acquired from Documentation Center of Bisnis Indonesia together with literature study by reading, intensifying, and scmtinizing literature related to the research.
In
research, Secondary data is collected and possibly processed by people other than the researcher in question (Schutt, 2006). Common sources of secondary data for social science include censuses, large surveys, and organizational records.
D. Analysis Method
1. Descriptive
In this research, descriptive analysis will also be used as an approach, by interpreting obtained data which is based on the emerging facts within the research time-span hence there will come into view the description on the research object.
Descriptive Statistics are used to describe the basic features of the data gathered from an experimental study in various ways. They provide simple summaries about the sample and the measures. Together with simple graphics analysis, they form the basis of virtually every quantitative analysis of data. It is necessary to be familiar with primary methods of describing data in order to understand phenomena and make intelligent decisions.
In general, statistical data can be briefly described as a list of subjects or units and the data associated with each of them. Although most research uses many data types for each unit, this introduction treats only the simplest case. Meanwhile, the data is processed using SPSS version
16, using corporations' financial data from the year 2005 until 2007.
2. Quantitative
through data processing and statistical test. Quantitative research is the systematic scientific investigation of quantitative properties and phenomena and their relationship. The objective of quantitative research is to develop and employ mathematical models, theories and/or hypothesis pertaining to natural phenomena. The process of measurement is central to quantitative research because it provides the fundamental connection between empirical observation and mathematical expression of quantitative relationships. Some tests include in this quantitative research are as follows:
a. Assumption Classic Test
1.) Autocorrelation
Autocorrelation is a mathematical tool for finding repeating patterns, such as the presence of a periodic signal which has been buried under noise, or identifying the missing fundamental frequency in a signal implied by its hannonic frequencies. It is used frequently in signal processing for analyzing functions or series of values, such as time domain signals. Infonnally, it is the similarity between observations as a function of the time separation between
2.) Multicollinearity
Multicollinearity is a statistical phenomenon in which two or more predictor variables in a multiple regression model are highly correlated. In this situation the coefficient estimates may change erratically in response to small changes in the model or the data. Multicollinearity does not reduce the predictive power or reliability of the model as a whole; it only affects calculations regarding individual predictors. That is, a multiple regression model with correlated predictors can indicate how well the entire bundle of predictors predicts the outcome variable, but it may not give valid results about any individual predictor, or about which predictors are redundant with others.
3.) Heteroskedasticity
In
statistics, a sequence or a vector of random variables is heteroskedastic, if the random variables have different variances. The complementary concept is called homoskedastiity. The term means "differing variance" and comes from the Greek "hetero" ('different') and "skedasis" ('dispersion').be true if the observations of the error term are assumed to be drawn from identical distributions. Heteroscedasticity is a violation of this assumption.
b. Multiple Linear Regressions
I.) Coefficient determination (R2)
Coefficient of detem1ination,
f·t2,
is the proportion of variability in a data set that is accounted for by a statistical model. There is no consensus about the exact definition of R2• Only in thecase of linear regression are all definitions equivalent. In this case,
R2 is simply the square of a correlation coefficient. R2 is a statistic that will give some information about the goodness of fit of a model. In regression, the R2 coefficient of determination is a statistical measure of how well the regression line approximates the real data points. An R2 of 1.0 indicates that the regression line perfectly fits the data.
2.) F test
In many cases, the F-test statistic can be calculated through a straightforward process. Jn the case of regression: consider two models, 1 and 2, where model I is nested within model 2. That is, model 1 has p1 parameters, and model 2 has p2 parameters, where
p2 > p1. (Any constant parameter in the model is included when counting the parameters. For instance, the simple linear model y =
mx
+
b hasp= 2 under this convention.) If there are n data points to estimate parameters of both models from, then calculate Faswhere RSS; is the residual sum of squares of model i. If the regression model has been calculated with weights, then replace RSS; with
x2,
the weighted sum of squared residuals. F here is distributed as an F-distribution, with (jJ2 - pi, n -p2) degrees of freedom; the probability that the decrease inx
2 associated with the addition of p2 - p1 parameters is solely due to chance is given by theprobability associated with the F distribution at that point. The null hypothesis, that none of the additional p2 ·-p1 parameters differs
3.) t test
A t-test is any statistical hypothesis test in which the test statistic has a student's t distribution if the null hypothesis is true. It is applied when the population is assumed to be normally distributed but the sample sizes are small enough that the statistic on which inference is based is not normally distributed because it relies on an uncettain estimate of standard deviation rather than on a precisely known value. In testing the null hypothesis that the population mean is equal to a specified value
po,
one uses the statistic. The t statistic to test whether the means are different can be calculated as follows:where s is the sample standard deviation of the sample. n is the sample size. The degrees of freedom used in this test is n - 1.
3. Hypothesis
theories. A Hypothesis is never to be stated as a question, but always as a statement with an explanation following it. It is not to be a question because it states what he/she thinks or believes will occur.
Any useful hypothesis will enable prediction by reasoning (including deductive reasoning). It might predict the outcome of an experiment in a laboratory setting or the observation of a phenomenon in nature. The prediction may also invoke statistics and only talk about probabilities. Karl Popper, following others, has argued that a hypothesis must be falsifiable, and that one cannot regard a proposition or theory as scientific if it does not admit the possibility of being shown false. Other philosophers of science have rejected the criterion of falsifiability or supplemented it with other criteria, such as verifiability (e.g., verificationism) or coherence (e.g., confirmation holism). The scientific method involves experimentation on the basis of hypothesis in order to answer questions and explore observations.
This research uses the following hypothesis: Hoa= Financial leverage and liquidity do not affect ROE H1a =Financial leverage and liquidity affect ROE
E. Research Operational Variable
There are four variables used in this research as a foundation for further analysis of research. Those variables are selected from the closest relation on each element, which represent every measurement of paiticular item. Each element represented by indicator that makes it easier to read and understand as to proceed to the research. Some variabks are already available in the annual report of the company, while some other needs to be calculated by using the standard formula.
Operational variables used in this research are derived from items registered in financial report of each company. Those are financial leverage (total debt to total assets), liquidity (current assets to current liabilities), return on equity (net income to common equity) and earnings per share, which is readily available in financial statement.
[image:52.521.80.441.190.653.2]Variables chosen for the research object are: Table 3.3
Research's variables and its indicators
Variable Indicator
Financial Leverage Financial Leverage (FL) Earnings Per Share (EPS) EPS
Return On Equity (ROE) ROE
Explanation on variables used in this research:
1. Financial Leverage (FL)
Calculating financial leverage from each firm for three consecutive years, and calculating average financial leverage for mining industry. Financial leverage measures ratio between total debt to total assets with the following formula:
FL= Total Debt
Total Assets
2. Return on Equity (ROE)
ROE analyzes the accounting rate of return on stockholders' investment, as measured by net income related to common equity:
ROE= Net Income
Common Equity
3. Earnings Per Share (EPS)
EPS aims at knowing net income on a per share basis, which is determined by net income related to shares outstanding:
EPS
=
Net Income4. Liquidity
Liquidity is the speed and ease at which an asset can be conve1ted into cash. Current ratio measured by firm's liquid assets (current assets) relative to its liquid debt (current liabilities).
C urrent ratio .
= - - - -
Current AssetsCurrent Liabilities
5. Analysis on financial leverage effect towards ROE and EPS
This research uses multiple linear regression analysis, an analysis in which the relationship between one or more independent variables and another variable, called dependent variable, is modeled by a least squares function, called linear regression equation. It uses two variables which is variable X and Y, where changes in variable X are causing changes in variable Y. However, changes in variable Y do not cause changes in variable X. Regression analysis intends to know how far one variable affects other variables.
Where:
Y =ROE and EPS
a= Constant
X1 =Financial leverage
X2 = Liquidity S = Error margin
To test the significance of variable X and variable Y, regression coefficient is applied with t-statistic test,
a
= 10% with the following formula:t=
rJ(n-
k-1)セ@
The statistical test is conducted by comparing the t calculation and t table in certain consideration level. If statistical test showed t calculation is lower than t table, then
Ho
is rejected. It means variableX
(independent) affects variable Y (dependent).To test the significance of variable X and variable Y, therefore the writer conducts F test,
a=
10% with the following formula:F=
HセI@
{
(l-r
2 ) }
(n-k-1)
The result of calculation is compared with F table, with a = l 0%. If the calculation of F is lower than F table, then I-10 is rejected. That means
CHAPTER IV
FINDINGS AND ANALYSIS
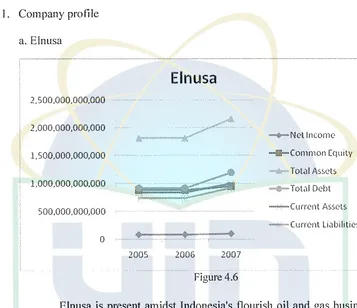
A. General View on Research Object l. Company profile
a. Elnusa
2.500.000.000,000
2.000.000.000.000
1, 500.000,000,000
1.000.000.000.000
500,000,000.000
[image:56.518.76.433.176.484.2]0
Elnusa
2005 2006 2007
Figure 4.6
セ]LLLn・エ@ lncon)e
セcッョQョQッョ@ Cquity Totd! Assets """"<i>'"U·Total Debt
⦅LLLLセ]cオイイ・ョャ@ Assc1ts
セセBBBBBGBGMcオイイ・ョエ@ Li<tbilities
Elnusa is present amidst Indonesia's flourish oil and gas business development. Born as the Indonesia's oil and gas pioneers' idea, in 1969, Elnusa was initially a subsidiary of PT Pertamina. Elnusa started its operation as a provider of electronic communications equipment, ship navigation and radar system for oil and gas carriers in Indonesia.
well. Elnusa, along with its subsidiaries has tumed into an integrated oil and gas service provider which has received customer's remarkable trusts. Not only has trust been given by PT Pertamina, the parent company, it has also been delivered by a couple of prominent multi-national partner companies such as Chevron, Total EP, Shell, ConocoPhillips, BP and so on.
The demand for business development has made Elnusa undertake necessary reposition. On October 2007, four of its subsidiaries which were the back-bone of the company's oil and gas service business were merged into the parent company along with a horizontal merge which was intended to strengthen the main business. This is a reposition which was meant to materialize Elnusa as a business player which focuses on upstream integrated oil & gas services.
b. Antam
14 ,000,000,000,000
12,000,000,000.000
10,000.000,000,000
3,000,000,000,000
6,000,000,000,000
4,000.000,000,000
2,000,000,000,000
0
Aneka Tambang
[image:58.518.88.433.115.505.2]2005 2006 2007
Figure 4.7
""""iF'=Nct lncoine
セcッQョョQッョ@ Equity
, Total Asscls
セtッエ。ャd」「エ@
BGGBBBセGGBGGcオイイ・ョエ@ Assets ==\il"'"'"Currcnt liab!litic:.
With four decades of experience sinee 1968, Antam is an Indonesian limited liability state corporation that is vertically integrated to undertake all stages of the mining process from exploration, mining, smelting, and refining through to marketing. Antam's main products are ferronickel, nickel ore, gold, silver and bauxite.
creating shareholder value, not following the directives of the state. In general, Antam's approach to increase shareholder value is by lowering costs while profitably expanding operations in a sustainable manner.
Antam offers highly viable opportunities to potential investors and joint venture partners. It has strong, focused, future-oriented management and skilled people; high quality products and long-term loyal customers; a proven record of profitable performance while upholding international standards of community development and environmental management; and good future prospects with vast quality mineral reserves yet to be developed.
c. Petrosea
16.000.000.000,000
14.000,000,000,000
12.000,000,000,000
10.000,000,000,000
8,000,000,000,000
6,000.000,000,000
4,000.000,000,000
2,000,000.000,000
0
2005
Pete rose a
[image:59.519.86.431.188.627.2]2006 2007
Figure 4.8
=<v--Ncl l!1con1c
セMcッョQョQッョ@ [quity Totdl Assets
セBBBG@ T ot.:il Debt .rn"'"'"'""-Currcnt Assets セBセセBGセcオイイ・ョエ@ Li.Jbilities
since 1972. Today, Petrosea is recognized as one oflndonesia's leading engineering and construction contractors.
Petrosea has been listed on the Jakaiia and Surabaya Stock Exchanges since 1990 and was the first publicly-listed Indonesian engineering and construction company in Indonesia. Our strategic shareholder and partner, Clough Ltd (ASX:CLO) provides Petrqsea with access and support to world-class management and project delivery systems which allows Petrosea to deliver international excellence to the Indonesian market.
d. International Nickel Indonesia
International Nickel Indonesia
25,000,000.000,000
20.000,000,000,000
15,000,000,000,000
10,000,000.000,000
5,000,000,000,000
0
[image:61.524.90.433.119.480.2]2005 2006 2007
Figure 4.9
·1= Ncl lnco1nc
ᄋᄋセM]cPQyAョIoエQ@ Equity
''""''""Total Assets
·--Total Debt ""'-'"''"'"'Current 1\sscts
BBGGTャャゥ]セcオイイ」ョエ@ li.:ibi!ilics
PT Inco is one of the world's premier producers of nickel, a versatile metal, which is important in improving living standards and fostering economic growth. For more than three decades, since the signing of its Contract of Work with the Indonesian Government in 1968, the Company has provided skilled jobs, shown concern for the needs of the communities in which it operates, benefited shareholders and contributed positively to the Indonesian ec()nomy.
well-trained workforce, low-cost hydroelectric power, modern production facilities and an assured market for its product.
The Company is owned 60.8 percent by Vale lnco of Canada, one of the world's leading nickel producers, and 20.1 percent by Sumitomo Metal Mining Co., Ltd. of Japan, a premier mining and smelting company. In addition, 20.0 percent of PT Jnco's shares are owned by public shareholders and the balance by four other Japanese companies.
e. Radiant Utama Interinsco
Radiant Utama lnterinsco
450.000,000.000 400,000.000,000 350,000,000,000 300,000,000.000
250,000,000,000 200,000,000,000 150.000,000,000 100,000.000.000
so.000.000.000
0
[image:62.521.88.432.192.548.2]2005 2006 2007
Figure 4.10
Bセセn・エ@ !neon)(.'
セcッョQイョッョ@ [quily
,,_, Toli'il Assets
MMtッエセQA@ Debt
セB]GセBGBGセcオイイ・ョエ@ Assets """"AJW'"""Current liubi!itics
r----PERPUSTAKAAN UTAMA
UIN SYAHID JAKARTA
l
In 1979, PT. Supraco Indonesia was formed, and soon followed by new identity of PT. Radiant Utama Interinsco in 1984 to differentiate activities from well-diversified Radiant Utama Group of Companies. Through the years, the Company has grown to become one of the most successful companies in Indonesian oil and gas area, carries more than 30 years of experiences.
Today, PT. Radiant Utama Interinsco and its affiliate company, PT. Supraco Indonesia has been actively engaged in 4 major areas: Operation Support Services, Inspection & Certification, Operation & Maintenance, and Provision of Offshore Services & Trading. Our commitment towards fine quality and excellence in service was endorsed further when we obtained ISO 9001: 2000 in year 2002. We offer our Partner the expertise and lmowledge of Indonesian Energy sector where our unique ability to combine overseas and domestic capabilities will continue to offer high value business opportunities. Radiant Utama provides on-land drilling and work over services. On-land drilling activities consist of integrated operation management to drill new wells. It can also provide work over services to maintain production levels on the existing wells.
To support its activities and deliver excellent service, Radiant Utama is supported with auxiliary equipments, complete heavy-duty transportation fleet, more than 42,000 square meter of base camp and
maintenance facilities (completed with several workshops, office, warehouse, training center and camp that able to accommodate 80 packs), integrated management system and skillful an experienced manpower.
Currently, Radiant Utama operations are spreading throughout Indonesia, working for number of clients. Apart from own-operation, Radiant Utama can also supply and manage drilling experts from various level of expertise. Many foreign companies that are operating in Indonesia outsource all their drilling crew to Radiant Utama. Also, Radiant Utama can provide rental services for selection of drilling equipments, such as: BOP (Blow-Out Preventer), Tubular, Mud Pumps, Engines, Generator sets and other rig accessories. These well-maintained equipments remain as important Radiant Utama' s assets besides the Rig unit themselves.
completion, Radiant Utama could be both the IPM holder or the suppmtive !PM holder.
f. Timah
6,000.000.000.000
5' 000. 000, 000,000
4,000,000,000.000
3.000,000,000,000
2,000,000,000.000
l,000.000,000,000
0
2005
Tin1ah
[image:65.524.88.433.179.510.2]2006 2007
Figure 4.11
"'"'"4r-Nct lncon1c
"""'8--Co1n111on Cquity
, Totul Assets
-TotolDcbt '"''"1"''"''Currcnt Assets '""'"if!J''"""Currcnt Li<1bilities
PT Timah (Persero) Tbk inherited a long history of tin mining in Indonesia, which has been continued for more than 200 years. The tin mineral resources in Indonesia were found in the land and the surrounding waters of the islands of Bangka, Belitung, Singkep, Karimun, and Kundur.
decade after the Declaration of Independent of the Republic of Indonesia, these three entities were nationalized on 1953-1958 to become three State Enterprises. The State Tin Enterprises Coordinating Board (BPU PN Tambang Timah) was established in 1961 to oversee the three State Tin Mining Enterprises, and in 1968 these four entities, together with a smelter unit, were consolidated into the state company to become Perusahaan Negara (PN) Tambang Timah.
With the enactment of Law Number 9 of 1969 and issuance of Government Regulation Number 19of1969, the status of PN Tambang Timah and Mentor Tin Smelter Project were changed in 1976 to become limited liability company, wholly owned by the Government of Indonesia (Perusahaan Perseroan - Persero) and the name was changed to PT Tam hang Timah (Persero ).
The successful restructuring was able to restore company's health and competitiveness, and made it possible for the Government to partially privatize PT Timah through Initial Public Offering of its shares in Indonesia and in the international stock exchange. PT Timah was listed in the Jakarta Stock Exchange, the Surabaya Stock Exchange, and The London Stock Exchange in 19 October 1995. Since then, 35% of the Company's shares were belonging to the public, both domestic and international, while the remaining 65% remained with the Government of the Republic oflndonesia.
To facilitate the growth sh·ategy through business diversification, in 1998 PT Timah Tbk reorganized the business group by splitting-up the Company's operations into three subsidiaries, which practically placed PT Timah Tbk as the holding company and correspondingly expand the business scope into mining field, industry, engineering, and trading.
Currently, PT Timah Tbk is known as the largest producing company of tin metal worldwide and is in the process to diversify into businesses other than thin based on its current and to be developed
I
g. cセ・ョエイ。ャ@ Koq1orindo lntcrnasional
Central l<orporindo lnternasional
800,000,000,000 700,000,000,000 600,000,000.000 500,000,000,000 400,000,000,000 300,000,000,000 200,000,000,000 100,000,000,000 0
2005 2006
Mセ@ Ncl lncon1c
MセcッョQョQッョ@ Cquity
Totul ASS('tS
-Tot.:ilDcbt
[image:68.521.88.434.110.513.2]2007
Figure 4.12
PT. Central Korporindo !nternasional Tbk was esiabiished in September 1999. This company is specializing itself in coal based industry. It started the business as a coal merchant. Through the development, it has its own concession and port nowadays.
the company keeps on looking for some further development in areas which can optimize its specialist in coal based industry. Power Plants industries are the ones that can serve the goal.
h. ,i\pexindo Pratatna Duta
Apexindo Pratama Outa
5.000,000,000,000
4,000,000,000,000
3.000,000,000,000
2.000,000,000,000 1,000,000.000,000
0
I i.000.000.000.000)
[image:69.521.89.432.181.489.2]2005 2006 2007
Figure 4.13
セ]n・エ@ lnco111c
セcッイョイョッョ@ Equity ,_--- -"Totill Assets セ@ T ot.11 Debt GBセGBBBBBHuイイ・ョャ@ AS5CtS
BGBGBRQセMBBcオョ」ョエ@ liubi!itics
Apeexindo Pratama Duta is Indonesia's largest national onshore &
offshore drilling contractor that has been serving both prominent local and international clients domestically as well as abroad for the last two decades. Throughout our services, we have consistently put health and safety of our employees and other stakeholders. in addition to protection of the surrounding environment. as our number one priority.
Apexindo to become the new majority shareholders. Thus, since then Mira Holdings International become the controlling shareholders of
Apexindo with 98.14% of shares stake.
PT Apexindo Pratama Duta Tbk (Apexindo) offers onshore and offshore drilling services to oil and gas as well as geothermal exploration and production companies that cover wide range of area throughout the country. In July 2002, the company became the first drilling contractor to be listed on the stock exchange with APEX as its ticker symbol.
2. Limitation on data
There are total 19 mining companies listed in Indonesia Stock Exchange. All companies have been listing for at least four years, except six newly listed companies, which began listing in 2006, such as A TPK Resources, Inda Tambangraya Megah, Perdana Karya Perkasa, Elnusa, Mitra Investindo, and Cita Mineral Investindo. Due to this reason, these six companies do not have their financial report for year 2005. Therefore, it does not include in the analysis for year 2005, whereas in 2006 and 2007 all companies had published their financial report.
B. Findings and Analysis
I. Financial leverage and liquidity toward ROE a. Assumption classic test
1) Autocorrelation
Model Surnrnary1
>
Adjusted R Std. Error of the
Model R R Square Square Estimate Durbin-Watson
1 .380' .144 .098 .82589 1.708
-a. Predictors: (Constant), Liquidity, FL b. Dependent Variable: ROE
There are numerous numbers shown here. In this matter, Durbin-Watson is the only figure needs to be watched closely. The Durbin-Watson statistic is a test statistic used to detect the presence of autocorrelation in the residuals from a regression analysis. Its value always lies between zero and four.
Correlations
-ROE FL Liquidity
Pearson Correlation ROE 1.000 .310 -.163
FL .310 1.000 -