Session - 2002-993 (2420)
The Mind-Matrix:
A Learning, Instruction, and Assessment System
Robert A. Dennis, Ph.D., Val Stamboltsian. Ph.D., & Khy Huang
Interactive Media Group, Crump Institute for Molecular Imaging UCLA School of Medicine
The Mind-Matrix:
A Learning, Instruction, and Assessment System
*Robert A. Dennis, Ph.D., Val Stamboltsian. Ph.D., & Khy Huang
Interactive Media Group, Crump Institute for Molecular Imaging UCLA School of Medicine
Despite the current climate of increased emphasis on standardized assessment, the need for a wide range of assessment formats has never been greater, and this demand has accentuated the need for new and innovative learning assessment tools. One of the greatest limiting factors of alternative or performance assessments is the increase in time and effort they require to process and interpret the flood of information that are often generated. The Mind Matrix is one effort to bridge the gap between learning and
instruction with a networked computer-based, auto-scored, diagnostic assessment system
(http://www.mind-matrix.org).
The Mind-Matrix is a two-part software system that implements a performance
assessment format called knowledge mapping. The Mind-Matrix consists of both a client-side freestanding Java application and a complimentary backend application server. The Java-based knowledge mapping application will run on any computer that can run a Java virtual machine (JDK1.1.8). It is a stand-alone application that can communicate with the Matrix server. When used in conjunction with the Matrix server, the Mind-Matrix application is a flexible learning, instruction, and assessment system that provides valuable performance information to instructors and students. In this article, we present the theoretical background, the development context, and an overview of the most important features and capabilities of this software. In addition, we present the
architecture of the software and discuss the separate software components that make up the overall assessment system. We conclude with a discussion of current work and ongoing efforts to improve and expand this learning, instruction and assessment system. Theoretical Background
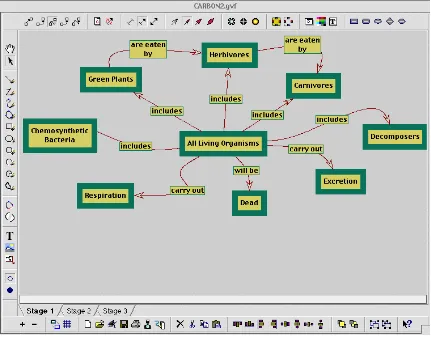
Knowledge maps are diagrammatic representations of semantic information. There are many kinds of knowledge maps and many names for very similar approaches: for example, concept maps, semantic maps, mind maps, knowledge webs, spider maps, etc. The common denominators of this family of semantic representations are nodes and links. In our work, knowledge maps are two-dimensional diagrams that use a spatial
arrangement of nodes and labeled directional links to communicate about concepts in a domain by specifying the various semantic relationships between those concepts.
The basic components of knowledge maps are nodes and links. Nodes represent concepts, facts or procedures. The links between nodes in a knowledge map represent the relationships between concepts (see Figure 1 for an example). A node-link-node connection forms a proposition.
Knowledge mapping has been used by various people as a research tool and as an instructional technique to facilitate or measure meaningful learning [1-14]. Meaningful learning is a constructive process and refers to the result of a person consciously anchoring new information to relevant prior conceptual understandings. Hundreds of research studies have been conducted that have used knowledge maps (reviewed in [1]). Most of these studies used knowledge maps as instructional interventions; far fewer have used them as assessment tools. Only more recently have they been considered as a format for assessment purposes.
Knowledge maps are recognized as an assessment tool because, some have suggested, of the potential to measure cognitive structure[11, 15-17]. Unlike similarity ratings and card sorting, knowledge mapping has gained considerable popularity in instructional settings. The reason may be because the process of constructing a knowledge map relates more meaningfully to performance [18]. The relationship between the process of constructing a knowledge map and the ability to perform, or use the knowledge represented are interrelated. Performance on certain kinds of cognitive tasks, like knowledge maps, is taken as evidence of the degree of knowledge acquisition and organization [4, 8, 9, 13, 15, 16, 18-20]. How knowledge maps should be scored is an area of active research [2, 3, 11, 13, 20-23].
Development Context
Perhaps the single most important motivation behind our work with the Mind-Matrix is the desire to build a tool that will bring learning and instruction closer together by providing a bridge between the two. The framework of this bridge between a person who has in-depth knowledge of some subject area and a person who is actively seeking an understanding of that area is our Mind-Matrix knowledge map program. The mechanics of the bridge are automated assessment of the state of the student’s understanding. The Mind-Matrix knowledge map program is fundamentally an interactive assessment tool. As a student works through a knowledge map task, the system provides feedback and content-specific information that can help the student gain a deeper understanding. In addition, the student’s interaction with the mapping task is captured and made available in a variety of different summary and detail reports. These data can be invaluable to a teacher or to someone who is responsible for instruction.
Our work with knowledge mapping began in 1989 with the "Apple Classroom of Tomorrow" project (ACOT). The motivation at that time was to develop a content assessment format that could be integrated into a high technology project that would not be overly sensitive to linguistic fluency [24]. There was a large Limited English
Proficient sub group in the ACOT pilot program population, and there was some concern that more traditional essay-type assessment would represent a barrier to these students. Our hypothesis was that a knowledge representation task does not require language fluency and would therefore provide students with an opportunity to render
representation of content knowledge. The data were suggestive enough that we continued to develop and research knowledge maps as an authentic assessment format [25].
With the success of the World Wide Web and related technologies, our attention and efforts turned towards utilizing networked computers and distributed information sources to provide rich, integrated learning environments to students that embed assessment within meaningful tasks. A Department of Defense (DoD) supported project titled Computer Assisted Educational Training Initiative (CAETI) sought to pull together the best educational software and integrate them to the benefit of student learning. The CAETI project was the first time we tested a Java applet knowledge-mapping program in a classroom setting [4]. Our work has matured considerably since this early effort with Java. In addition, Java technology has matured. However, at some point we abandoned applets in favor of full applications. The quality and support for Java across the various Virtual Machines that were packaged with web browsers during the browser wars was too uneven to be able to ensure smooth operation.
data to teaching assistants. The goal was to inform the teaching assistants about weaknesses and strengths in student understanding and thereby affect subsequent discussions in the smaller discussion group settings.
Currently we are working with high school teachers to develop California State standards-based knowledge mapping tasks that closely fit their curriculum. We are working with social studies, math, and science teachers from a small district in southern California. K-12 public school teachers face unique and challenging problems. There is often conflicting pressures on them to improve student performance on standardized tests while managing efforts to provide authentic and meaningful learning opportunities in an increasingly technology-enhanced classroom. The Mind-Matrix software as it is
presented and described below is being utilized and further refined in this context. In the following sections, we present an overview of the capabilities of this new software program.
Features & Capabilities
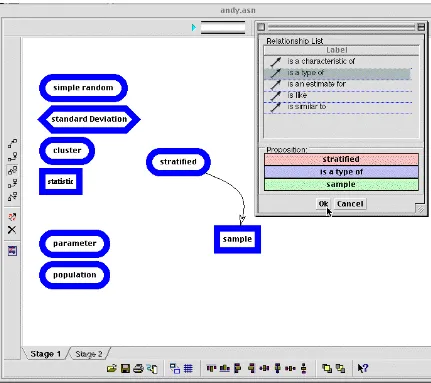
The Mind-Matrix Java application has two run-time modes: editor and student modes. In editor mode, one can author a knowledge map that can then be administered to students. When students interact with a Mind-Matrix knowledge map task, they are using the Mind-Matrix Java software in student mode. The difference between the two modes is the level of complexity and access to many features. In editor mode (see Figure 1), an author has unrestricted access to a full-featured vector graphics editor that includes the Mind-Matrix semantic information manager. The student mode hides a lot of unneeded complexity from the student and focuses their attention on the substance of the
knowledge map task (see Figure 2). Accordingly, students who interact with a mapping task do not see all the vector graphics drawing tools, and many fewer controls populate the interface. The intent is to focus student attention on the concepts and relationships among concepts.
There are many ways to utilize the Mind-Matrix in instruction including allowing
students to design knowledge maps of their own using the Mind-Matrix editor. However, the following presentation outlines our software from the perspective of a teacher or instructional designer who builds a knowledge map task and then has a group of students complete this mapping task. We begin with the Mind-Matrix Editor -- the software in author mode.
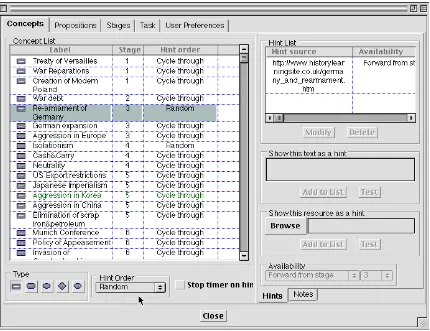
Once a map has been roughed out into a sequence of stages, the author can begin to specify and tailor various parameters of the mapping task. Figure 4 displays the "map properties" interface. Across the top are several tabs: Concepts, Propositions, Stages, Task, and General. Each tab consolidates controls for defining and controlling the
behavior of the mapping task specific to that area of functionality. There is a list of all the concepts currently added to the map under the Concept tab. Each concept in a map can be a hyperlink to additional information either in the form of text that is displayed by the Mind-Matrix software or a URL that is passed to the browser on the student's computer. Any number of "hints," as we call them, can be associated to each concept. In addition, the order and timing in which these hints are accessible to students can be controlled. Hints can be tied to a particular stage or always-available forward from any stage. A set of hints can be sequentially or randomly presented to a student in response to each double-click event. All of these properties are grouped under the "Concept" tab of the "map properties" interface. Similarly, properties associated with propositions are grouped under the "Propositions" tab of the "map properties" interface.
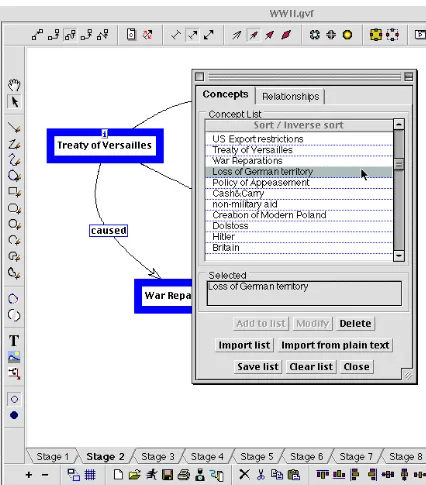
A proposition in the context of a knowledge map is a semantic construct represented as a directional concept->labeled relationship->concept structure. Propositions are the
underlying (semantic) structure of a mapping task. Concepts and relationships (links) define the raw materials that are presented to students who are asked to build a representation of their understanding by creating a set of interrelated propositions. Concepts and relationships define the boundaries of a mapping task; they are the substances of the task.
The set of propositions specified by a map author forms the scoring template.
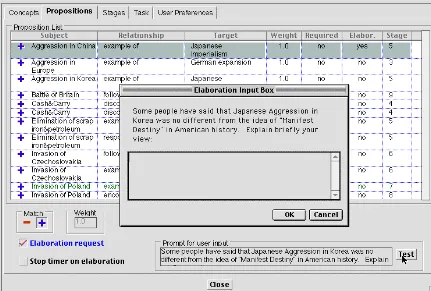
Propositions in a Mind-Matrix mapping task can have certain properties. The properties of a proposition in the Mind-Matrix are: sign (positive or negative), weight (0 - 1), required flag (Boolean), elaboration flag (Boolean), elaboration prompt text, and stage occurrence indicator. The sign of a proposition is a flag to indicate if the proposition is to be treated as a conception or a misconception. The weight of a proposition is the value that the proposition contributes to the overall quality of a map. In a Mind-Matrix task an author can have multiple relationships in the same direction between two concepts expressing different propositions. Each proposition can be variably weighted to affect the scoring and the awarding of more reward (points) to certain propositions over others. When a student interacts with a mapping task she is limited to selecting only one directed relationship between two concepts. If the elaboration bit on a proposition is set to true then if and when a student creates this proposition in her map she will be prompted to elaborate on her thinking regarding that proposition. The elaboration prompt can be specific to each proposition. Figure 5 shows an author-provided prompt, as it will appear if and when a student creates the proposition highlighted in the list of propositions. Student responses to elaboration prompts are collected and reported along with other performance data. The "required" property of a proposition is considered in the context of staging discussed below. All propositions that an author flags as required must be
allowed to move forward to the next stage. This feature is mostly useful when a minimum criterion needs to be enforced.
An important and central mechanism in the Mind-Matrix mapping software is staging. Concepts are introduced in manageable sets in stages. At the beginning of each stage students can be provided updated instructions or directives. At the end of each stage each student's map is scored relative to the author's map. Stages serve an important and multifaceted pedagogical purpose. Larger maps that contain more than 12 or 14 concepts can be intimidating and hard to complete. By breaking the task into more manageable chunks, a student's efforts can be focused and directed. In addition, staging allows for an opportunity to assess a student's work and individualize the task by drawing attention to any identified weaknesses.
The Mind-Matrix supports four stage-change policies (see figure 6). In many instances it is advantageous to allow a student to decide when to proceed to the next stage and thereby receive feedback on her performance. The default stage-change policy is just this -- "user decision." To move to the next stage in a mapping task a student must click on a button labeled "Go to next stage." In other situations, a teacher might wish to enforce more constraints on when a student can proceed from stage to stage. Each stage can be given a time limit. When that time limit is reached a student is moved to the next stage and his map is scored. The other two stage change policies are linked to performance: "quality level", and "completion level." If "quality level" is enforced then a student is allowed to move on to the next stage only when she has built a map that meets a
minimum level (percentage) of agreement with the teacher's map. The "completion level" constraint will disable the "Go to next stage" button until all propositions tagged as required are present in a student's map. Several combinations of these policies are possible. For example, an author can decide that a student should move on to stage 2 either as soon as they are ready or after 10 minutes have elapsed. In this example, the author would select both "time expiration" and "user decision" for stage one.
Each stage has its own stage-change policy.
Scoring is managed by the Mind-Matrix Java application. For the purposes of feedback to the student, discrepancies between the author's map and the student's map are highlighted at the end of each stage. Student attention is then drawn to those concepts and
System Architecture Overview
Figure 7 presents the process and overall architecture of the Mind-Matrix (see Figure 7). The two components of the Mind-Matrix assessment system are the Java application that runs on a user's computer and the Mind-Matrix community server. Once a map has been authored (a .gvf file is created), it can be saved up to (registered with ) the Mind-Matrix server and any number of tasks can be created using that map. A task is a map that is assigned to a group of students. Students can download the assignment file (.asn file), and once they have completed the mapping task they can save their data back to the Mind-Matrix server. By collecting student data to the Mind-Mind-Matrix server, we can generate summary and detailed reports regarding student performance. These reports are an important component of the overall assessment system. These reports comprise the way we hope to bridge student learning and teacher instruction. By providing teachers with these data regarding student performance (and indirect insight into student knowledge) we are trying to inform the teacher and thereby influence instruction.
The Mind-Matrix Java application is written in Java 1.1.8. The Mind-Matrix server is an application server and community web system developed using an http-based application server. The business logic of the Mind-Matrix server is written in the scripting language TCL [26-30]. The community functionality of the Mind-Matrix server is based on the Arsdigita Community System with extensions developed by us [31, 32].
Current Research and Development
The Mind-Matrix is a software product that has evolved from both applied and basic research. The Mind-Matrix is a project that began in its present form six years ago. The current version owes much of its polish to the demands of real-world applications. One area that is still a fundamental matter for basic research is scoring. We continue to investigate different approaches to scoring of student performance on mapping tasks. However, we have not yet established strong enough evidence in favor of any approach over the standard template pattern matching scoring algorithms [2, 3, 33].
Another area that we are actively pursuing is the reporting of summary and detailed information regarding student performance to teachers. As indicated in figure 7, the Mind-Matrix currently generates reports that list all propositions in the teacher's map and the number of students who successfully created and missed each one. The numbers on these reports are hyperlinks to listings of additional information. In this way a teacher can "drill down" and see a listing of students who missed or created a particular proposition. Down at this level, these reports allow a teacher to email a subgroup of students
additional information or feedback, and thereby provide tailored instruction that matches the state of each student's understanding.
teacher might form and with which students, iii) and what discussion topics or concrete exercise might be assigned to these smaller groups.
Our current work with teachers from a small school district in Southern California to create standards-based knowledge mapping tasks has been encouraging. We have seen teachers embrace the basic functionality of the Mind-Matrix knowledge map editor program and create simple maps. Mastering the software has been relatively easy to accomplish. Mastering the art of developing tasks that balance insight and critical information with detail and in-depth supplemental information is challenging. One tendency that we have noticed among high school teachers is to be detailed and inclusive of too much content. Another encouragement has come from the elementary school-level. Students from 2nd and 3rd grades have had no trouble interacting with and completing map tasks.
On the technical side of development, we have been working on a new version of the Mind-Matrix Java application that utilizes Java2. Some of the new and exciting
Figures
Figure 5. This figure displays the Propositions property panel. From this interface, the author can define the proposition properties of weight, sign, elaboration prompt, and whether the proposition is required. In this example, the author has enabled the
Statistics page
From this page you can view statistical data such as the mean and standard deviation on the accumulated results across all students. Proposition Repor ts page
This option allows you to view a groups’ results according to proposition.
Repor ts main page From the main page, you can select between 3 report options: a detailed statistical report, a report by propositions and an individualized
T he Mind Matrix is a web-based application suite. T he primar y compenets are: an H T T P ser ver, a T CL application ser ver, and an RD BMS ser ver.
1. Map Authoring
2. Taking a Mapping Task
Mind Matrix Ser ver
3. Repor ts
U sing the Mind Matrix Author application available in the community website an author creates an instructional map. T he author then sends the map up to the Mind Matrix W ebsite. Both the master map file (.gvf) and the map assignment file (.asn) are saved in the author's My-Matrix section of the website. From a web page the author can
then create a page for students to download the mapping assignment (.asn file). At this point the map has become a "task."
Students and Community Members download the assignment file (.asn) and take the mapping task. W hen they are finished they Save the map to the W ebsite.
T heir data are collected and inser ted into the Mind Matrix relational database which can then be mined to uncover weaknesses and strengths across groups of students.
U sing the data mining capabilities of the Mind Matrix W ebsite, the Map Author can create customizable repor ts in order to view student performance data in a variety of ways.
References
1. Al-Kunifed, A. and J.H. Wandersee, One hundred references related to concept
mapping. Journal of Research in Science Teaching, 1990. 27(10): p. 1069-1075.
2. Dennis, R.A., The effects of feedback cues, relevant information, and scoring
procedures on concept mapping performance. 1999, U California, Los Angeles,
US.
3. Herl, H.E., Construct validation of an approach to modeling cognitive structure
of experts' and novices' United States history knowledge. 1996, U California, Los
Angeles, US.
4. Herl, H.E., et al., Reliability and validity of a computer-based knowledge mapping
system to measure content understanding. Computers in Human Behavior, 1999.
15(3-4): p. 315-333.
5. Jonassen, D.H., K. Beissner, and M. Yacci, Structural knowledge: Techniques for
representing, conveying, and acquiring structural knowledge. 1993, Hillsdale, NJ,
US: Lawrence Erlbaum Associates, Inc. ix, 265.
6. Markham, K.M., J.J. Mintzes, and M.G. Jones, The concept map as a research
and evaluation tool: Further evidence of validity. Journal of Research in Science
Teaching, 1994. 31(1): p. 91-101.
7. Markow, P.G. and R.A. Lonning, Usefulness of concept maps in college
chemistry laboratories: Students' perceptions and effects on achievement. Journal
of Research in Science Teaching, 1998. 35(9): p. 1015-1029.
8. Novak, J.D., Concept mapping: A strategy for organizing knowledge, in Learning
science in the schools: Research reforming practice., S.M. Glynn and R. Duit,
Editors. 1995, Lawrence Erlbaum Associates, Inc: Hillsdale, NJ, US. p. 229-245. 9. Novak, J.D., Learning, creating, and using knowledge: Concept maps(R) as
facilitative tools in schools and corporations. 1998, Mahwah, NJ, US: Lawrence
Erlbaum Associates, Inc., Publishers. xviii, 251.
10. O'Neil, H.F., Jr., K. Allred, and R.A. Dennis, Use of computer simulation for
assessing the interpersonal skill of negotiation, in Workforce readiness:
Competencies and assessment., H.F.O.N. Jr, Editor. 1997, Lawrence Erlbaum
Associates, Inc., Publishers: Mahwah, NJ, US. p. 205-228.
11. Rice, D.C., J.M. Ryan, and S.M. Samson, Using concept maps to assess student
learning in the science classroom: Must different methods compete? Journal of
Research in Science Teaching, 1998. 35(10): p. 1103-1127.
12. Trent, S.C., et al., Using concept maps to measure conceptual change in preservice teachers enrolled in a multicultural education/special education
course. Remedial & Special Education, 1998. 19(1): p. 16-31.
13. Wallace, J.D. and J.J. Mintzes, The concept map as a research tool: Exploring
conceptual change in biology. Journal of Research in Science Teaching, 1990.
27(10): p. 1033-1052.
14. Williams, C.G., Using concept maps to assess conceptual knowledge of function.
Journal for Research in Mathematics Education, 1998. 29(4): p. 414-421. 15. Novak, J.D., Concept mapping: A useful tool for science education. Journal of
16. Novak, J.D. and D. Musonda, A twelve-year longitudinal study of science concept
learning. American Educational Research Journal, 1991. 28(1): p. 117-153.
17. Heinze-Fry, J.A. and J.D. Novak, Concept mapping brings long-term movement
toward meaningful learning. Science Education, 1990. 74(4): p. 461-472.
18. Novak, J.D., & Gowin, D. B., The use of concept mapping and knowledge Vee
mapping with junior high school science students. Science Education, 1983.
67(5): p. 625-645.
19. Novak, J.D., Concept maps and Vee diagrams: Two metacognitive tools to
facilitate meaningful learning. Instructional Science, 1990. 19(1): p. 29-52.
20. Osmundson, E., Chung, G. K.W.K., Herl, H.E., & Klein, D. C.D., Concept mapping in the classroom: A tool for examining the development of students’
conceptual understanding. 1999, University of California, National Center for
Research on Evaluation, Standards, and Student Testing (CRESST): Los Angeles. 21. Ruiz-Primo, M.A. and R.J. Shavelson, Problems and issues in the use of concept
maps in science assessment. Journal of Research in Science Teaching, 1996.
33(6): p. 569-600.
22. Ruiz-Primo, M.A., Shultz, S. E., Li, M., & Shavelson, R. J., Comparison of the Reliability and Validity of Scores From Two Concept-Mapping Techniques Concept-Map Representation of Knowledge Structures: Report of 2 Year
Activities. 1998, University of California, Center for Research on Evaluation,
Standards, and Student Testing: Los Angeles.
23. Ruiz-Primo, M.A., Schultz, S. E., & Shavelson, R. J., Concept map-based
assessment in science: Two exploratory studies. 1997, University of California,
Center for Research on Evaluation, Standards, and Student Testing: Los Angeles. 24. Baker, E.L., M. Gearhart, and J.L. Herman, Evaluating the Apple Classrooms of
Tomorrow[superscript]SM, in Technology assessment in education and training.,
E.L. Baker and H.F.O.N. Jr, Editors. 1994, Lawrence Erlbaum Associates, Inc: Hillsdale, NJ, US. p. 173-197.
25. Herl, H. and R.A. Dennis. The effects of knowledge representation technique on
mathematics understanding of ethnically diverse students. in American
Educational Researchers Association. 1992. Atlanta, Georgia.
26. Ousterhout, J., The state of Tcl. UNIX Review's Performance Computing, 1999.
17(9): p. 43, 45, 47.
27. Ousterhout, J., Extensibility in Tcl. Dr. Dobb's Journal, 1999. 24(6): p. 64, 66, 68-72.
28. Ousterhout, J., Integration platforms: the missing link in enterprise computing.
WEB Techniques, 1999. 4(5): p. 73-4, 76.
29. Ousterhout, J.K., Tcl and the Tk toolkit. Addison-Wesley Professional
Computering Series, ed. Addison-Wesley. 1994, Massachusetts: Addison-Wesley. 458.
30. Ousterhout, J.K., Scripting: higher level programming for the 21st Century.
Computer, 1998. 31(3): p. 23-30.
31. Dennis, R.A. and S.S. Gambhir, Internet Question and Answer (iQ): A
Web-Based Survey Technology. IEEE Transactions on Information Technology in
32. Dennis, R.A., K. Huang, and A. Khatri, Surveys, Tests, and Decision Support
Systems a complete solution based on free open-source tools, in Arsdigita Systems
Journal. 2000, Arsdigita.
33. Lerner, V., Dennis , R., Herl, H., Novak, J., & Niemi, D., Computerized
Methodology for the evaluation of level of knowledge. Cybernetics and Systems: