BATCH CO-REGISTRATION OF MARS HIGH-RESOLUTION IMAGES TO HRSC
MC11-E MOSAIC
Panagiotis Sidiropoulos and Jan-Peter Muller
Imaging Group, Mullard Space Science Laboratory, Dept. of Space and Climate Physics, University College London, Holmbury St Mary, Surrey, RH5 6NT, UK - (p.sidiropoulos, j.muller)@ucl.ac.uk
Commission IV, WG IV/8
KEY WORDS: Automated co-registration, orthorectification, mosaic, MC11-E quadrangle, DTM, high-resolution data fusion
ABSTRACT:
Four NASA missions over the last forty years with onboard instruments for high-resolution orbital imaging have achieved both global coverage (with 6m CTX, 20m THEMIS-VIS and >8m Viking Orbiter cameras) as well as imaging with very high resolution in specific regions of interest (e.g. 25cm HiRISE and ≈1.5-12m MOC-NA cameras). Overall, this set of cameras have acquired more than 400,000 high-quality images of Mars with resolution between 25cm/pixel and 100m/pixel (Sidiropoulos and Muller, 2015). On the other hand, ESA has sent the only high-resolution stereo photogrammetric camera around Mars, HRSC onboard the Mars Express spacecraft, which has been mapping the Martian surface since 2004 with a resolution of 12.5 m/pixel (Jaumann et al., 2015). Initially the raw images are combined through an elaborate photogrammetric process to get (single-strip) 3D products (i.e. digital terrain models (DTMs) and derived orthorectified images (ORIs)). However, recently the processing chain has changed, and the single-strip product release was temporarily halted to be replaced by the production and release of mosaics of Mars quadrangles. The first product of this kind is the mosaic for the East part of quadrangle MC11 (i.e. the MC11-E mosaic), a product with 12.5 metres per pixel resolution in the panchromatic image and 50 metres per pixel resolution in the corresponding DTM (Gwinner et al., 2015).
Such a product provides an excellent basemap to co-register and orthorectify all NASA high-resolution (≤100m/pixel) orbital images. The need for this co-registration to HRSC comes from their poor areo-referencing, which often leads to large deviations (reaching up to several kilometres) between the area they are supposed to image and the area they are actually imaging. After co-registration, all products are projected onto an common 3D coordinate system, which allows an examination of dynamic features of Mars through the changes that happen on its surface. In this work, we present the results of the batch co-registration of all NASA high-resolution orbiter images of MC11-E, i.e. almost 8,000 images in total. This task was conducted with an in-house pipeline which was modified in order to handle the different parameters of the mosaic in comparison to single-strip HRSC products and to process the large input data volumes within a realistic time. An outline of the processing pipeline is given, along with examples of co-registered images and statistics of the co-registration performance. We demonstrate how such a time series representation of the surface will open up new areas for exploration and understanding of the Martian surface.
.
1. INTRODUCTION
Viking Orbiter 1, which was launched in August 1975, was the first orbiter which had on board TV cameras that could acquire high-resolution images of the Martian surface, reaching a resolution of 8m/pixel (Soffen and Snyder, 1976). Actually, Viking Orbiter 1 and Viking Orbiter 2 were the first missions that provided a medium-resolution global mosaic of Mars, while covering more than 22% of Mars with images of resolution finer than 100m/pixel (Sidiropoulos and Muller, 2015a). After Viking Orbiter, the Martian surface was mapped by high-resolution images from 4 more NASA cameras:
• Mars Orbiter Camera – Narrow Angle (MOC-NA) (Malin et al., 2010), onboard Mars Global Surveyor (MGS) that was launched in November 1996 (Albee, 2001). MOC-NA was active from 1997 up to 2006, acquiring more than 95,000 high-resolution images with resolution from 1.5m to 12m per pixel.
• The visible sub-system of the Thermal Emission Imaging System (THEMIS-VIS) (Christensen et al., 2004) which is onboard Mars Odyssey. Since 2002, THEMIS-VIS has acquired more than 200,000 high-resolution images of the Martian surface, with
resolution from 17.5 to 75 metres per pixel.
• Context Camera (CTX) (Malin et al., 2007), which is onboard Mars Reconnaissance Orbiter (MRO) that was launched on August 2005. Since 2006 CTX has acquired more than 65,000 images, covering more than 80% of Mars, with a resolution of approximately 6 metres per pixel.
• High-Resolution Imaging Science Experiment (HiRISE) (McEwen et al., 2007), which is also onboard MRO and has achieved the best spatial resolution so far. HiRISE data cover more than 1.4% of Mars with resolution as fine as 25cm per pixel.
This shortcoming is mitigated by ESA’s High Resolution Stereo Camera (HRSC) (Scholten et al., 2005), which is onboard the ESA Mars Express mission. HRSC is by construction a stereo photogrammetric imager, acquiring a nadir image and 2 oblique views at the same time, with the nadir image having a maximum resolution of 12.5 metres per pixel at periapsis whilst the most oblique is usually set at 25 metres per pixel resolution due to data bandwidth constraints. These views are then input to an elaborate processing chain developed at DLR (see Putri, Sidorpoulos and Muller, this conference), which outputs a Digital Terrain Model (DTM), with 50 m/pixel resolution and a derived HRSC orthorectified image (ORI), typically with 12.5 m/pixel resolution. HRSC has covered almost 50% of the Martian surface with such 3D products (Gwinner, private communication, 2016).
The aforementioned plethora of Mars high-resolution NASA images, more than 400,000 images, can be used to explore dynamic surface phenomena of Mars, i.e. to analyse the temporal evolution of certain areas that reveal natural processes that happen over time. The latter can be roughly classified into two classes; those that happen in a seasonal manner, i.e. in specific Martian seasons, (e.g. Recurring Slope Lineae (RSLs) (McEwen et al., 2011) and events that do not follow some iterative pattern but are rather sporadic (e.g. new impact craters (Byrne et al., 2009)).
In order to perform this analysis, all images should be geometrically consistent with each other, i.e. to be mapped onto the same coordinate system. On the other hand, even though all missions record and release metadata, including the calculated location of Mars that the high-resolution camera is pointing towards, small pointing errors often trigger large mis-registration errors, i.e. differences between the nominal and the actual location. We have found in practice that such mis-registration errors may reach the order of hundreds of pixels, and even exceed 1,000 pixels.
It is easy to understand that such a discrepancy hinders a straightforward comparison between images that supposedly map the same Mars region, since each image is actually in its own coordinate system. The standard way to deal with this problem is to perform a repetitive and often manual co-registration of the input images into the same coordinate system. For example, such a process was followed for the production of the mosaic of MC11-E rectangle of Mars (Gwinner et al, 2015) from 89 input images from the HRSC camera. The fact that the total amount of high-resolution Martian data is 3 orders of magnitude larger than this illustrates the limitations of such an approach.
We have developed an automated processing technique that performs co-registration of high-resolution images into a common baseline, determined by the HRSC orthorectified dataset. Apart from being fully automatic, this processing chain can be used in a batch-mode, so as to efficiently process huge numbers of input high-resolution images. As a matter of fact, this processing chain is currently being used within the EU FP7 project iMars to co-register as many of the high-resolution images of Mars as possible. Before passing onto the full-scale processing of the 50% of the Martian surface covered by HRSC mapped 3D products, the pipeline was initially tested on a new HRSC mosaic generated over the MC11-E quadrangle.
2. MC11-E COVERAGE
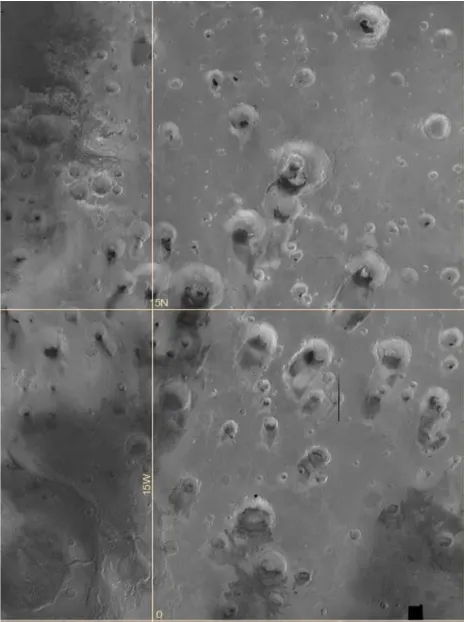
MC11-E is the East half of the Oxia Palus quadrangle, extending between 0 and 30 degrees North and 0 and 22.5 West (or 337.5 to 360 degrees East). MC11-E contains a number of the most geologically interesting regions of Mars, such as Chryse Planitia, Xanthe Terra, Mawrth Vallis, Meridiani Planum, etc. (Figure 1).
In June 2015, the HRSC team released a mosaic of MC11-E, with a panchromatic resolution of 12.5m/pixel, a colour mosaic at 50m/pixel while the corresponding DTM has a resolution of 50m/pixel (Gwinner et al, 2015). This mosaic used single-strip images and 3D points generated from individual strips as an input, which were subsequently passed by an elaborate processing chain, which included bundle block adjustment (Bostelmann and Heipke, 2015) and radiometric correction (McGuire et al., 2016).
Figure 1. A snapshot of the MC11-E quadrangle mosaic that was released by the HRSC team. Visit www.i_mars.eu to explore in more detail.
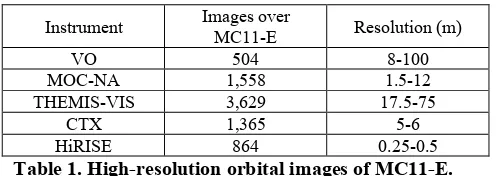
Instrument Images over
Table 1. High-resolution orbital images of MC11-E.
3. CO-REGISTRATION METHOD
The developed pipeline was designed to achieve batch-mode co-registration of high-resolution images, therefore it incorporates methods that try to balance the minimisation of time, without compromising the spatial accuracy. Most importantly, it avoids the use of computationally too demanding co-registration methods based on pixel cross-correlation or adaptive least-squares correlation (e.g. Otto and Chau, 1989), which exhibit good accuracy but are too slow to be used in this context. Instead, image matching is based on the extraction of feature points from both the high-resolution input image and the HRSC nadir image and their subsequent matching.
It should be noted that even the employed descriptor, which determines feature matching, was the original Scale Invariant Feature Transform (SIFT) (Lowe, 2004). However, since SIFT is not a descriptor tailored for remote sensing (let alone, planetary) images, a number of adjustments were made to boost its performance. One of the most important was the introduction of geometrical constraints to the SIFT point matching process, as discussed in (Sidiropoulos and Muller, 2015a). This reduced significantly the algorithm’s computational time, while at the same time increased the number of estimated control points. Apart from that, the pipeline makes use of multiple copies of both the level-2 and level-1 version of the input high-resolution image, which are created by varying the sampling rate, the image orientation, etc., in order to maximise the number of the control points.
The control points, which are the intermediate results of this stage are in pixel coordinates, both for the input image and for the HRSC level-4 nadir image. In the next stage of the algorithm, the areo-referencing information of the HRSC nadir image and of the corresponding HRSC DTM are used so as to transform the 2D pixel coordinates of the HRSC control points to 3D world coordinates. Thus, a number of correspondences between the input high-resolution pixels and their position in 3D world coordinates are established.
These are used to estimate a camera model for the input image, which subsequently determines the projection of the input image into the common coordinate system. The employed camera model is a combination of a rigorous camera model and a polynomial model. The rigorous camera model depends on the type of instrument that acquired the image, i.e. whether it is a frame camera (as in Viking Orbiter images) or a pushbroom camera (as in most Mars high-resolution images). The estimated camera model is the one that is finally used to produce the output of the processing chain, i.e. the orthorectified version of the input high-resolution orbital image. The co-registration method is summarised in Figure 2.
4. EXPERIMENTAL RESULTS
We have tested our automatic co-registration method on MC11-E high-resolution imagery summarised in Table 1. In order to
evaluate the pipeline performance, we have used three measures:
• Failure Rate: The percentage of images that the automatic pipeline failed to produce any results. • Accuracy: The median average accuracy in X and Y
dimensions, i.e. the expected average mis-registration error for an image.
• Computational Time: The average processing time, using single-core threads on 16-core machines with 1.6GHz CPU and 48Gb of RAM.
We have successfully finished the processing of CTX, MOC-NA and THEMIS-VIS products. Viking Orbiter and HiRISE processing is still pending. The results for the datasets that have been completed can be found in Table 2.
Inputs: (1) High-resolution (≤100m) input image to be co-registered to (2) HRSC Level-4 ORI (3) HRSC DTM
Step 1: Tie-points are extracted from the downsampled input image and from a downsampled HRSC ORI. The downsampling resolution is determined by the abundance of features in the imaged area.
Step 2: Tie-points are matched according to the coupled decomposition algorithm [4].
Step 3: Outliers are discarded via RANSAC.
Step 4: The initial matching-point set gives a translation value between the two images, which aligns the images.
Step 5: Tie-points are extracted from the full-resolution input NASA image and from the full-resolution HRSC ORI.
Step 6: The images are split into tiles and the tie-points that belong to each tile are matched independently from the others. Multiple tile sizes are used to handle both misalignment and image pairs with different low-level pixel values.
Step 7: Outliers are discarded via RANSAC.
Step 8: Coordinates of matches in the HRSC are transformed from 2D pixel coordinates to 3D “world coordinates”.
Step 9: The correspondences of the input image points in pixel coordinates to 3D world coordinates are used to estimate a rigid camera model
Step 10: The residuals are modelled with a polynomial model. Step 11: The combination of the rigid camera model and the polynomial model are used to estimate the co-registered input image.
Output: (1) The co-registered image (2) The camera models (3) Image footprint (4) Tie-points
Figure 2. Multi-instrument co-registration pipeline.
Figure 2 shows the developed algorithm which has been able to handle the batch-mode processing of large amounts of input data, with an accuracy that is close both to the accuracy achieved by the tedious manual co-registration of each individual image and by the computationally demanding cross-correlation automatic techniques. For example, by extrapolating the MOC-NA processing time it can be deduced that the whole dataset of 95,966 MOC-NA images could be processed by a single 16-core machine in 4 months.
Instrument MOC-NA THEMIS-VIS CTX Failure Rate
(%) 34.55% 19.83% 7.25%
ErrX (m) 5.334 7.012 6.487
Time (min) 29 26 331 Table 2. Statistics of the batch-mode automatic co-registration of high-resolution image to the HRSC MC11-E mosaic
It should be noted that the failure rate seems to be aligned with the product quality of different instruments. MOC-NA is the oldest camera of the three while CTX the newest and the one that produces images with the highest quality. This apparent correlation is an early indication that the failure of the system is not caused by design faults in the pipeline but by poor quality comparable to mosaics produced by bundle adjustment gives evidence of the potential of the developed co-registration technique.
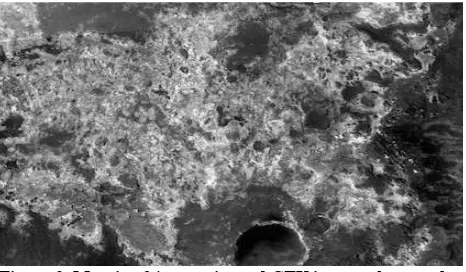
Figure 3. Mosaic of 4 co-registered CTX images that overlap with MC11-E quadrangle. The images are the following: T01_008847_2056,P22_009682_2048, B09_13229_2047 and B09_13295_2047
5. FUTURE WORK
Assuming that the MC11-E co-registration of Viking Orbiter and HiRISE products will not reveal currently unknown shortcomings, the pipeline is close to completion. The next step is to use the multi-instrument co-registered images to conduct multi-instrument automatic batch-mode change detection. This pipeline is currently under development, and is expected to be demonstrated during the next few months. Apart from change detection, we plan to extend the co-registration pipeline to include more data, including spectral data and infrared cameras data.
ACKNOWLEDGEMENTS
The research leading to these results has received partial funding from the STFC “MSSL Consolidated Grant” ST/K000977/1 and partial support from the European Union’s Seventh Framework Programme (FP7/2007-2013) under iMars grant agreement n˚ 607379. bundle adjustment with HRSC imagery, ISPRS Working Group IV/8 Planetary Mapping and Spatial Databases Meeting.
Byrne, S., C. Dundas, M. Kennedy, M. Mellon, A. McEwen, S. Cull, I. Daubar, D. Shean, K. Seelos, S. Murchie, B. Cantor, R. Arvidson, K. Edgett, A. Reufer, N. Thomas, T. Harrison, L. Posiolova and F. Seelos. 2009. Distribution of mid-latitude ground ice on Mars from new impact craters, Science, 325 Odyssey Mission, Space Science Reviews, 110 (1), pp. 85-130.
Gwinner, K., Jaumann, R., et al.. 2015. The first Quadrangle of the Mars Express HRSC multi-orbit data products (MC11-E), European Planetary Science Congress.
Jaumann, R., Muller, J-P., et al., 2015. “Quantifying geological processes on Mars—Results of the high resolution stereo camera (HRSC) on Mars express,” Planetary and Space
Science, vol. 112, no. C, pp. 53–97, Jul. 2015.
Lowe, D.G. 2004. Distinctive image features from scale-invariant keypoints, International Journal of Computer Vision, vol. 60, no. 2, pp. 91–110.
Malin M. C., Bell J. F., Cantor B. A., Caplinger M. A., Calvin W. M., Clancy R. T., Edgett K. S., Edwards L., Haberle R. M., James P. B., Lee S. W., Ravine M. A., Thomas P. C., and Wolff M. J. 2007. Context camera investigation on board the mars reconnaissance orbiter, Journal of Geophysical Research: Planets, 112 (E5)
Malin M. C., Edgett K. S., Cantor B. A., Caplinger M. A., Danielson E., Jensen E. H., Ravine M. A., Sandoval J. L. and Supulver K. D. 2010. An overview of the 1985-2006 Mars Orbiter Camera science investigation, Mars, 5, pp. 1-60
McEwen A., Eliason E., Bergstrom J., Bridges N., Hansen C., Delamere W., Grant J., Gulick V., Herkenhoff K., Keszthelyi L., Kirk R., Mellon M., Squyres S., Thomas N. and Weitz C. 2007. Mars reconnaissance orbiter’s high resolution imaging science experiment (HiRISE). Journal of Geophysical Research: Planets, 112 (5)
McEwen, A., L. Ojha, C. Dundas, S. Mattson, S. Byrne, J. Wray, S. Cull, S. Murchie, N. Thomas and V. Gulick. 2011. Seasonal Flows on Warm Martian Slopes, Science, 333 (6043), pp. 740-743
McGuire, P.C., Audouard, J., Dumke, A., Dunker, T.,, Gross, C., Kneissl, T., Michael, G., Ody, A., Pouler, F., Schreiner, B., van Gasselt, S., Walter, S. H. G., Wendt, L., Zuschneid, W. 2016. True- and false-color HRSC+OMEGA image mosaics of Mars, 47th Lunar and Planetary Science Conference.
Otto, G. P., and Chau, T. K. 1989. A region-growing algorithm for matching of terrain images, Image and Vision Computing, vol. 7, no. 2, pp. 83–94.
processing-Methods and operational aspects. Photogrammetric Engine Remote Sensing, 71, pp. 1143–1152
Sidiropoulos, P., and Muller, J.-P. 2015a. Matching of large images through coupled decomposition, IEEE Transactions on Image Processing, vol. 24, no. 7, pp. 2124–2139.
Sidiropoulos, P. and Muller, J.-P. 2015b. On the status of orbital high-resolution repeat imaging of Mars for the observation of dynamic surface processes, Planetary and Space Science, Vol. 117, pp. 207-222.
Soffen, G. A., and C. W. Snyder. 1976. First Viking mission to Mars, Science, 193, pp. 759-766