POTENTIAL OF MULTI-TEMPORAL OBLIQUE AIRBORNE IMAGERY FOR
STRUCTURAL DAMAGE ASSESSMENT
A. Vetrivel*, D. Duarte, F. Nex, M. Gerke, N. Kerle, G. Vosselman
University of Twente, Faculty of Geo-Information Science and Earth Observation (ITC), P.O. Box 217, 7500 AE, Enschede, The Netherlands
{a.vetrivel, d.duarte, f.nex, m.gerke, n.kerle, george.vosselman}@utwente.nl
Commission III, WG III/4
KEY WORDS: Oblique airborne images, 3D Point Cloud, Structural damage, Change detection, Classification
ABSTRACT:
Quick post-disaster actions demand automated, rapid and detailed building damage assessment. Among the available technologies, post-event oblique airborne images have already shown their potential for this task. However, existing methods usually compensate the lack of pre-event information with aprioristic assumptions of building shapes and textures that can lead to uncertainties and misdetections. However, oblique images have been already captured over many cities of the world, and the exploitation of pre- and post-event data as inputs to damage assessment is readily feasible in urban areas. In this paper, we investigate the potential of multi-temporal oblique imagery for detailed damage assessment focusing on two methodologies: the first method aims at detecting severe structural damages related to geometrical deformation by combining the complementary information provided by photogrammetric point clouds and oblique images. The developed method detected 87% of damaged elements. The failed detections are due to varying noise levels within the point cloud which hindered the recognition of some structural elements. We observed, in general that the façade regions are very noisy in point clouds. To address this, we propose our second method which aims to detect damages to building façades using the oriented oblique images. The results show that the proposed methodology can effectively differentiate among the three proposed categories: collapsed/highly damaged, lower levels of damage and undamaged buildings, using a computationally light-weight approach. We describe the implementations of the above mentioned methods in detail and present the promising results achieved using multi-temporal oblique imagery over the city of L’Aquila (Italy).
1. INTRODUCTION & RELATED WORKS
Structural damage assessment is an imperative process to be carried out immediately after the disaster event for effective planning and execution of response and recovery actions. Assessing building damages over large areas affected by hazard events with ground observations is not efficient. Alternatively, remote sensing-based approaches have been recognized as useful means for assessing synoptic building damage. Detailed information of an affected area can be provided in a short time using a variety of sensors such as optical, SAR and LiDAR (Khoshelham et al., 2013; Miura et al., 2013; Uprety and Yamazaki, 2012). In particular airborne oblique images have been recognized as a valuable data source to assess building damages because, compared to traditional nadir views, they allow the complete inspection of the external outlines of the building, such as roofs and façades (Murtiyoso et al., 2014). Nowadays, airborne images are captured with high overlap, and the generated point clouds can be exploited in the damage assessment process as well (Sui et al., 2014). Geometrical deformations such as partial/complete collapse, pancake collapse, inclination, broken and dislocation of elements can be easily derived by 3D geometric information, while damages such as cracks and spalling can be inferred from the images directly. Several papers have highlighted the potential of synergistic use of 3D point cloud and images for building damage assessment (Gerke and Kerle, 2011; Vetrivel et al., 2015). However, only few studies have looked at the use of digital oblique aerial imagery for structural damage assessment, and were focused on (mono-temporal) post-event information (Gerke and Kerle, 2011; Vetrivel et al., 2015). The major limitation of this approach is that
* Corresponding author.
damage is inferred based on a set of ontological assumptions: i.e. a surface with unusual radiometric or geometric characteristics is assumed to be damaged, while manmade objects are assumed to have a regular shape and uniform radiometric characteristics. These assumptions have limitation in complex environments, leading to a high rate of false alarms, which reduces their reliability and operational utility. In Vetrivel et al. (2015), damages presenting regular and uniform shapes (false negative), or intact regions characterized by cluttered and non-uniform radiometric distributions (false positive), were incorrectly classified due to these assumptions.
The above uncertainties can be alleviated if pre-event data are available for reference. Many studies have demonstrated the potential of multi-temporal data for damage assessment, though with most focusing on nadir-view images (Dong and Shan, 2013; Murtiyoso et al., 2014). To our knowledge, no methods have been reported yet for identifying building damages using multi-temporal oblique images and/or 3D point clouds.
The paper addresses two independent objectives:
The development of a methodology to identify severe building damages related to geometrical deformation, using multi-temporal oblique images and 3D point clouds. To this end three different change detection methods are proposed to identify building elements that are geometrically deformed between the two epochs. Subsequently, a change classification method is proposed to identify the geometric deformation of an element marked as damaged.
The analysis of multi-temporal oblique images for identifying the damages along façades which are often not well modelled in the generated point clouds.
The detailed description of the methodologies and the results achieved on the test area of L’Aquila (Italy) will be presented in detail.
2. DATA DESCRIPTION
The data used are corresponding to the city of L’Aquila, Italy in which an earthquake occurred on 6th April 2009. The data consist of two airborne oblique acquisitions (August 2008 and May 2009) covering the city with both oblique (4 cameras) and nadir (1 camera) imagery, captured by small format DSLR cameras. Images were acquired at a flying height of approximately 1000 m allowing for an average ground sampling distance of 16 cm on oblique views. The flight was conducted considering a forward overlap between 60-70% and side overlap between 35-45%, allowing to derive a 3D point cloud. The registration was achieved computing tie-points from all the imagery, forcing both epochs to share a local coordinate system. Dense image matching was then performed separately on both epochs.
3. POINT CLOUD BASED DAMAGE DETECTION AND CLASSIFICATION
3.1 Methodology
Any severe structural damage, such as partial or complete collapse, pancake collapse, dislocated or inclined elements, leads to the absence of the given elements in their actual 3D boundary in the pre-event data. These damaged elements are referred to missing elements. The missing structural elements can be identified by comparing the accurately co-registered multi-temporal (pre and post-event) 3D point clouds. However, the absence of pre-event segments in post-event 3D point clouds may be due to many reasons, such as occlusion/a building part being exposed to a lower number of camera views, or poorly textured surfaces, leading to missing 3D points. On the other hand, an element can be missing because it was damaged or cleared deliberately. Therefore, it is important to infer the reasons for the absence of a pre-event element in the second epoch data after detecting them.
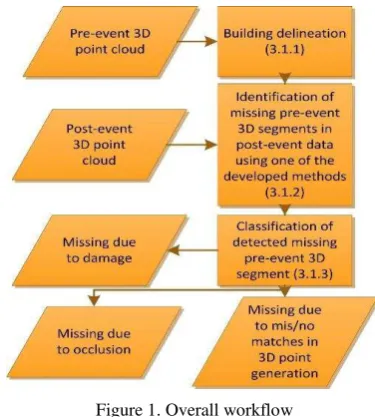
The missing elements due to damage are detected using the pre- and post-event images and 3D point clouds derived from them by three pipeline processes (cf. Figure 1). As an initial step, the individual buildings in the area are delineated from the pre-event 3D point cloud. Subsequently, the delineated buildings in the pre-event data are compared to the post pre-event 3D point cloud to detect changes. Finally, the changes are classified to isolate the changes caused by damage. The detailed methodology to carry out the aforementioned processes is described below.
Figure 1. Overall workflow
3.1.1 Building delineation from 3D point cloud: In remote sensing data, the roof segments are the most visible and least cluttered building elements. Moreover, they can be recognised based on simple geometric constraints. For instance, the roof segments are mostly elevated horizontal or slanted planar surfaces with respect to ground. Hence, in this study the roof-based building delineation approach roof-based on 3D point clouds is adopted. Moreover, this method has previously shown reliable results (Vetrivel et al., 2015). The procedure followed is described below.
The 3D point cloud is segmented using planar segmentation as described by Vosselman (2012). The segments with Z component of the plane normal > TZ (0.4) and above height TH (3 m)are labelled as roof segments. The spatially connected roof segments are identified by defining the alpha shapes with an alpha radius of TR (0.3). Finally, the 3D points that are covered by single alpha shapes are delineated as roofs of a single building. Also, all the 3D points that lie within the 2D boundary of the alpha shape are registered as the 3D points of the building, i.e. all 3D points that lie below the roof elements are also registered as the 3D points of the building.
3.1.2 Change detection to identify the missing building elements in post event: The pre-event building elements that are missing in the post-event point cloud are identified using the following three approaches. To provide a clear understanding of the proposed methods, they are illustrated with examples from the data used and results obtained from our experimental study. Also, the pros and cons, and appropriate scenario that make a particular method suitable, are discussed.
clouds. To overcome this problem the spatial buffers along the horizontal and vertical directions with buffer thresholds of THB (0.5 m) and TVB (1.0 m), respectively, are created for each voxel occupied with the pre-event 3D points. These voxels are classified as unchanged voxels if post-event 3D points lie within the buffer area; otherwise they are classified as changed voxels. Finally, the pre-event 3D points of the changed voxels are detected as 3D points of missing building elements and considered for the further change classification process. The overall process of this approach is shown in Figure 2.
Pros: In many cases photogrammetric point clouds are very noisy, hindering the recognition of individual building elements. In such cases, this approach is more suitable as it does not need any prior information or assumptions about the building, unlike the segment-based approaches discussed below.
Cons: The presence of artefact 3D points, common in photogrammetric point clouds in unfavourable image flight configurations, strongly affect the performance of this approach. Moreover, in specific scenarios, it cannot detect or accurately delineate the missing portion of the element, since the voxels are classified in a binary fashion, i.e. whether or not they contain a certain element. Therefore, even if only a minor portion of a voxel is occupied by an element, it will be classified as occupied voxel. Hence this results in a failure to detect missing elements that characterises the remaining majority portion of the voxel. Since it does not consider the geometry of the elements it may fail to detect the damages in specific scenarios. For example, consider a horizontal roof segment is missing and the below vertical elements are visible. In such a case, this approach may fail as the 3D points of the vertical elements fall into the voxels of the missing elements when the voxel and its buffer sizes are significantly large. Moreover, this approach is computationally intensive.
Figure 2. Workflow of voxel-based approach
Segment-based approach (SBA): In general, most buildings are made of a composition of planar segments. Hence, we anticipate that comparison of pre- and post-event data based on planar segments will help to precisely identify changes on element level. This would also lead to more object-oriented analysis compared the voxel-based approach. However, direct comparison of 3D segments that are obtained from independent segmentation of pre and post-event is not always practically possible. This is because, though the 3D point clouds of the two epochs are segmented using the same segmentation algorithm, in practice it is not always feasible to obtain the same segments even for corresponding areas. This is predominantly due to varying noise level between point clouds. Therefore, we propose a method where the pre-event point cloud alone is segmented and the corresponding segments in the post-event are derived based on the event segments. This is done by fitting a plane to pre-event 3D segment and, subsequently, the post-pre-event 3D points that lie within the plane-offset of TD (1.0 m) to be derived as post-event segment. Then the missing (damaged) portions of pre-post-event segments are identified by comparing them with the corresponding derived post-event segments. Only the segments with an area greater than TA (5 m2) are considered for the change detection process. The overall procedure of this approach is shown in Figure 3.
Pros: Compared to the voxel-based approach it is 1) less sensitive to artefacts, 2) more robust in detection and accurate delineation of missing elements, and 3) computationally less demanding.
Cons: This approach fully depends on the performance of the planar segmentation algorithm. The planar segmentation fails to produce accurate segmentation for portions of point cloud corresponding to very high noise, and also for regions of non-planar elements.
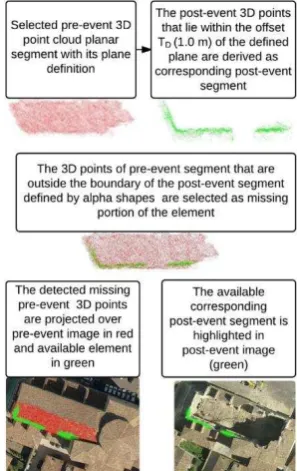
Figure 3. Overall workflow of segment-based approach
and segmented together using a plane-based segmentation algorithm (although any segmentation method can be used). Therefore, the corresponding segments in the two dataset share the same segment label, which facilitates direct comparison between them. Thereby the completely and partially missing elements can be identified in simple and faster way than in the above proposed methods. The proposed change detection strategy is described below.
The pre-event segments that have no corresponding segment in the post-event point cloud represent the completely missing segments. This can be obtained in a single step by a simple set difference: i.e. suppose sets A and B are the segment label lists of pre and post-event epoch, respectively, then the completely missing segments are obtained by A-B (set difference).
To identify the partially missing segments select the corresponding segments in the pre- and post-event data and define the boundary for the post-event 3D segment using the alpha shapes. The pre-event 3D points that lie outside the defined boundary are considered as the missing portion of the pre-event segment in the post-event data.
Pros: It is faster and simple than the other two proposed methods.
Cons: The choice of segmentation algorithm is critical as it should detect building elements of different geometry (planar and no-planar) and robust to varying noise levels between the point clouds. It is also highly vulnerable to co-registration errors of multi-temporal point clouds.
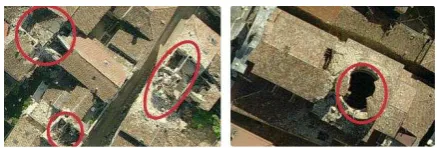
3.1.3 Change classification (inferring reason for change): In general, the disappearance of a building element due to damage will lead to two kinds of scenarios: 1) the absence of certain elements will create an opening, leading to a visibility of the element below it. Therefore, there will be a new surface (3D points) in the post-event data, corresponding to this disappeared element (cf. Figure 4), or 2) the disappearance of partial elements may create a hole in the structural element which appear darker due to poor radiometric reflection (cf. Figure 4). This is termed as structural holes and it will be a gap in the 3D point cloud. However, gaps in 3D point clouds may also be caused by mis/no matches in 3D point generation (e.g., poorly textured surfaces) and occlusions. Therefore, it is important to distinguish between these gaps to identify the ones caused by damage. As the image radiometry plays a major role here, we used pre- and post-event images in addition to point clouds for the change classification process. The procedure for inferring the reasons for the absence of pre-event element in post-event is described below.
Figure 4. Example of element collapses leading to an opening with the surface below it visible (left) and not visible, i.e.
structural holes (right) are highlighted in red circles.
Case 1: Element missing due to occlusion/partial visibility: The pre-event 3D points missing in the post-event data due to occlusion can be identified by analysing the visibility of those points in the post-event camera views. This is done by adding the
missing pre-event 3D points to the post-event point cloud. Subsequently, the visibility of 3D points in each post-event camera view is estimated using the Hidden Point Removal operator (HPR) (Katz et al., 2007). Finally, the newly added pre-event 3D points that are visible in less than ‘N (3)’ camera views (post-event cameras) are removed by labelling them as occluded points, and the remaining pre-event 3D points are classified as visible points and considered for further change classification process.
Case 2: Element missing due to damage and mis/no matches in 3D point generation: The change classification is preferred to be performed at segment level, as manmade objects are largely composed of planar/regular elements, thus it helps to reduce false decisions. The segment-based approaches will directly provide the 3D points of missing element in terms of segments. However, for the voxel-based approach, it will provide the collection of independent pre-event 3D points that are absent in the post-event situation. Therefore, the 3D points obtained from the latter are grouped into dis-jointed 3D segments based on their spatial connectivity, using the alpha shapes for further processing. A rule-based approach is adopted and a set of rules is defined to classify the missing elements into the aforementioned scenarios. This classification approach is independent from the methods used to detect missing elements and is described below. Element missing due to damage and the surface below it is visible: The rule for this class is defined below and illustrated in Figure 5.
Rules: The post-event 3D points should be present within the 2D boundary (change boundary) of the missing pre-event 3D segment. Also the post-event points and pre-event 3D segment should be visible in the same post-event camera. Also the area covered by the post-event 3D points should be of similar size compared to the area of the missing pre-event segment (at least cover 30 %).
Pre-event element missing in post-event due to damage (structural hole) or mis/no matches in 3D point generation: In contrast to the above scenario, if the change-boundary does not contain a significant number of post-event 3D points then the radiometric characteristics of the change boundaries in the pre- and post-event data are compared by delineating them in the corresponding images. If they are not similar and if the post-event image surface appears significantly darker compared to the pre-event one, then it is classified as damage (structural holes), otherwise it is classified as mis/no matches in 3D point generation. The grey-value (image pixel value) based histogram is used as a feature to compare the radiometric characteristics as it is well proven and widely used region-level image descriptors (Wenjing et al., 2006).
Figure 6. Example for missing 3D segment classified as (structural hole) caused by damage.
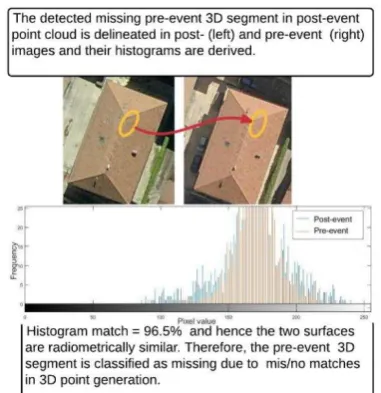
Figure 7. Example for missing 3D segment classified as mis/no matches in 3D point generation.
Rules: If the correlation between the histograms of the pre and post-image regions is less than THD (0.75) they are considered to be radiometrically dissimilar. If the histogram peak of the post-event image patch corresponds to grey values <TG (50 lower grey value) then the pre-event 3D segment is classified as element missing due to damage (structural holes) in the post-event. If above constraints are not satisfied then the missing pre-event element is classified as element missing due to mis/no matches in 3D point generation. The illustrations of these two classes are depicted in Figure 6 and Figure 7.
3.2 Results
3.2.1 Data used: three subsets of building blocks from different parts of the city were considered for the damage detection process, containing a total of 48 buildings. Of those 23 building elements are identified as either completely or partially missing in the post event data due to damage. The pre-event 3D point clouds of the considered sub-blocks are shown in Figure 8.
Figure 8. Pre-event 3D point clouds of the sub-blocks considered for damage assessment.
3.2.2 Results of building delineation: All 48 buildings are detected using the method described in section 3.1.1 and they are categorized into three cases: 1) Buildings that were delineated with close approximation to the actual boundary (# 36); 2) buildings with some portions not delineated (# 7); 3) single buildings detected as multiple buildings, particularly the buildings with multi-level roofs. (#5). A sample result for building delineation is shown in Figure 9.
Figure 9. Image subset of airborne image (left) and delineated buildings based on 3D point cloud are projected over the image (right).
Figure 10. The detected missing pre-event segments using composite segment-based approach are projected as red points over a pre-event image (left), and outlined in the post-event
Table 1. The results of missing pre-event 3D segments detected by all three approaches.
3.2.4 Results of change classification: For the change classification process, the missing elements identified by the segment-based approach were considered (cf. Table 1 ). Case 1: Element missing in the post-event data due to occlusion: only one segment that was very small (area < 5m2) was identified as missing in the post-event data due to occlusion (cf. Table 1), and it was classified correctly and removed from the further classification process.
Case 2: Element missing due to damage and mis/no matches in 3D point generation: The results of the change classification process are provided in Table 2. In total all 20 elements that are missing due to damage were classified correctly. Among the three non-damaged missing elements two were correctly classified as mis/no matches in 3D point generation. The remaining one was misclassified as damage related to structural hole as it was affected by shadow in the post-event data.
Predicted
Actual Damage Non-damage
Damage 20 0
Non-damage 1 2
Recall =100% ; precision= 95.23% and accuracy= 95.6%
Table 2. Results of classification of missing 3D segments detected by segment-based approach
The final outcome of the overall process is the report for each building that shows the area and boundary map of each missing elements of the building due to damage. For example, Figure 11 depicts the area and outline of each missing elements for a images are noisy. However, the noise level varies from place to place as they are susceptible to the radiometric characteristics of the surface. Therefore, the places corresponding to very noisy 3D points were not segmented well, and because of this three (out of 23) damaged elements were not detected by both segment-based approaches (cf. Table 1). The voxel-based approach has not detected six damaged elements. This is due to its limitations that are highlighted in the cons of the voxel-based approach (cf. 3.1.2). The change classification (cf. 3.1.3) is a straightforward approach which correctly classified the missing elements due to earthquake damages or man-made changes. The classification of mis/no matches failed just in one case, in correspondence of a shadowed building element that was wrongly classified as structural hole.
4. MULTI-EPOCH FACADE IMAGE CORRELATION FOR DAMAGE ASSESSMENT
The objective of the following method is to automatically detect building façade changes by comparing their radiometric values. It will lay the ground for further developments focusing first on the extraction and rectification of the image patches containing the façades, followed by the comparison itself, and considering three main categories: highly damaged or collapsed façades, lower levels of damage (changes), and undamaged buildings.
4.1 Method
from the intermediate category, lower levels of damage, are still the most critical to be automatically interpreted, and they are classified as changes in the current method implementation.
Figure 12. Example of two pre- and post-event subsets of oblique images containing the façade (above) and respective rectified images (below).
4.2 Results
This section presents the results according to the categories defined earlier. As explained before the intra-epoch radiometric comparison will serve as reference value for the inter-epoch comparison. The undamaged case will be assessed first (Figure 13). It will be followed by an example posing the possible intra-epoch differences between the extracted image patches from two distinct images (Figure 14), given the problems addressed in the previous section. The inter-epoch comparison will then be addressed considering damage related changes (Figure 15) and other changes (Figure 16). Finally, the collapsed building case will be depicted (Figure 17).
Considering the façade presented in Figure 13, the correlation coefficient was 0.78 intra-epoch and 0.75 inter-epoch. This similarity can categorize this façade as unchanged and consequently not damaged.
Figure 13. Same façade extracted from both epochs. a) and b) relative to pre-event and c) post event.
Figure 14 represents another façade element in which the intra-epoch correlation coefficient is lower than in the former example. The balconies which are not in the defined plane, are hence consequently wrongly rectified. Different illumination settings are also noticeable on the shadows of the shown rectified patches. The global correlation value on the façade is therefore very low (0.51) and the correlation values are extremely low (darker areas) in correspondent balconies and associated shadows (Figure 14, rightmost part)
Figure 14. Pre-event rectified image patches and corresponding correlation coefficient.
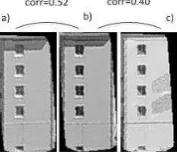
In Figure 15, the intra-epoch correlation coefficient is 0.52 and inter-epoch correlation is 0.40. In this case low correlation values
are mainly due to the lack of texture in a large portion of the façade and different position of the shadows in the images; in the inter-epoch case, the value is further decreased by the presence of a large spalling area on the façade.
Figure 15. Hazard-related changes. Same façade extracted from both epochs. a) and b) relative to pre-event and c) post event.
Not all changes are damage related as can be seen in Figure 16. Here the intra- and inter-epoch correlation coefficients were 0.66 and 0.33, respectively. Unlike the latter case, the changes which decreased the correlation coefficient are not hazard related and are due to the removal of banners present in the pre-event.
Figure 16. Changes not hazard related. Same façade extracted from both epochs. a) and b) relative to pre-event and c) post event.
However, correlation values are completely different in the case of complete collapses. The façade shown Figure 15 is considered in an inter-epoch comparison: the mean of the correlation coefficient drops drastically (from 0.51 to 0.04) indicating directly the presence of a collapsed building (Figure 17). This can be performed for several façades to confirm the outcome of the categorization, as collapsed, for the whole building.
Figure 17. Total collapse example, rectified images on both epochs and correlation coefficient matrix.
4.3 Discussion
nonetheless, the multi-temporal component can certainly aid in the definition of such interval.
5. CONCLUSION AND OUTLOOK
In the presented paper, two independent methodologies were developed to identify the structural damages by utilizing both 2D and 3D information derived from multi-temporal, pre- and post-event oblique images.
The first method of the paper focussed on developing methods to identity structurally deformed elements due to damage using the pre- and post-event images and 3D point cloud. The developed methods produced significant results, particularly, the segment-based approaches detected 87% (20 out of 23) of geometrically deformed elements, and all of them were correctly classified as damaged by the proposed change classification approach. However, while the proposed methods can identify the structurally deformed elements due to damage, they cannot infer the type of structural deformation, such as dislocation, inclination, complete collapse or pancake collapse. Generally, any missing structural element in the pre-event data will emerge as a new element (at least debris) in the post-event epoch. These newly emerged post-event elements can be identified by detecting the missing elements from the post- to pre-event data using any one of the proposed change detection methods. A semantic analysis by mapping of corresponding missing pre-event and the newly emerged post-pre-event elements would help to infer the specific reason of structural deformation. This would be the logical extension of this work.
The planar segmentation was adopted to derive segments in the segment-based change detection approaches. It often failed to provide accurate segmentation for very noisy and non-planar regions in the 3D point cloud, which hindered the assessment for those regions. However, numerous point-cloud segmentation methods have been developed which utilize the contextual information, the image-radiometric and points cloud-geometric information in combination, and which provide better segmentation for noisy and non-planar regions (cf. Anh and Bac (2013)). Adopting such segmentation coupled with our proposed composite segment-based approach can yield better assessment.
The second presented methodology aims at comparing building façades at an image level, in order to infer the presence of damages on them. A rough distinction between the three proposed damaged levels using a fast approach has been demonstrated. However, due to the variability of light conditions and different point of views, the correct selection of damages on the façades still remains a challenge. For now the method does not include a visibility analysis to automatically select building façades without occlusions in the images: this will be added in the following implementation. Actually, areas in which large variations of visibility changes occurred or showing non-planar elements like in-/extrusions can already indicate candidates for damaged areas. The ones that are present in just an epoch will have to be carefully assessed. These variations in the occlusion can have its origin in the data acquisition itself, another example can be vegetation changes or the modification of the urban configuration. A segmentation of the building façade (in 2D and 3D) will be performed on the façades in order to detect and remove windows and balconies, restricting the change search on the facade walls. The shadow detection will be addressed as well. This method does not need the computation of point clouds from different epochs but only co-registered images. Already existing 3D city models could be used to define (and rectify) the façade position, strongly reducing the time needed in the damage map generation since there is no need to generate a point cloud. It would also allow not only the integration of the damage results
with the city model itself but also to ease an integration with damage maps from other sources.
ACKNOWLEDGEMENTS
The work was funded by two FP7 projects: 1) RECONASS (Reconstruction and Recovery Planning: Rapid and Continuously Updated Construction Damage and Related Needs Assessment; grant no 312718); 2) INACHUS (Technological and Methodological Solutions for Integrated Wide Area Situation Awareness and Survivor Localisation to Support Search and Rescue Teams;grant no 607522).
REFERENCES
Anh, N., Bac, L., 2013. 3D point cloud segmentation: A survey. 6th IEEE Conference on Robotics, Automation and Mechatronics (RAM),, 12-15 Nov. 2013, pp. 225-230.
Dong, L., Shan, J., 2013. A comprehensive review of earthquake-induced building damage detection with remote sensing techniques. ISPRS Journal of Photogrammetry and Remote Sensing, 84, pp. 85-99.
Gerke, M., Kerle, N., 2011. Automatic structural seismic damage assessment with airborne oblique pictometry imagery. Photogrammetric Engineering & Remote Sensing, 77 (9), pp. 885-898.
Katz, S., Tal, A., Basri, R., 2007. Direct visibility of point sets. ACM Transactions on Graphics (TOG), 26 (3), pp. 24.
Khoshelham, K., Oude Elberink, S., Sudan, X., 2013. Segment-based classification of damaged building roofs in aerial laser scanning data. IEEE Geoscience and Remote Sensing Letters, 10 (5), pp. 1258-1262.
Miura, H., Midorikawa, S., Kerle, N., 2013. Detection of building damage areas of the 2006 Central Java, Indonesia, earthquake through digital analysis of optical satellite images. Earthquake spectra, 29 (2), pp. 453-473.
Murtiyoso, A., Remondino, F., Rupnik, E., Nex, F., Grussenmeyer, P., 2014. Oblique aerial photography tool for building inspection and damage assessment. ISPRS Archives of Photogrammetry, Remote Sensing and Spatial Information Sciences, XL-1, pp. 309-313.
Rupnik, E., Nex, F., Remondino, F., 2014. Oblique multi-camera systems - orientation and dense matching issues. ISPRS Archives of Photogrammetry, Remote Sensing and Spatial Information Sciences, 50 (3/W1), pp. 107-114.
Sui, H., Tu, J., Song, Z., Li, Q., 2014. A novel 3d building damage detection method using multiple overlapping UAV images. ISPRS International Archives of the Photogrammetry, Remote Sensing and Spatial Information Sciences, XL-7, pp. 173-179.
Uprety, P., Yamazaki, F., 2012. Detection of building damage in the 2010 Haiti earthquake using high-resolution SAR intensity images. Journal of Japan Association for Earthquake Engineering, 12 (6), pp. 21-35.
Vetrivel, A., Gerke, M., Kerle, N., Vosselman, G., 2015. Identification of damage in buildings based on gaps in 3D point clouds from very high resolution oblique airborne images. ISPRS Journal of Photogrammetry and Remote Sensing, 105, pp. 61-78. Vosselman, G., 2012. Automated planimetric quality control in high accuracy airborne laser scanning surveys. ISPRS Journal of Photogrammetry and Remote Sensing, 74, pp. 90-100.