Effect of misting on transpiration and
conductances of a greenhouse rose canopy
N. Katsoulas
a, A. Baille
b,1, C. Kittas
a,∗aSchool of Agriculture, Crop and Animal Production, University of Thessaly, Pedion Areos, 38334 Volos, Greece bInstitut National de la Recherché Agronomique, Unité de Bioclimatologie, Site Agroparc, 84914 Avignon Cedex 9, France
Received 7 March 2000; received in revised form 31 July 2000; accepted 17 August 2000
Abstract
The influence of greenhouse humidity control on the transpiration rate (λEc), sensible heat flux (Hc) and bulk stomatal conductance (gc) of a soilless rose canopy (Rosa hybrida, cv. First Red) was studied in a greenhouse located in the coastal area of eastern Greece. Measurements were carried out during several days in the summer (i) without air humidity control and (ii) with a mist system operating when the relative humidity of the greenhouse air was lower than 75%. The diurnal course ofgcwas determined from the relation linkingλEcto canopy-to-air vapour pressure deficit (Dc) or from inversion of the Penman–Monteith equation. The two ways of estimatinggcwere in good agreement, showing a significant increase of
gcunder mist conditions. Covariation of radiation and humidity during the day caused diurnal hysteresis inλEcandgc. The hysteresis phenomena were less marked when the mist system was operating. Normalisinggcby radiation removed most of the hysteresis and indicated a curvilinear stomatal response to vapour pressure deficit. The analysis of the energy partition at the canopy showed high negative values of the Bowen ratio (β≈ −0.7) in both conditions, indicating that canopy transpiration played a major role in cooling the greenhouse atmosphere. The contribution of the mist system to total evaporative cooling was estimated to be about 20%, with only 40–50% of the mist water being effectively used in cooling. Calculation of the crop water stress index confirmed that the crop was less stressed under misting conditions. It was concluded that the prediction of short-term variations ofλEcandgcin greenhouse environments must account for the magnitude and diurnal variation of air VPD. © 2001 Elsevier Science B.V. All rights reserved.
Keywords:Rose; Greenhouse; Transpiration; Humidity; Bulk conductance; Mist system
1. Introduction
In Mediterranean countries, high temperature (T >
35◦C) and vapour pressure deficit (VPD>3 kPa) are currently observed in greenhouses during summer.
∗Corresponding author. Tel.:+30-421-74255;
fax:+30-421-74270.
E-mail addresses: [email protected], [email protected] (A. Baille), [email protected] (C. Kittas).
1Present address: Department of Food and Agricultural Engi-neering, Universidad Politecnica de Cartagena, Paseo Alfonso XIII, 30203, Cartagena, Spain.
These conditions are responsible for the decrease in yield and quality of greenhouse production. Various methods for cooling the greenhouse atmosphere may be used to maintain more suitable conditions for plant growth. Natural ventilation is usually the first step due to its low cost and simplicity, but is generally not suf-ficient for extracting the excess energy during sunny summer days (Baille, 1999). Therefore, other cooling methods must be used in combination with ventila-tion. One of the most efficient solutions for alleviating the climatic conditions is to use evaporative cooling systems, based on the conversion of sensible heat into
latent heat by means of evaporation of water sup-plied directly into the greenhouse atmosphere (mist or fog system, sprinklers) or through evaporative pads (wet pads). Evaporative cooling allows simultaneous lowering of temperature and vapour pressure deficit (Cohen et al., 1983; Arbel et al., 1999; Willits, 1999) and can lead to greenhouse air temperatures lower than the outside air temperature. Its efficiency is higher in dry environments, but it also gives satisfactory results in humid coastal environments (Montero et al., 1990; Montero and Segal, 1993). The advantage of mist and fog systems over wet pad systems is the uniformity of conditions throughout the greenhouse, therefore eliminating the need for forced ventilation and airtight enclosure.
Concerning rose plants response to evaporative cooling, Plaut et al. (1979) observed a significant improvement of flower quality under evaporative cooling conditions. However, Plaut and Zieslin (1977) reported that canopy wetting decreased transpiration rate and increased the diffusive resistance to water vapour transfer. More recent works have focused on the effect of mist systems on crop transpiration (tomato: Boulard et al., 1991; rose: Baille et al., 1994). The latter authors found that the use of a mist system strongly affects the diurnal course of transpiration (λE) and VPD. Particularly, the diurnal hysteresis betweenλEand VPD, orλEand solar ra-diation (Rs), was modified. A more detailed study of
this phenomena would supply useful information on the effect of air VPD on the physiological response of the crop. In this paper we investigated the effects of a mist system on canopy transpiration and water vapour conductance (gc) and compared the results
with the case of a non-misted greenhouse.
2. Materials and methods
2.1. Greenhouse facilities and plant material
The experiments were carried out during August 1998 in a 200 m2 experimental glass-covered green-house, N–S oriented, located at the University of Thes-saly near Volos (latitude 39◦44′, longitude 22◦79′, altitude 85 m) on the coastal area of eastern Greece. The geometrical characteristics of the greenhouse were as follows: eaves height=2.9 m, span angle=
20◦, total width=6.5 m, total length=31 m, ground area(Ag)=200 m2, volume(Vg)=690 m3. During
the period of measurements (summer 1998), the cover was whitened with white-paint on 15th of June in order to alleviate the radiation load inside the greenhouse. Two methods were used for greenhouse cooling: 1. Natural ventilation only, by means of a
continu-ous roof vent (Fig. 1). Due to the high outside temperature during the periods of measurements, the roof vent was opened at 100% from 9:00 to 19:00 h.
2. Natural ventilation associated with evaporative cooling. During some periods of the summer, a mist system, installed in the greenhouse, was opera-ted in order to maintain 75% relative humidity during the day.
The evaporative cooling equipment was a high-pressure water misting system, consisting of two fan and mist modules (Fig. 1), each module covering the cooling needs for 100 m2. The fans, in vertical posi-tion, provided a good air mixing and homogeneity of water distribution inside the greenhouse. A circular ring with eight nozzles for the distribution of atomised water was placed above the fan outlet. Each module had a rate of about 45 l h−1 at the working pressure
(50 bar) and the duration of misting was for 48 s every minute. Thus, the rate of misted water was 36 l h−1
per 100 m2 of ground area or 10−4l s−1 per m2 of ground area. If all the misted water was evaporated the equivalent amount of latent heat would represent the evaporative cooling potential of the misting sys-tem, which is calculated as the total rate of misted water multiplied by the latent heat of vaporisation of water. Thereby, by the use of misting system, an evaporative cooling potential of 245 W per m2 of ground area was allowed. The system was controlled through a humidity sensor (hygrostat) and operated whenever the relative humidity was lower than 75%. During operation of the mist system the roof vent was opened at about 20% of its maximum aperture.
Fig. 1. Schematic plan of the experimental rose greenhouse and meteorological instruments: Rs,a, Rs,b = pyranometers; Rn=net pyrradiometer;Ti,ei=psychrometer.
practised by growers, in order to maintain optimal conditions of water supply to the plants.
The plants were grown following the “bending” technique (Kool and van de Pol, 1996), which consists in bending the stems that are not considered useful to flower production. This technique allows to obtain more leaf area for sustaining photosynthesis and in-creasing the contribution of the canopy transpiration to greenhouse cooling. The leaf area of the bent shoots was approximately 70–80% of the total canopy leaf area. During the period of measurements, the area of ground covered by the crop, (projected leaf area), (Ac)
was about 100 m2, thus giving a ratiop=0.5 for the
fraction of soil covered by the crop.
2.2. Measurements
The following climatic data inside the greenhouse were recorded:
• internal temperature (Ti, ◦C) and vapour pressure
(ei, kPa), by means of a psychrometer located in the
middle of the greenhouse at the level of the upper bent shoots (0.50 m),
• incoming solar radiation over and under the rose crop (Rs,aandRs,b, respectively, W m−2) by means
of two solar pyranometers,
• net radiation over the crop (Rn, W m−2), by means
of a net pyrradiometer.
Simultaneously to the measurements of inside cli-matic variables, outside variables were recorded: solar radiation, air temperature and vapour pressure (Rs,o, To, andeo, respectively), and wind speed.
Leaf temperature (Tl) was measured by means of
copper-constantan thermocouples, (wire diameter =
0.1 mm). The thermocouple junctions were glued to the back side of leaves. The canopy temperature (Tc)
was calculated as the mean value of measurements on seven healthy and mature leaves distributed randomly along the different layers of the canopy (bent shoots and flower stems).
The leaf area index (LAI: m2 leaf m−2 ground)
was estimated from leaf length measurements (L, cm). After laboratory estimation of leaf area, a simple relationship linking the area S (cm2) of a leaf to its lengthL(cm) was established:
S=0.26L2 (1)
During the period of measurements, the leaf area index referred to Ac (LAIc) was about 4.
Transpira-tion rate was measured every 10 min by means of a weighing lysimeter (Fig. 1), located in a central row of the greenhouse compartment. The device included an electronic balance (scale capacity = 12.1 kg, resolution = ±0.1 g) equipped with a tray carrying two plants, and an independent system of water supply and drainage. Considering that the evaporation loss from the perlite substrate was negligible, the weight loss measured by the electronic balance was assumed equal to the crop transpiration. In the following, we expressed the transpiration with respect to the area of ground covered by the crop (λEc, W m−2).
2.3. Calculations
2.3.1. Aerodynamic conductance of the canopy The sensible heat flux (Hc, W m−2) exchanged
between the canopy and the air was estimated from
Hc=Rn−λEc (2)
assuming that the absorbed net radiation was equal to the net radiation measured above the crop. This as-sumption could be considered valid as the LAI was high (=4) and the bent shoots of the plants covered completely the alleys between rows. Like λEc, Hc
referred to the area of ground covered by the crop. The aerodynamic conductance, ga, was calculated
from the relationship linkingHc to the canopy-to-air
temperature difference,δTc=Tc−Ti. By convention, λEc is considered positive, and Hc is positive when Tc> Ti, therefore
ga= Hc ρCpδTc
(3)
2.3.2. Total and stomatal conductance of the canopy The total canopy conductance to water vapour transfer, gt (mm s−1), was estimated from the direct
formula:
λEc= ρCp
γ gtDc (4)
whereλ is the latent heat of vaporisation (J g−1), γ
the psychrometric constant (kPa K−1),ρ andC p are
respectively the density (kg m−3) and specific heat
(J kg−1K−1) of air, D
c the canopy-to-air VPD. The
bulk stomatal conductance,gc, was derived from the
knowledge ofgtandga from gc=
gagt ga−gt
(5)
The estimation ofgcwas also performed by inversion
of the Penman–Monteith equation:
vapour pressure deficit atTi. 2.3.3. Bowen ratio
The canopy Bowen ratio was estimated as β = Hc/λEc
2.3.4. Crop water stress index
The crop water stress index (CWSI) was calculated as proposed by Jackson et al. (1981). The highest pos-sible temperature a canopy can achieve (TM) is given
by
TM=Ti+ Rn
gaρCp (7)
The lower limit,Tm, was assumed to be achieved
for a maximum canopy conductance, gM, and was
calculated as
Tm=Ti+
(1/ga+1/gM)(Rn/ρCp)−Di/γ
1+∆/γ +ga/gM (8)
Then, CWSI was given by
W = Tc−Tm TM−Tm
(9)
3. Results
The results presented in the following section concerned two consecutive 3-day periods of measure-ments obtained during August 1998.
• a sunny period without misting (19–21 August), • a sunny period with misting (25–27 August).
The data were averaged on 30 min and covered the period 8:00–19:00 h local time. Solar noon corre-sponded approximately to 13:30 h solar time.
3.1. Outside conditions
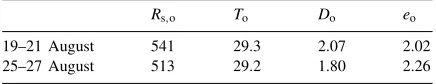
The characteristics of outside climatic variables (average over the period 8:00–19:00 h local time) dur-ing the two periods are presented in Table 1. There were no significant differences in outdoor conditions between the two periods.
3.2. Inside microclimate
The daily variation of the air VPD is presented in Fig. 2. The average greenhouse air temperature between 8:00 and 19:00 h was about 32◦C without misting, and about 29.6◦C when the mist system was
Fig. 2. Air vapour pressure deficit (Di) versus hour of the day: (s) 19–21 August, no-misting; (d) 25–27 August, misting. Table 1
Average values (period 8:00–19:00 h) of outside climate parameters during the periods of measurements without misting, 19–21 August 1998, and with misting 25–27 August 1998a
Rs,o To Do eo
19–21 August 541 29.3 2.07 2.02
25–27 August 513 29.2 1.80 2.26
aR
s,o =solar radiation (W m−2);To =air temperature (◦C); eo=vapour pressure (kPa);Do=vapour pressure deficit (kPa).
operating. The average air VPD during the same time interval was respectively near 2.7 and 1.1 kPa.
3.3. Transpiration rate
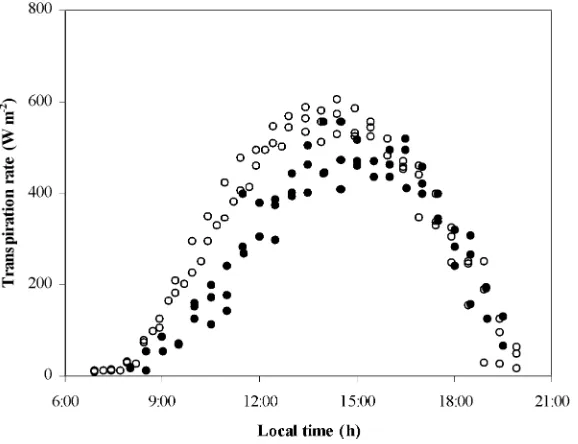
The daily variation of the canopy transpiration rate,
λEc, is presented in Fig. 3. It can be observed thatλEc
was lower under misting conditions, but the difference was relatively small, reaching about 10–15% on a daily scale. The highest difference was mainly seen during the morning period.
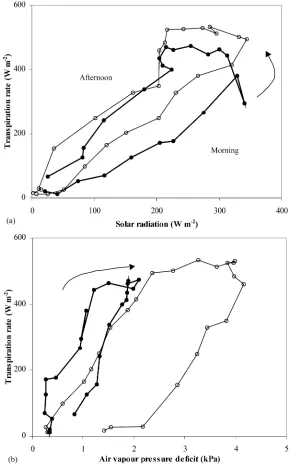
The dependence ofλEc versus solar radiation and
Fig. 3. Canopy transpiration rate (λEc) versus hour of the day: (s) 19–21 August, no-misting; (d) 25–27 August, misting.
radiation while clockwise in the case of air VPD. It can be seen that misting affected only slightly the rela-tion betweenλEcand solar radiation, while modifying
strongly the relation betweenλEcand air VPD.
3.4. Canopy-to-air temperature difference
Fig. 5 shows the variation of the canopy-to-air tem-perature difference,δTc, versusDi. Under misting, the
data appeared to follow a unique trend, represented by the continuous straight line. The linear regression ob-tained with all points (n=67), when the mist system was used, was
δTc=0.99−1.49Di, R2=0.85 (9)
When the mist system was off, different trends can be distinguished with respect to the period of day: (i) during the morning until 10:00 h, the points were close to the regression line obtained under misting condi-tions (ii) after 10:00 h until 17:00 h,δTc continued to
decrease, but more slowly (dashed arrow) and (iii) in the late afternoon,δTc reversed the tendency and
be-came less negative (dotted arrow), reaching slightly positive values at sunset.
3.5. Sensible heat flux and Bowen ratio
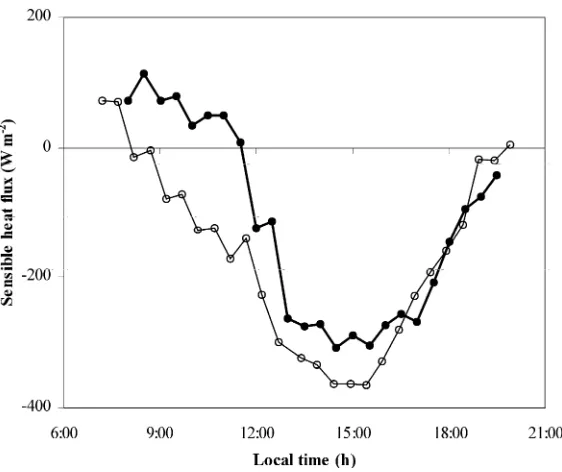
Fig. 6 presents the diurnal variation of the sensi-ble heat flux,Hc, on days 19 August (no-misting) and
27 August (misting). It can be seen thatHc reached
very large negative values, with maximum at about
−360 and −300 W m−2 respectively for no-mist and
mist conditions. On averageHcwas about 100 W m−2
lower under misting than under no-misting conditions, the difference being greatest in the early morning. The diurnal variation of the Bowen ratio (Fig. 7) was sim-ilar in the two treatments after 12:00 h. Except on the early morning β was found negative and relatively constant throughout the day (β≈ −0.6–0.7).
3.6. Bulk aerodynamic conductance
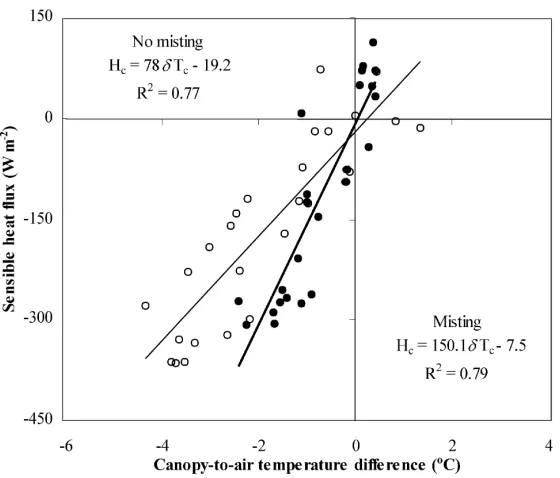
The relationship betweenHc andδTc is shown in
Fig. 8 for the days 19 and 27 August. It can be seen that the relationships were approximately linear, with the following regression equations:
No-mist : Hc=78.0δTc−19.2, R2=0.77
Fig. 4. (a) Canopy transpiration rate (λEc) versus solar radiation (Rs,a): (s) 19 August, no-misting; (d) 27 August, misting. (b) Canopy
transpiration rate (λEc) versus air vapour pressure deficit (Di): (s) 19 August, no-misting; (d) 27 August, misting.
The slope of the regression lines supplied an es-timation of the average bulk aerodynamic conduc-tance, with ga = 62 and 120 mm s−1 in no-misting
and misting conditions, respectively. Similar lin-ear trends were observed for the other days, with
some slight variations in the fitted coefficients (slope and offset). For each day, an average value of ga was calculated in this way and used
Fig. 5. Canopy-to-air temperature difference (δTc) versus air vapour pressure deficit (Di). The measurements were made from 8:00 to 19:00 h. (—) misting (all day long during 27 August), and no-misting during the morning till 10:00 h (19 August), (- - -) no-misting 10:00 to 17:00 h (19 August), (- - - - -) no-misting 17:00 to 19:00 h (19 August); (s) 19 August, no-misting, (d) 27 August, misting.
Fig. 7. Bowen ratio (β) versus hour of the day: (s) 19 August, no-misting; (d) 27 August, misting.
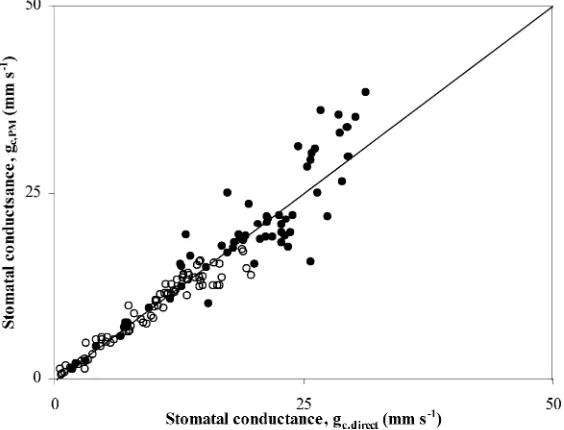
Fig. 9. Comparison of the bulk stomatal conductance derived from the Penman–Monteith formula (gc,PM) versus the one obtained by the direct method (gc,direct), Eq. (4): (s) 19–21 August, no-misting; (d) 25–27 August, misting.
3.7. Bulk stomatal conductance
The two ways of estimatinggc (Eqs. (4) and (6))
were in good agreement for both data obtained under misting and no-misting (Fig. 9), with a slope near 1 and a coefficient of determinationR2=0.96 for 147 observations. In the following, the direct estimation fromλEc(Eq. (4)) was used for the bulk canopy
con-ductance.
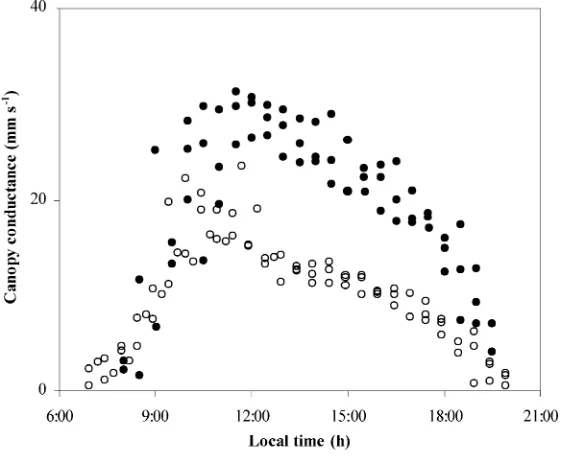
The diurnal variation ofgcunder mist and no-mist
conditions is presented in Fig. 10. In both cases, an initial sharpen increase in gc followed by a more
progressive decrease in the afternoon was observed. The maximum canopy conductance under misting was about 30 mm s−1 (or 7.5 mm s−1 if referred to
unit leaf area) and was reached near 13 h while, under no-mist conditions, the maximum was about 15 mm s−1(or 3.8 mm s−1if referred to unit leaf area) and was reached sooner (11:00 h). Until 10:00 h, gc
was nearly similar with and without misting.
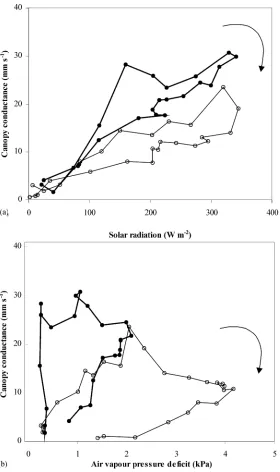
The change in canopy conductance with respect to Rs and air VPD is presented in Fig. 11a and b,
re-spectively. As for transpiration rate, hysteresis were observed between gc and the two climatic variables,
both being clockwise. It can be seen that, for a same
value ofRs or Di,gc was significantly higher in the
morning than in the afternoon.
3.8. Crop water stress index
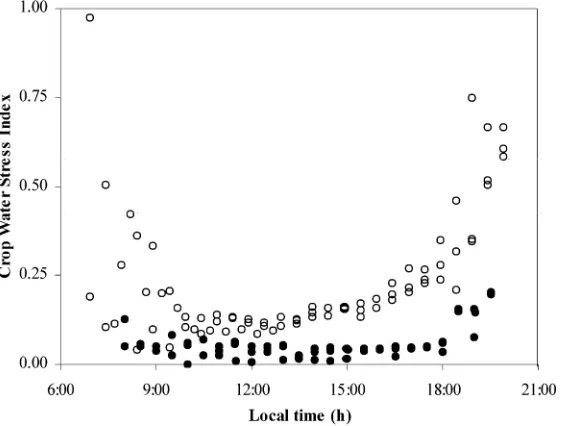
The diurnal variation of CWSI, calculated with
gM =30 mm s−1, is presented in Fig. 12. The higher
values of CWSI in the early morning and late after-noon were due to the low radiation levels and should not be taken into account in the evaluation of the level of water or heat stress. It can be seen that, according to this index, the canopy was not stressed under misting conditions (CWSI near 0) and only slightly stressed under no-mist conditions, with an increase from near 0.10 in the early morning to 0.15 in the late afternoon.
4. Discussion
4.1. Changes in microclimate
Fig. 10. Canopy stomatal conductance (gc) versus hour of the day: (s) 19–21 August, no-misting; (d) 25–27 August, misting.
temperature was also significantly reduced under mist conditions (not shown). These contrasted trends of air temperature and air VPD were expected and confirmed that evaporative cooling is effective for lowering both temperature and air VPD.
4.2. Energy partitioning
The levels of transpiration rate reached by the canopy were very high (up to 600 W m−2, Fig. 3). The
sensible heat fluxHcalso reached high levels (Fig. 6),
as the Bowen ration was about−0.6 throughout the day (Fig. 7). Such high values of λEc andHc,
over-coming the net radiation of the canopy by a factor 2, or even more in the case ofλEc, can be explained by
the “oasis effect” induced by the presence of a large fraction of dry ground (p =0.5) not covered by the canopy (Seginer, 1994). Much of the net radiation absorbed by the uncovered ground was converted into sensible heat and contributed to the transpiration of the canopy. Assuming as a first estimation that the sensible heat of the uncovered dry ground was equal to the net radiationRn, we can deduce that the canopy
has to convert into latent energy a heat load of about 2×Rn, which corresponds roughly to the order of
magnitude ofλEc.
The difference ofHcbetween no-misting and
mist-ing periods was on average about 100 W m−2(Fig. 6).
That means that misting contributed to alleviate the heat load by this amount of sensible energy. As the cooling potential was about 240 W m−2, it can be con-cluded that only a part (about 40–50%) of the mist water contributed to the actual cooling of the green-house. It appears therefore that (i) a significant frac-tion of mist water was probably transferred directly to the outside atmosphere through the aperture of the vents and (ii) the contribution of misting to evapora-tive cooling is only a small fraction (about 0.15–0.25) of the contribution due to canopy transpiration.
It has to be noticed that the average bulk aero-dynamic conductance ga was double under misting
(120 mm s−1) compared to that under no-misting
(about 60 mm s−1). This was due to the effect of the
fan-and-mist system that increased air mixing and turbulence above the canopy.
4.3. Bulk stomatal conductance
The transpiration rate (Fig. 3) was not affected to such an extent as the air VPD by misting. Although
λEc was lower under mist conditions, the difference
con-Fig. 11. (a) Canopy conductance (gc) versus incoming solar radiation (Rs,a): (s) 19 August, no-misting; (d) 27 August, misting. (b)
Canopy conductance (gc) versus air vapour pressure deficit (Di): (s) 19 August, no-misting; (d) 27 August, misting.
ditions was moderate. The maximum values of λEc
observed during the two periods of measurements were relatively close, and occurred at the same hour. This can be explained by the values reached by the bulk stomatal conductance (Fig. 10), which was
Fig. 12. CWSI versus hour of the day. CWSI was calculated withgM=30 mm s−1: (s) 19–21 August, no-misting; (d) 25–27 August, misting.
resistance that allowed the canopy to keep similar levels ofλE.
It has to be pointed out that, during the period with-out misting, the decrease in gc started at the value
of 2 kPa (Fig. 11b), which was reached near 10:00 h. During days with misting, the maximum values ofgc
were reached near 13:00–14:00 h, when air VPD was also near 2 kPa, and decreased afterwards. This critical value of 2 kPa was mentioned by Baille et al. (1994) as a reference value (or set-point) for actuating the mist system in order to avoid stomatal closure.
4.4. Canopy water stress index
The difference between canopy and air temperature as a function of vapour pressure deficit can be used as an index of the water status of the crop (Jackson et al., 1981; Idso et al., 1990). The results presented in Fig. 12 indicate that the canopy was more stressed under no-mist conditions. In Fig. 5 three different phases can be distinguished in the relationship linkingδTcto
air VPD. The first phase, corresponding to the morn-ing period until 10:00–11:00 h, the relationship was nearly the same under mist and no-mist conditions, and could be considered as the “baseline” corre-sponding to no-stress conditions (Idso, 1982). In the
second phase (11:00–17:00 h),δTc under no-misting
conditions still decreased, with increasing air VPD, but the slope of the regression line was lower, there-fore inducing an increase of CWSI. The third phase (after 17:00 h) corresponds mainly to the progressive response of stomata to the steep decrease in radiation, while the more progressive decrease in VPD during this period did not seem to play a major role. These results were consistent with the evolution ofgcversus
time under mist and no-mist conditions (Fig. 9). It can be underlined that the CWSI of the misted canopy was very low (between 0 and 0.05), and that the CWSI values for the no-mist canopy were not very high (maximum of about 0.20 in the late afternoon). The latter suggest that high LAI associated with an adequate water supply was quite effective in avoid-ing strong canopy stress in greenhouse summer con-ditions, even when artificial evaporative cooling was not available.
4.5. Analysis and interpretation of the hysteresis phenomena
The hysteresis of λEc with respect to the
envi-ronmental variablesRs and VPD (Fig. 4) was
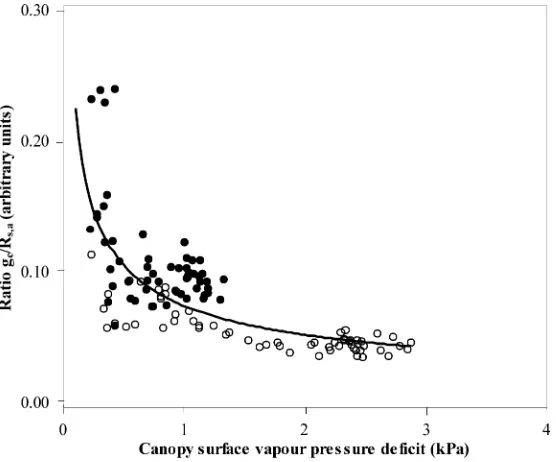
Fig. 13. Normalised conductance,gc∗ (=gc/Rs,a, arbitrary units) against canopy surface vapour pressure deficit,Ds: (s) 19–21 August, no-misting; (d) 25–27 August, misting. The curve is a power function fitted to all data (gc∗=0.0756Ds−0.504,R2=0.62).
et al., 1994). The hysteresis of canopy conductance was previously demonstrated for other species under field conditions, e.g. by Gutierrez et al. (1994), who found similar trends as observed in this study for the transpiration and canopy conductance of coffee hedgerows, and by Takagi et al. (1998), on wetland species. The first authors attributed the diurnal hys-teresis to the effects of covariation of Rs and VPD
on the stomatal response. They presented the results in a non-dimensional form, normalising the canopy conductance by the photosynthetic active radiation,I, and the transpiration rate by the net radiation,Rn. The
normalisation removed the hysteresis and revealed a strong stomatal response to humidity, showing that the normalised conductance,gc∗, decreased
exponen-tially with increasing evaporative demand.
We applied the same type of normalisation to the values of gc obtained in this study. Fig. 13 presents
the relationship betweengc∗(=gc/Rs,a)and the VPD
at the canopy surface,Ds, for misting and no-misting
conditions. The variableDs was chosen as it is
com-monly used as the reference VPD in studies dealing with the response of stomata to humidity (Aphalo and Jarvis, 1993). When all experimental points were
grouped together, we effectively found a curvili-near decrease of the normalised conductance when Ds increases, with a relative high scattering, mainly
due to the data corresponding to misting conditions (Fig. 13).
5. Concluding remarks
In this study, the hysteresis curves observed for tran-spiration rate and canopy conductance versus vapour pressure deficit and radiation were characterised under mist and no-mist conditions. The influence of environ-mental variables on the hysteresis curves was demon-strated and discussed.
In the conditions prevailing during the experiments (summer sunny days, high LAI canopy) the use of a mist system for greenhouse cooling, when compared with no-mist conditions, showed that:
2. The crop physiological status improved as indi-cated by the higher canopy stomatal conductance prevailing under misting conditions, and by the cal-culation of the canopy water stress index.
It was also found that high LAI associated with an adequate water supply was quite effective in avoid-ing strong canopy stress in greenhouse summer con-ditions, even when artificial evaporative cooling was not available.
Finally, the results presented in this study suggest that, in order to accurately predict short-term vari-ations of canopy transpiration rate and conductance from greenhouse environmental conditions, the mag-nitude and diurnal variation of VPD during the day must be accounted for. Therefore, on-line measure-ments of VPD in greenhouse appear to be a pre-requisite for improving irrigation or climate control algorithms based on canopy transpiration predictive models.
References
Aphalo, P.J., Jarvis, P.G., 1993. The boundary layer and the apparent responses of stomatal conductance to wind speed and to the mole fractions of CO2 and water vapour in the air. Plant Cell Environ. 16, 771–783.
Arbel, A., Yekutieli, O., Barak, M., 1999. Performance of a fog system for cooling greenhouse. J. Agric. Eng. Res. 72, 129–136. Baille, A., 1999. Greenhouse structure and equipment for improving crop production in mild winter climates. Acta Hort. 491, 37–47.
Baille, M., Baille, A., Delmon, D., 1994. Microclimate and transpiration of greenhouse rose crops. Agric. For. Meteorol. 71, 83–97.
Boulard, T., Baille, A., Le Gall, F., 1991. Etude de différentes méthodes de refroidissement sur le climat et la transpiration de tomates de serre. Agronomie 11, 543–554.
Cohen, Y., Stanhill, G., Fuchs, M., 1983. An experimental comparison of evaporative cooling in a naturally ventilated
greenhouse due to wetting the outer roof and inner crop soil surfaces. Agric. Meteorol. 28, 239–251.
Gutierrez, M.V., Meinzer, F.C., Grantz, D.A., 1994. Regulation of transpiration in coffee hedgerows: covariation of environmental variables and apparent responses of stomata to wind and humidity. Plant Cell Environ. 17, 1305–1313.
Idso, S.B., 1982. Non-water-stressed baselines: a key to measuring and interpreting plant water stress. Agric. For. Meteorol. 27, 59–70.
Idso, S.B., Pinter, P.J., Reginato, R.J., 1990. Non-water-stressed baselines: the importance of site selection for air temperature and air vapour pressure deficit measurements. Agric. For. Meteorol. 53, 73–80.
Jackson, R.D., Idso, S.B., Reginato, R.J., Pinter, J.R., 1981. Canopy temperature as a crop water stress indicator. Water Resour. Res. 17, 1133–1138.
Kool, M.T., van de Pol, P.A., 1996. Long-term flower production of a rose crop. I. The influence of planting system and rootstock clone. J. Hort. Sci. 71 (3), 435–443.
Montero, J.I., Segal, I., 1993. Evaporative cooling of greenhouses by fogging combined with natural ventilation and shading. In: Proceedings of the International Workshop on Cooling Systems for Greenhouses Agritech, Tel Aviv, Israel, May 2–6, 1993.
Montero, J.I., Anton, A., Beil, C., Franquet, A., 1990. Cooling of greenhouses with compressed air fogging nozzles. Acta Hort. 281, 199–209.
Plaut, Z., Zieslin, N., 1977. The effect of canopy wetting on plant water status, CO2 fixation, ion content and growth rate of “Baccara” roses. Physiol. Plant. 39, 317–322.
Plaut, Z., Zieslin, N., Grawa, A., Gazit, M., 1979. The response of rose plants to evaporative cooling: flower production and quality. Scientia Hort. 11, 183–190.
Seginer, I., 1994. Transpirational cooling of a greenhouse crop with partial ground cover. Agric. For. Meteorol. 71, 265–281. Takagi, K., Tsuboya, T., Takahashi, H., 1998. Diurnal hystereses of stomatal and bulk surface conductances in relation to vapour pressure deficit in a cool-temperate wetland. Agric. For. Meteorol. 91, 177–191.