Turbulent exchange processes within and above a straw mulch.
Part II: Thermal and moisture regimes
Michael D. Novak
a,∗, Wenjun Chen
b, Alberto L. Orchansky
c, Richard Ketler
a aFaculty of Agricultural Sciences, University of British Columbia, 266B–2357 Main Mall, Vancouver, BC, Canada V6T 1Z4bEnvironmental Monitoring Section, Canada Centre for Remote Sensing, 588 Booth St., Ottawa, Ont., Canada K1A 0Y7 cALO-Resources, 2774 William Avenue, North Vancouver, BC, Canada V7K 1Z5
Received 28 June 1999; received in revised form 23 November 1999; accepted 22 December 1999
Abstract
This paper, the second of a two-part series, reports on measurements of thermal and moisture regimes, including sensible and latent heat flux densities, and the complete energy balance made above and within a 10 t ha−1(6.6 cm high) barley-straw mulch
in both normal and artificially wetted states. Soil, mulch, and air temperatures were measured with fine-wire thermocouples, the sensible heat flux was determined with an air renewal model from the cubic structure function of measured air temperature fluctuations, water-vapour pressures were measured within and above the mulch with capacitance sensors, the (energy-limited) latent heat flux below the mulch was measured with a custom-made tension-plate system and latent heat fluxes at heights above the soil surface were determined from additional measurements of weight loss or gain of the mulch elements, net radiation flux was measured above the mulch and downcoming radiation measured below the mulch with thermopile radiometers, soil heat flux was determined with a custom-made thermopile plate installed at the 1 cm depth and corrected for heat storage in the soil above the plate, and heat storage within the mulch was determined from measured mulch element temperatures.
During daytime on fine summer days, the source of the most of the sensible heat flux is in the upper third of the mulch, which corresponds to where the upper-surface mulch element temperature exceeds air temperature. Sensible heat is transferred counter to the local vertical gradient near the middle of the mulch, which puts a lower limit of about 2 cm on the size of the eddies responsible for most of the transfer. Near the bottom of the mulch, the sensible heat flux is small and directed downward, in accordance with the strong air temperature inversion within the mulch. The largest source of latent heat during daytime is from the underlying soil surface except early in the morning when evaporation of dew near the top of the mulch dominates. Turbulence within the mulch enhances latent heat transfer above that due to molecular diffusion by 2–6 times, with mild dependence on wind speed. During nighttime, sensible heat flux within the mulch was small but latent heat flux was a large component in the energy balance, which was attributed in part to the unstable conditions that then existed within the mulch. The sum of sensible, latent, soil, and storage heat fluxes (all measured independently) at all heights within and above the mulch are in good agreement with net radiation flux determined using a radiation transfer model developed for the mulch under normal (non-wetted) conditions.
The largest effect of artificially wetting the mulch was on latent heat flux below the mulch which became negative, indicat-ing condensation, durindicat-ing daytime. For the data after the irrigation, net radiation flux from the radiation transfer model is no longer in good agreement with the sum of sensible, latent, soil, and storage heat fluxes near the bottom of the mulch. Agreement
∗Corresponding author. Tel.:+1-604-822-2875; fax:+1-604-822-8639.
E-mail address:[email protected] (M.D. Novak)
was considerably improved by increasing the residue area, mostly in the lower part of the mulch, which is consistent with the irrigation causing brittle pieces of mulch to break off and fall towards the soil surface. © 2000 Elsevier Science B.V. All rights reserved.
Keywords:Straw mulch; Temperature; Humidity; Energy balance; Turbulent diffusivity
1. Introduction
This is the second in a series of two papers describ-ing turbulent exchange processes in a barley-straw mulch. Mulching is practiced widely in agriculture, forestry, and horticulture because of its many advan-tages, including erosion control, water conservation, soil temperature amelioration, and soil structure en-hancement. Mathematical modelling of the physical effects of mulches is largely limited by our under-standing of turbulent exchange processes within the mulch. For this reason we carried out a detailed mi-crometeorological study of mulching in a series of ex-periments at the University of British Columbia Plant Science Research Station in Vancouver, Canada, that occurred in July–October in each of three consecutive years (1992–1994).
In the first paper (Novak et al., 2000a, hereafter referred to as I) measurements of wind and turbu-lence regimes made within and just above a 10 t ha−1 barley-straw mulch in 1994 are reported. This paper presents the associated thermal and moisture regimes, including sensible and latent heat flux densities, and the complete energy balance within and above this mulch in both normal and artificially wetted states. Turbulent water-vapour diffusivities within the mulch and the overall mulch water-vapour conductance, measured when the underlying soil surface was the only source of moisture, i.e., when only the ‘far-field’ contributed to the resulting profile of vapour pres-sure (Raupach, 1989), are reported. The results allow a test of our recently developed air renewal model for sensible heat flux (Chen et al., 1997, hereafter referred to as CNBL97), which we showed works well above the mulch, to heights within the mulch. The overall objective is to describe the temporal and spatial variations of the thermal and moisture regimes of the barley-straw mulch, emphasizing the role of turbulence in the vertical transfer of sensible and la-tent heat. Other descriptive studies of mulches have been presented in the literature (e.g., Kohnke and
Werkhoven, 1963; Radke, 1982; Bristow, 1988; Bris-tow and Abrecht, 1989; Steiner, 1989; Wagner-Riddle et al., 1996) but our study is unique for its accuracy, breadth, and completeness.
During the late summer and early fall conditions studied, the mulch was dry for much of the daytime, especially in the afternoon, but was quite moist dur-ing nighttime and early morndur-ing because of conden-sation of dewfall from the atmosphere and moisture that evaporated from the underlying soil (Chen and Novak, 1997). To simulate the effects of rainfall, the mulch was thoroughly wetted by sprinkler irrigation and the drying-out phase that followed in the next few days was studied intensively. This also has application to understanding the processes involved in hay drying (Tuzet et al., 1993; Barr and Brown, 1995).
2. Field experiments
2.1. Plot characteristics
Unless indicated otherwise, all data were sampled and averaged every 10 s and 5 min, respectively, in 1993 and every 20 s and 10 min, respectively, in 1994 using a programmable data logger (model CR7, Campbell Scientific Inc., Logan, UT, USA).
2.2. Mulch thermal regimes
Mean air temperature, Ta, was measured simul-taneously at various heights above the soil sur-face, z, within and above the mulch using fine-wire chromel/constantan thermocouples (25mm above the mulch and 76mm diameter within the mulch, for additional robustness) mounted on a 50 cm high, 1.3 cm diameter rod installed vertically in the mulch plot. The thermocouples were placed about 20 cm away from the rod facing into the direction of the prevailing wind (west–northwest). Mean straw ele-ment temperature, Te, was measured simultaneously at six z within the mulch using chromel/constantan thermocouples (250mm in diameter). These thermo-couples were mounted on a shorter vertical rod as for the Ta sensors and each was attached to a selected straw element surface using transparent tape, which not only ensured good contact but also protected the thermocouple from damage. The instrumented mulch elements used were about 3 cm long, 0.5 cm wide, and 0.1 cm thick, and oriented flat in the horizontal plane, typical of the majority of elements in the mulch. The thermocouples were installed on the lower element surfaces in 1994 and on the upper surfaces in 1993. It was thought that this would make little difference as it was expected that the elements would be nearly isothermal, which is usually assumed in mulch mod-els (e.g., Bristow et al., 1986; Bussière and Cellier, 1994). As will be seen later, the lower-surface and upper-surface temperatures did differ greatly, with important consequences for sensible heat transfer from the mulch. Note that daytime upper surface temperatures were likely underestimated using this measurement method as the thermocouple protrudes slightly into lower temperature air and has a higher albedo than the mulch element.
Sensible heat flux density, H, at various z within and above the 10 t ha−1mulch was determined using a renewal model based on the cubic structure function of measured high-frequency air temperature fluctuations,
−(1Ta)3, at eachz(CNBL97), with an added term to account for molecular diffusion, as follows:
H (z)= combined coefficient (0.397 for all z within and above the 10 t ha−1 mulch canopy), (1Ta)3 is sam-pled at a frequency 1/1t=10 Hz, very near the op-timum frequency, using 25mm diameter fine-wire chromel/constantan thermocouples,u∗ is the friction velocity determined from the measured mean ‘cup’ wind speed atz=9.6 cm using Monin–Obukhov simi-larity theory (fully described in I; forz<0.2hthough,
u∗=σw/1.25, where σw is calculated fromu∗ above the mulch using the regression equation presented in I),d′ is an adjusted displacement height (d′=2(h−d) forz>3h−2dandd′=0 forz<0.2h),d=5.7 cm is the displacement height,D′
hmis the molecular diffusivity for heat within the mulch, and dTa/dz is the measured vertical mean air temperature gradient atz. D′
hm is determined as (Hares and Novak, 1992a)
D′hm=Dhm(fe−θ )ft (2)
z=9.6 cm was measured with a custom-made hot-wire anemometer (I). Theαβ2/3γ=0.397 was determined by calibrating H calculated with Eq. (1) for four z
above the mulch against H determined by the en-ergy balance method of the whole mulch (CNBL97), i.e., H=Rn−G0−SH,6−λE, where Rn is the net ra-diation flux density, G0 is the soil surface heat flux density, SH,6 is the sensible heat stored in all the mulch elements, and λE is the latent heat flux den-sity, all measured as described further on. The cali-bration was done by a best fit for all half hours in a single day, 16 August 1994, with the resulting fit shown in Fig. 4 of CNBL97 (note that the date indi-cated in this figure is in error; also the bare soil data in this figure uses DST, 1 h later, instead of PST as indicated).
2.3. Mulch moisture regimes
Mean water-vapour pressure in the air,ea, was mea-sured at various z within and above the mulch us-ing capacitance-type relative humidity sensors (model HMM-20D, Vaisala Inc., Helsinki, Finland). Each sen-sor had a 75mm diameter chromel/constantan ther-mocouple installed within its protective cap near it to convert relative humidity to vapour pressure. To im-prove the response time of the sensor, which is about 15 s (90% response) when the protective cap (6 cm long and 1.2 cm in diameter) and its membrane filter are installed, and prevent abnormal readings when the filter is wet from condensation within the mulch, we removed the filter and cut away the bottom half of the cap. Slots in the remaining half of the cap were filled in and the outside of the cap was painted white. The net effect was that the relative humidity sensor was better ventilated while still being shielded from so-lar irradiance (at least at high soso-lar elevation angles) and protected from rainfall and dewfall. In addition, its response time was shortened to below 5 s. Because the size of the probe was similar to the mulch ele-ments we felt that for the within-mulch measureele-ments there was minimal disturbance of wind and radiation regimes. A 1 mm diameter wire was wrapped around each probe and pushed into the ground to place the sensor at the desiredz. The humidity probes were cal-ibrated against a dew-point generator (model LI-610, LI-COR Inc., Lincoln, NE, USA) in the laboratory to
within 2% for relative humidity in the 15–95% range. Values of relative humidity below 15% were rare in our experiments but values above 95% were frequent. Apparent relative humidity above 100% (up to 108%) was sometimes measured at night when water, prob-ably from condensation, existed on the sensor. In all such cases it was assumed that the relative humidity was 100%.
The λE at the soil surface under the mulch, λE0, was measured using our custom-made tension-plate system (Chen and Novak, 1997). This system mea-sures first-stage evaporation or condensation to within 5 W m−2. Soil moisture contents were high enough that evaporation proceeded at the potential rate under the mulch throughout the experiments. Evaporation from, or condensation onto, theith of six horizontal layers within the mulch (numbered from the bottom layer up) was determined from manual measurements of the weight, Wi, of straw from each layer. The
layers were extracted completely from a cylindri-cal area of mulch of horizontal cross-sectional area
Aw=0.0139 m2. The straw from each of the six layers was placed in a 1.1 cm high acrylic cylindrical con-tainer with netting on its bottom to allow vapour ex-change in the vertical direction. The containers were then stacked vertically in the location from which the straw was extracted so that the straw within them blended in with the surrounding undisturbed mulch in a realistic manner. The containers were removed and weighed every 1 or 2 hours during daytime on se-lected days in the study. Nighttime values on sese-lected days are based on differences between late evening and early morning weighings, i.e., they are averages for the nighttime period. The vertical distribution of mulch mass was assumed to be uniform so that each layer contained the same amount of mulch,mi,
nomi-nally equal to 0.0139×1000/6=2.3 g for the 10 t ha−1 mulch. The λE from the ith mulch layer was then calculated as ization of water,tis the time, and1Wi is the change
inWi in the time interval1t. Then,λEat anyzwithin
λE(z)=λE0+
water content of each mulch layer on a mass basis is
wi=(Wi−mi)/mi, where mi was measured precisely
by oven drying the mulch samples in the containers at 105◦C at the end of the experiments.
2.4. Net radiation, soil thermal regimes, and mulch heat storage
Rn above the mulch was measured using a net ra-diometer (model S-1, Swissteco Instruments, Oberriet, Switzerland) mounted facing south at aboutz=50 cm near the centre of the mulch plot. The radiometer may have overestimatedRnat night because of dewfall ac-cumulating on its upper dome. Field calibration for this and the miniature radiometer described further on was done in 1993 by shading out the beam compo-nent of solar irradiance, which was measured inde-pendently by similarly shading a solarimeter (model CM5, Kipp & Zonen, Delft, Holland) which had been calibrated at the National Atmospheric Radiation Cen-tre, Downsview, Ont., Canada.Rn(z) within the mulch was simulated using a mulch canopy radiation model (Novak et al., 2000b). This model divides the mulch into elemental layers and accounts for first-order re-flections between these. It also accounts for the effects of ‘clumping’ (departures from a random distribution of mulch elements) as inferred from measurements of transmissivity made in an earlier study (Hares and Novak, 1992b, hereafter referred to as HN92b). The model was tested by comparing predicted and mea-sured Rn above the mulch and predicted downcom-ing total radiation under the mulch with measurements made by a miniature net radiometer (model minor MK II S-14, Swissteco Instruments, Oberriet, Switzerland) installed under the mulch in 1993 with its bottom clear dome replaced by a black-body cavity of known tem-perature. Inputs to the model include solar radiation, upper-surface and lower-surface Te, and Ta and ea at screen height (z≈1.5 m). The latter three variables were measured every 30 min at an auto-climate station located about 100 m from the mulch plot.
G0 under the mulch was measured using a custom-made thermopile-type heat flux plate installed
at a nominal depth of 1 cm with storage changes above the plate calculated from soil temperature,Ts, measured at a nominal depth of 0.5 cm (Ts,0.5), i.e.,
G0=G1+Csds
1Ts,0.5
1t , (5)
where G1 is the value from the heat flux plate,
Cs=2.1×10⁶J m−3◦C−1 is the soil volumetric heat capacity (HN92b), and ds=0.01 m. Ts at nominal depths of 2 and 5 cm were also measured. Each Ts was measured using a 250mm chromel/constantan thermocouple fixed with epoxy resin within a stainless steel tube, 10 cm long and 2 mm in outside diameter. Soil surface temperature, Ts,0, was calculated using Fourier’s law applied across the 0–0.5 cm layer as follows:
The rate of change of sensible heat storage,SH,i, in
the elements of theith of the six mulch layers used to measureWi was determined using
SH,i = are the specific heats of the mulch elements and wa-ter, respectively, and1Te,i is the change inTeof the
ith mulch layer in the time interval1t. This neglects sensible heat stored in the mulch air despite the fact that it is the largest fraction by volume. The total porosity of the mulch is almost 0.99, including spaces within the mulch elements, for a bulk density of about 1/0.066=15 kg m−3 and an assumed particle density of 1300 kg m−3. Latent heat flux storage in the air was similarly neglected in Eq. (3).
3. Results and discussion
3.1. Temperature and sensible heat flux — non-wetted mulch
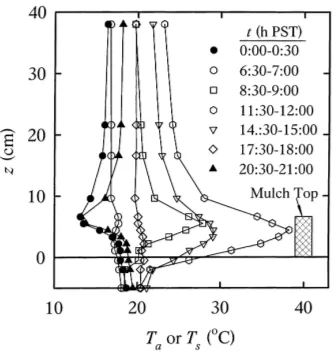
Fig. 1. Vertical profiles of half-hour average air and soil tempera-tures for the non-wetted 10 t ha−1straw mulch during the indicated time periods on 20 August 1994.
Fig. 1. The profiles show that a strong positive lapse rate exists above the mulch during daytime and an inversion during nighttime. Stability conditions for the most part within the mulch though are the re-verse of those mentioned earlier. The inversion in the mulch during daytime is much stronger than that ob-served typically in plant canopies (Monteith, 1976), although in I we showed that this inversion has lit-tle effect on mean wind speed within the mulch. The daytime profile of Ta reaches a maximum at about
z/h=0.67, which is qualitatively similar to that found in other plant canopies (Monteith, 1976; Denmead and Bradley, 1985). According to renewal model concepts (CNBL97),Tais determined by a combination of heat-ing from nearby mulch elements (durheat-ing ‘quiescent’ periods) and cooling during gusts which replace mulch air with cooler air from above it. The latter presum-ably is increasingly dominant aszincreases in the up-per third of the mulch. The distinct above-mulch and within-mulch thermal regimes at night are in contrast with the findings in relatively open plant canopies for which the nighttime inversion continues down to the soil surface, although one exception to this is the maize canopy of Jacobs et al. (1992) which apparently be-haved much like the mulch. Presumably leaf area den-sity strongly governs this behaviour, and the mulch is probably the densest of possible canopies because of its small h and considerable leaf area index (5.6 for the 10 t ha−1mulch).
Diurnal variations of H calculated using the re-newal model for 20 August 1994, are shown in Fig. 2. Evidently,Hvaries strongly with t above and at the top of the canopy and nighttime values are compar-atively small for allz. The 15% difference between
Hatz=6.6 and 9.6 cm (expressed as a percentage of
Hatz=9.6 cm) is largely ascribed to uncertainties in the renewal model. Fig. 2 of CNBL97 shows that the best-fittedα(and therefore alsoαβ2/3g) for 16 August 1994, decreased withzabove the mulch. We chose the mean of four values between z=7.6 and 12.6 cm to use in the model, and this mean was very close to the value forz=9.6 cm. Extrapolating the trend in that fig-ure toz=6.6 cm shows that about a 10% difference is expected. The remaining 5% difference is almost too small to comment on but we note that it could be due to an error in the height of thez=6.6 cm sensor. Because
Hincreases strongly withzat the mulch top (see Fig. 9 of CNBL97, which presents a more detailed profile of cumulativeHdetermined with the renewal model) positioning the sensor a bit too low would cause an underestimate ofH. Also, the height of the mulch is somewhat variable, so that even with a sensor posi-tioned perfectly atz=hsome sources of sensible heat still exist abovez=h, which would result in an increase ofHwithzjust above the mulch. We discount advec-tive effects in the explanation though, sinceHfor the surrounding bare soil was less thanHabove the mulch
and the fetch atz=9.6 cm was better than 200:1. For
z≥h, generallyH<0 at night andH>0 during daytime, which correspond to the inversion and positive lapse rate profiles, respectively, shown in Fig. 1. This occurs typically above any canopy and the mulch behaves similarly.
Hvaries strongly withzin the mulch, especially in the daytime during whichHatz=3.3 cm is about 7% of that at z=6.6 cm and 6% of that at z=9.6 cm. In contrast to what occurs in many plant canopies (Rau-pach, 1989), the major source of H is very near the top of the mulch, which we ascribe to the uniform dis-tribution of mulch element area with zand the high density of the mulch, so that most shortwave radiation is absorbed in the upper 20% (Novak et al., 2000b). Atz=1.1 cm,H<0 during daytime which differs from what occurs in most plant canopies (Denmead and Bradley, 1985; Raupach, 1989). Because the gradient ofTa is positive in the canopy up to aboutz=4.4 cm during the daytime,His transported vertically counter the local gradient at z=3.3 cm but not at z=1.1 cm. From the profiles of meanTa, this constrains the eddy size atz=3.3 cm to at least 2 cm, because according to the renewal model of turbulent transfer, for vertical transfer to occur the air at any level must be replaced by air from above that is cooler on average than at that level (the reverse is true when H changes sign at night). Similarly at z=1.1 cm the eddies must be smaller than 3.3 cm. TheH<0 atz=1.1 cm is not be-cause the contribution from molecular diffusion,Hm, assumed in Eq. (1) to be added in parallel to the re-newal contribution, Hr, is large enough to overcome
Hr. Both components contribute to the negative flux although the contribution from molecular diffusion is about double that from the turbulence (Fig. 3). This suggests that larger eddies generated by shear near the canopy top, which are apparently effective at transport-ingHatz=3.3 cm, either do not penetrate toz=1.1 cm or do not contribute much toH, possibly because of the nearness of the soil surface. Atz=3.3 cm molecu-lar and renewal components oppose each other during daytime with the magnitude of the molecular compo-nent being only about a quarter as great as the renewal component. Nighttime H is mostly positive at both
z=1.1 and 3.3 cm, withHr small and highly variable andHmthe major term. Since within-canopy convec-tion likely dominates at night (I), this may be because the renewal model is not valid under these conditions.
Fig. 3. Diurnal variations of the renewal (Hr) and molecular (Hm) contributions to the total (H) half-hour average sensible heat flux density at the 1.1 and 3.3 cm heights within the non-wetted 10 t ha−1 straw mulch on 20 August 1994.
Lower-surfaceTe on 20 August 1994, is very sim-ilar toTa for all z within the mulch throughout the day (not shown). Diurnal variations of upper-surface
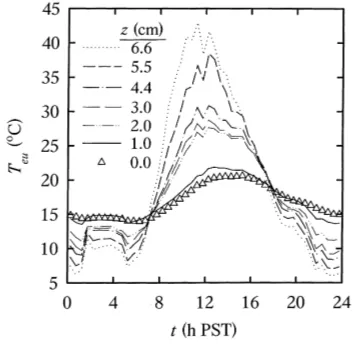
Te,Teu, measured on 30 August 1993, another mostly clear day, are shown in Fig. 4. In contrast with Ta,
Teuincreases withzup toz=hduring daytime and de-creases withztoz=h at night. This is similar to the measurements of HN92b made in a 20 t ha−1 straw
mulch. They inserted thermocouples previously used to measure Ts, and so encased in the stainless steel tubes described earlier, into the mulch at variouszand also measured surface temperature with a bolometer. Because the size of the steel tubes is similar to the mulch elements their temperatures were apparently more typical of Teu rather than Ta. The increase of upper-surfaceTewithzduring daytime is not uniform. The largest increases occur at the top of the mulch and apparently near the bottom (betweenz=1.0 and 2.0 cm). At the top, this is ascribed to the strong source strength forHthere. At the bottom, it may be related to the lower turbulent transport diffusivity (reported later) although the relatively small increase between
z=0 and 1.0 cm is then hard to explain.
Diurnal variations of the difference betweenTeuand
Tafor 30 August 1993, are shown in Fig. 5. Large pos-itive differences occur near the top of the mulch dur-ing daytime, which corresponds to the location where most of the solar radiation is absorbed (Novak et al., 2000b) and of the main source density forH(see Fig. 9 of CNBL97). At night, the differences near the top of the mulch are reversed, in agreement with the change of sign of H above the mulch (Fig. 2). These large differences show that the assumptions usually made that Ta and Te are equal at any z within the mulch and that (implicitly) the mulch elements are isother-mal (Bristow et al., 1986; Bussière and Cellier, 1994)
Fig. 5. Diurnal variations of the difference between half-hour av-erage upper-surface mulch element temperature and air tempera-ture at the 1.0, 2.0, 3.0, 4.4, 5.5, and 6.6 cm heights within the non-wetted 10 t ha−1 straw mulch on 30 August 1993.
are in error. They also imply that the time constant for cooling of the mulch elements must be consider-ably longer than the duration between gusts (≈1 s, as described in I) that bring cooler air down from above the mulch. Otherwise,Teuwould be similar toTa. Ac-cording to thez=1.0 cm data,Teu−Tais negative dur-ing daytime, which would be reasonable if warmer air was penetrating down to this level from higher in the mulch, and positive at night. This appears to hold also at z=3.0 cm but not at z=2.0 cm, although the latter data is somewhat suspect (the nighttime trend forTeu−Ta does not appear to be reasonable and the
Ta sensor was completely off-scale for a brief period early in the morning for unknown reasons; the erro-neous data were interpolated for the graph). But these trends do not hold on all days, and considering lateral variability in the mulch and the fact that theTeprofile is determined in a separate location fromTa, our only firm conclusion from this figure is thatTeuandTaare nearly equal in the bottom two-thirds of the mulch.
3.2. Latent heat flux, vapour pressure, and mulch water content — non-wetted mulch
TheλEandea measured within and just above the mulch on 20 August 1994, are shown in Fig. 6. The
value ofea atz=0 is calculated ase*(Ts,0), wheree* is the saturated water-vapour pressure function. Be-cause the Wi’s were not measured on this day, the
λEi’s were approximated for each half hour by
us-ing averages (for correspondus-ing times) from the four days (11, 12, 17, and 23 August ) when such measure-ments were made for the non-wetted mulch in 1994. The times when the earliest and latest Wi
measure-ments were made on each of these days were 8:00 and 18:00 hours PST, respectively. Values ofλEi for the
6:00–8:00 and 18:00–21:00 hours PST periods were extrapolated according toWi measurements made in
1993 when the times for the earliest and latest mea-surements were 6:00 and 21:00 hours PST. Since the
Wi’s were not measured during 18:00–8:00 hours PST,
it was assumed that theλEi’s for each half hour were
equal to the average value estimated from the total amount of water accumulated on each layer overnight. For much of the day, the mulch is a significant source or sink of water vapour, which is evident by the variation of λEwithz, except for 14:00–16:00 hours PST during whichλEvaries little withzand the flux is from the soil surface only. TheλE above and be-low the mulch differ greatly and are governed by dif-ferent processes. At night, λE is negative above the mulch and positive under the mulch. The former is because of dewfall while the latter is attributed to tur-bulent mixing associated with free convection of the unstable air within the mulch (Fig. 1 and I). During early morning,λEincreases strongly above the mulch and decreases almost to zero under the mulch (on some days it actually becomes negative, e.g., on 25 August 1994, as shown in Chen and Novak, 1997). This is attributed to the increase of solar irradiance which warms the wet mulch, ultimately tending to drive moisture both upwards (above the mulch) and downwards (within the mulch). By early afternoon,
λE under the mulch increases to its maximum value while above the mulch it continues to fall from its early morning maximum, eventually becoming nega-tive again at around 21:00 hours PST.
The temporal variation ofλEabove the mulch qual-itatively resembles that of a drying bare soil (Idso et al., 1974) but the processes are different in detail. Roughly half of the nighttime re-wetting of the mulch is from upward flow from the soil, which within the mulch occurs by a process of distillation. The other half of the re-wetting is from dewfall. For a bare soil,
most of the nighttime re-wetting near the soil surface is by liquid water flow from the wetter soil below.
Because turbulent transfer in the upper part of the mulch is dominated by large-scale eddies (I), it is not expected thatλE should be related to vertical gradi-ents ofea in the mulch in a consistent manner (Rau-pach, 1989). As we have seen for H, we measured counter-gradient flow within the mulch during the day. Nevertheless,λEand gradients ofeaappear to be qual-itatively consistent with flux-gradient theory in the mulch, as counter-gradient flow at least is not in evi-dence. For example, the early morning decline ofλE
near the bottom of the mulch corresponds very well to a decrease in vertical gradients ofea at this time, and the increase ofλEatz=0 in the early afternoon corresponds to an increase in the gradient across the
z=0–1.1 cm layer (note thatλE,ea, andTs,0were all measured independently and in different locations in the mulch).
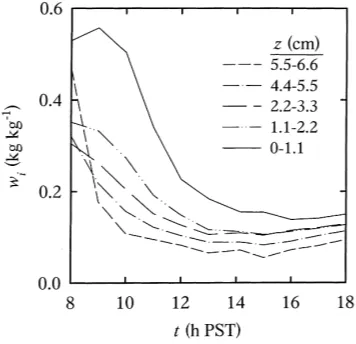
The average daytime variations ofwi for five of the
layers on the three sampling days in 1994 are shown in Fig. 7. From the initial values, it is seen that dur-ing the night the bottom and top layers of the mulch re-wet the most on average and that the drying out during the day occurs most rapidly at the top of the mulch and progressively later deeper in the mulch. By
t=15:00 hours PST (at the top by 16:00 hours) all
lay-Fig. 7. Daytime variations of water content (mass basis hourly) of the 0–1.1, 2.2–3.3, 4.4–5.5, and 5.5–6.6 cm mulch layers within the non-wetted 10 t ha−1straw mulch. The curves are averages of measurements made on 11, 12, 17 and 23 August 1994. Thewi
ers in the mulch begin to re-wet, a process that con-tinues all night.
3.3. Diffusivity profile and mulch conductance for water vapour
Raupach (1989) showed that within a canopy con-centration profiles may be considered as the sum of contributions from sources in the canopy that are near and far away (mostly in the upwind direction). For a source at the soil surface, the concentration profile de-pends on the far-field only. The far-field contribution can be predicted using the standard diffusion equation with a well-defined diffusivity, equal toσw2tL, where
σw is the standard deviation of vertical fluctuations in wind speed and tL is the Lagrangian time scale. Fig. 7 shows that the mulch is very nearly neither a source nor sink of moisture in the late afternoon, i.e., fort=14:00–16:00 hours PST, during which evapora-tion from the mulch contributes less than 10% to the total evaporation from the system. By assuming that the mulch is in steady-state on a half-hour basis dur-ing this time, we determined the within-mulch profile of the far-field turbulent diffusivity for water vapour,
Dv, from the basic flux-gradient relation (the analogue of Fick’s law):
Dv(z)= −(RvTKaλE0)/λ
dea/dz
, (8)
where Rv=461 J kg−1K−1 is the gas constant for water vapour, TKa is the absolute air temperature at
z, and a finite-difference approximation to dea/dz is calculated from the measured profiles, with z at the mid-point between any two measurement heights. Fig. 8 shows the vertical profile ofDvaveraged over all available half-hour measurement periods during during 28 August–1 September 1993, and 10–25 Au-gust 1994. The average horizontal cup wind speed at
z=57 cm for all these periods iss57=1.66 m s−1, and
Dvfor each half hour was normalized by multiplying it bys57/s57, wheres57 is the average value for each half hour, because of some dependence ofDvon wind speed (Fig. 9). Also shown for comparison in Fig. 8 is the molecular diffusivity for water vapour in air,
Dvm=2.4×10⁻⁵m2s−1.
The profiles of Dv are very similar for 1993 and 1994 and Dv increases approximately exponentially
Fig. 8. Vertical profile of the (far-field) turbulent diffusivity for water vapour within the non-wetted 10 t ha−1 straw mulch for all available half-hour periods between 14:00 and 16:00 hours PST during 28 August–1 September 1993, and 10–25 August 1994. Error bars indicate one standard deviation. Also indicated is the molecular diffusivity for air (dashed line). The solid line is an exponential fit to the data for both years (Eq. (9)). Error bars show the ranges of variation.
with depth belowz=hwithin the mulch, with the best fit to the data from both years given by
Dv=0.00049 exp [2.6(z/ h−1)] m2s−1,
r2=0.93, n=7. (9)
According to this equation, Dv=0.00049 m2s−1 at
z=h, which is about 5% less than the diffusivity for momentum at the same height under neutral condi-tions (Dm(h)=0.4u∗(h−d)=0.00052 m2s−1), where
u∗=0.15 m s−1 is the average value for all the half hours used. This is somewhat unexpected, as Raupach (1979) and Raupach et al. (1996) show that the turbu-lent diffusivity for scalars such as water vapour should be about twice that for momentum just above the top of a canopy. It may be that this is because of extrap-olating within-canopy values to the mulch top (we have not investigated diffusivities above the canopy yet), or perhaps because the water-vapour source is atz=0 (most field measurements are for sources near the top of the canopy). The attenuation coefficient of 2.6 lies within the general range of 2.5–4 reported for plant canopies (Lemon, 1965). To date, direct measurements of Dv within a mulch canopy have not been reported. Instead, Dv within mulches has been estimated using exponential functions as given by Eq. (9), but with different attenuation coefficients. Thompson (1981) and Tuzet et al. (1993) used an attenuation coefficient of 2.5, whereas Stigter et al. (1984) and Bussière and Cellier (1994) used a value of about 8. Therefore, the attenuation coefficient re-ported here resolves some of these uncertainties, at least for mulches similar to barley straw.
In I it was reported thatσw/u∗=0.026 exp(2.9z/h), based on measurements with a tri-axial hot-film probe, describes the variation ofσwwithin the mulch. Com-bining this expression with Eq. (9) allows calculation of the profile fortL=Dv/σw2 within the mulch. This profile decreases monotonically with z from a value of 5.4h/u∗atz=0 to 0.22h/u∗atz=h, but because of the low wind speeds in the mulch we are not confident about the values belowz=5 cm. In Lagrangian mod-elling it is usually assumed thattL is constant within a canopy at the value determined forz=h, except very near the soil surface, where it declines to zero. The value atz=his often obtained by extrapolating down from values measured in the inertial layer. A value of 0.22h/u∗ is quite close to the generally
recom-mended value of 0.3h/u∗and for such a dense canopy somewhat lower values are expected (Raupach et al., 1996). Furthermore, this tL provides an estimate of
Lw, the vertical single-point Eulerian integral length scale, i.e.,Lw≈σwtL=0.10hatz=h. This is about three times lower than theh/3 generally accepted for most canopies.
For the same periods, mulch conductance,kv, was calculated from the integrated version of Eq. (8), i.e.,
kv= RvTKa
where TKa is the average absolute air temperature across the mulch andea,0 andea,h refer to the values ofea atz=0 andz=h, respectively. To see how much turbulence enhances vertical transfer in the mulch,kv is compared to the still air mulch conductance, kvm, given by
kvm= Dvm(fe−θ ) ft
h . (11)
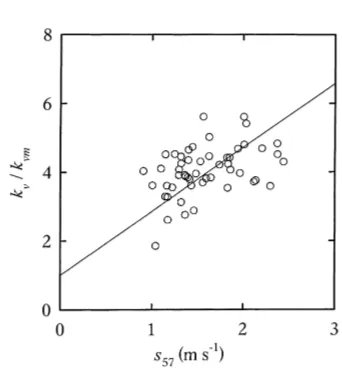
Fig. 9 plots measured conductance ratio,kv/kvm, ver-suss57. Also shown is the fitted linear regression given by
kv
kvm =1+1.86s57, r
rates (Chen et al., 1994). Converting our wind speed measurements at z=57 cm to z=100 cm using the logarithmic profile determined in I yields 1.63 for the coefficient factoring the wind speed, which indicates that this coefficient is sensitive to mulch attributes.
The conductance ratios are in good agreement with the value of 4.5 found by HN92b by fitting daytime
λE0 measured with micro-lysimeters on one day un-der a similar barley-straw mulch applied at 20 t ha−1 to predictions from a physically-based numerical model of the soil-mulch-air system. The height of their 20 t ha−1 mulch was 6 cm, which is attributed to settling and decomposition because the mulch was applied in the fall and the λE0 measurements were made the following spring. Agreement in a 10 t ha−1 mulch was similarly good with this conductance ratio (Hares, 1988). However, this good agreement per se is actually coincidental. The numerical model over-estimated daytime Ts,0 under the 20 t ha−1 mulch by about 2◦C. When this effect is accounted for, a conductance ratio of about 8 is then required to correctly predict daytime λE0 under the mulch. But, Chen and Novak (1997) showed that micro-lysimeter measurements of λE0 under such thick mulches are overestimated by 56% for a 10 t ha−1 mulch, and likely greater for a 20 t ha−1mulch, because of water loss during the (however brief) weighing period and disturbances to the mulch when removing and replac-ing the lysimeter. Correctreplac-ing for this then reduces the conductance ratio back down to 4–5, in good agreement with those shown Fig. 9.
3.4. Energy balance closure and components — non-wetted mulch
Rn calculated above and within the mulch with the radiation model is compared to the sum
G0+SH,i+λE+H at the corresponding z, with each
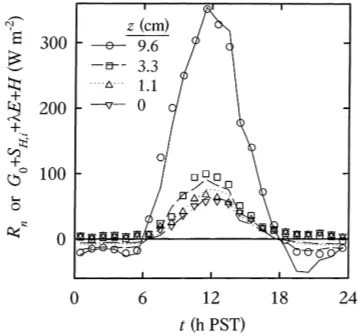
component measured as described earlier, for 20 Au-gust 1994 in Fig. 10.Hatz=0 cm was assumed to be the same as at z=1.1 cm and the z=9.6 cm refers to
Hbeing measured at thatz. Agreement is quite good at all z during the daytime. Perhaps this is not that surprising atz=9.6 cm since the renewal model forH
was calibrated to fit well above the mulch on a sim-ilar day. The poor agreement for the evening data at
z=9.6 cm is probably due to a change in cloud cover,
Fig. 10. Diurnal variations of hourly average net radiation either calculated with the mulch radiation model (lines) or determined as the sum of soil, storage, latent, and sensible heat flux densi-ties (symbols) at the 0, 1.1, 3.3, and 9.6 cm heights within the non-wetted 10 t ha−1 straw mulch on 20 August 1994.
as the radiation model assumed an average cloudiness for the day. The good agreement within the mulch during the daytime is a vindication of both the radia-tion model and the independent measurements ofG0,
SH,i,λE, andH. BecauseH is small even compared
toG0+SH,i and λE at and below z=3.3 cm (Fig. 2)
this is not a sensitive test of whether the coefficientα
is independent ofzwithin the mulch, but assuming it to be so is consistent with the energy balance. Similar measurements (not shown) made at midday on 23 August 1994, at ten z within and above the mulch demonstrate that the renewal model as described in Eq. (1) did well in the upper half of the mulch; again in the lower half the values are too small for a sensi-tive test. At night, the radiation model predicts small negative values near the bottom of the mulch but the sum of the components is actually positive. This may be another symptom of using a daily average cloudi-ness in the radiation model. Since as we have seen,
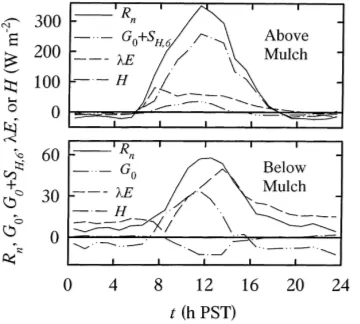
Fig. 11. Diurnal variations of hourly average energy balance com-ponents (net radiation, soil, latent, and sensible heat flux densities) for above (9.6 cm height) and below (0 cm height) the non-wetted 10 t ha−1 straw mulch on 20 August 1994. The net radiation has been calculated as the sum of the soil, latent, and sensible heat components shown.
change in storage for the bottom layer only accounts for 20–30% of measuredλE0, which is not enough to change the sign of the sum of the components.
Energy balance components above and below the mulch on 20 August 1994, are shown in Fig. 11.Rn
shown is calculated asG0+SH,i+λE+H, i.e., perfect
closure. Above the mulch,His the dominant compo-nent in the energy balance throughout the day except for a brief period in the early morning when the mulch evaporates at nearly the potential rate because it is wet with dew. Under the mulch, bothG0 andλE are the most important components, withH being small throughout the day. Qualitatively, the energy balance under the mulch resembles that for a wet bare soil (Novak and Black, 1985), except that the magnitude of the fluxes is much smaller.
3.5. Thermal, moisture, and radiation regimes — artificially wetted mulch
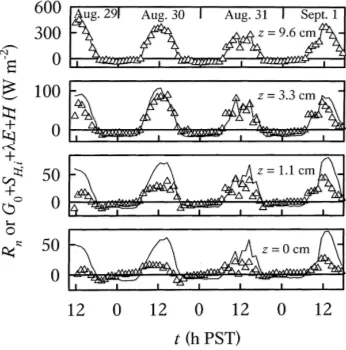
The 10 t ha−1 straw mulch was thoroughly wetted by a combination of sprinkler irrigation (mostly at night) and rain duringt=17:00 hours PST on 27 Au-gust tot=9:00 hours PST on 29 August 1994. Intensive measurements then were made from t=11:00 hours PST on 29 August (about 2 h after irrigation ceased) tot=18:00 hours PST on 1 September 1994. Fig. 12
Fig. 12. Daytime variations of water content (mass basis hourly) of the 0–1.1, 1.1–2.2, 2.2–3.3, 4.4–5.5, and 5.5–6.6 cm mulch layers within the wetted 10 t ha−1 straw mulch during 11:00 hours PST on 29 August to 18:00 hours PST on 1 September 1994. Thewi
of the 3.3–4.4 cm layer has been omitted for clarity.
shows the variations ofwi for five of the mulch
lay-ers during this period. The initial wi’s in the range
3.7–4.0 kg kg−1for all layers below the top layer ex-ceed the ‘saturated’ value, 3.2 kg kg−1, measured in the laboratory by immersing the mulch elements in water until constant weight was achieved and then de-termining the water content (mass basis) gravimetri-cally. This suggests that droplets of water still existed on the mulch elements at this time. The mulch dries steadily during the 4 days and approaches the water content of the non-wetted mulch by 1 September ex-cept for thez=0–1.1 cm layer which is still wetter than for the non-wetted mulch (Fig. 7). Thez=5.5–6.6 cm layer dries the most rapidly and reaches values typi-cal of the non-wetted mulch as early as the afternoon of 29 August. Nighttime re-wetting of the layers ap-pears to be slight but some of this might have been missed because weighing did not begin until late in the morning.
Fig. 13. Diurnal variations of hourly average sensible heat flux density at the 1.1, 3.3, 6.6, and 9.6 cm heights and half-hour average air temperature at the 1.1, 2.2, 3.3, 4.4, 5.5, and 6.6 cm heights for the wetted 10 t ha−1 straw mulch during 11:00 hours PST on 29 August to 18:00 hours PST on 1 September 1994. into the mulch during this process, but unfortunately this was not checked at the end of the experiment. As shown in CNBL97, the renewal modelHatz=9.6 cm was in quite good agreement with H determined
Fig. 14. Diurnal variations of hourly average latent heat flux density at the 0, 1.1, 3.3, and 6.6 cm heights and half-hour average water-vapour pressure at the 0, 1.5, 3.5, 6.6, and 9.6 cm heights for the wetted 10 t ha−1 straw mulch during 11:00 hours PST on 29 August to 18:00 hours PST on 1 September, 1994. The first three hourlyλEatz=6.6 cm are off-scale, the second and highest of them being 215 W m−2 att=12:30 hours PST.
from the energy balance, i.e.,H=Rn−G0−SH,6−λE, where all components are measured independently on a half-hour basis as described earlier. The renewal model correctly simulated more than two-thirds of the increase inH(about 150 W m−2) that occurred as the mulch dried. As for the non-wetted mulch, Hin the bottom half of the wet mulch is very small. An-other feature of the wet mulch is that thezat which
Ta reaches a maximum decreases as the mulch dries. On 29 August the maximum occurs atz=h but by 1 September, the maximum occurs near z=4.4 cm as observed for the non-wetted mulch. On all days,Ta
at the top of the mulch is much greater than at the bottom, the reverse being true at night.
During daytime, condensation occurs onto the soil surface under the mulch (λE<0 atz=0). On 29 August some of this might be due to the dripping of excess water in the mulch onto the tension plate, as suggested by the initially high values of wi exceeding mulch
saturation. The condensation measured was confirmed by comparison with micro-lysimeters installed under the mulch (Chen and Novak, 1997). The λE varies strongly withz in the mulch, as expected given the changes in the wi’s (Fig. 12). Missing values were
interpolated as based on our previous results. Fig. 12 shows that changes between the late afternoon and early morning are here clearly less when the mulch is wet if compared with Fig. 7 for the dry mulch. The vertical gradient ofea betweenz=0 andz=1.5 cm is negative during daytime which corresponds closely to the period of condensation atz=0.
Rncalculated with the radiation model is compared to the sum G0+SH,i+λE+H, with each component
Fig. 15. Diurnal variations of hourly average net radiation either calculated with the original mulch radiation model (lines) or de-termined as the sum of soil, storage, latent, and sensible heat flux densities (symbols) at the 0, 1.1, 3.3, and 9.6 cm heights within the wetted 10 t ha−1 straw mulch during 11:00 hours PST on 29 August to 18:00 hours PST on 1 September, 1994.
but with the residue-area index increased by 75%. The increase was distributed linearly withz, with the max-imum increase atz=0 and no increase atz=h, because when small pieces break off they tend to fall down onto lower layers, which probably was accelerated by the intensive irrigation. With this change, agreement is greatly improved atz=0 and 1.1 cm, although some discrepencies remain (Fig. 16). The poor agreement at the beginning of the measurement period is most likely caused by the dripping of water onto the soil surface from the mulch elements, which led to an overestimate of the condensation rate.
Above the artificially wetted mulch canopy, H is still the largest fraction ofRnamong the energy com-ponents, despite the high water content of the mulch elements.His 53% of Rn on the first day and grad-ually increases to 76% on the fourth day. In contrast,
H accounted for only 27% of Rn for a stubble win-ter wheat mulch afwin-ter it was wetted (Heilman et al., 1992) with the remaining 62 and 11% ofRnattributed toλEandG0. For our wetted mulch,λEaccounts for only 40% on the first day, and decreases to 13% by the fourth day.G0 varies within 7–10% ofRn during the 4 days, which is lower than the G0 for the win-ter wheat stubble. This suggests that a mulch of hor-izontally distributed elements is more effective than
Fig. 16. Same as Fig. 15 except that in the radiation model the residue-area index is increased by 75%, with the increase distributed linearly with height in the mulch, the maximum being at the soil surface and there being no increase at the mulch top. a stubble mulch in terms of reducing water loss by evaporation and lowering soil temperature.
4. Summary and conclusions
tem-peratures are similar in the bottom two-thirds of the mulch but element temperatures greatly exceed air temperatures in the upper third during daytime. Air temperature reaches a peak at about two-thirds of the mulch height while the upper-surface element temper-ature increases with height throughout the mulch. At night, sensible heat flux is negative at the top of the mulch and apparently small within the mulch. Since free convection dominates the flow regime within the mulch at night, the air renewal model probably does not predict sensible heat very well then and it might have been underestimated.
The moisture regimes above the mulch resemble those of a bare soil in the later stages of drying. The evaporation rate peaks early in the morning and de-clines steadily throughout the daytime. This regime is established rather quickly even after the mulch has been thoroughly wetted. Re-wetting of the mulch at night by dew is partly by condensation of water evap-orated from the underlying soil and partly by dewfall, in contrast with a drying bare soil for which upward liquid water flow dominates. The nighttime evapora-tion rate under the mulch can be considerable com-pared to daytime rates, which in part is attributed to the free convection that occurs within the mulch at night. The mulch elements are a significant source or sink for moisture throughout most of the day except for a few hours in the afternoon when the mulch has thoroughly dried. Then the only source of water for evaporation is from the underlying soil. During day-time, the source density for latent heat is located at a much lower height than that for sensible heat but at night both sinks are mainly at the mulch top. Mea-surements of the far-field turbulent diffusivity when the mulch was dry in the afternoon shows the impor-tance of turbulence near the top of the mulch, the mea-sured conductance of the mulch being 2–6 times that of the molecular conductance with mild dependence on wind speed. The energy balance under the mulch resembles that of a wet bare soil, with soil and latent heat fluxes being large compared to sensible heat flux. For modelling purposes, neglecting sensible heat flux in the energy balance at the underlying soil surface is a reasonable approximation. When the mulch is thor-oughly wetted the energy balance above the mulch is not modified as much as that under the mulch. There, condensation instead of evaporation occurs through-out the daytime under these conditions.
Our field-measured energy balance components are verified by comparison with an independently devel-oped mulch radiation model. The assumption that the non-dimensional coefficient in the air renewal model is constant within the mulch is a reasonably good one, although sensible heat fluxes are too small in the lower half of the mulch to test this very well. Agreement is excellent above and within the mulch between net radiation from the model and the sum of the independently measured energy balance com-ponents for data collected prior to irrigation of the mulch near the end of the experiment. Agreement is poor though in the bottom half of the mulch for data following this irrigation, with net radiation from the model being overestimated. By increasing the mulch residue area index, especially in the lower part of the mulch, good agreement is then obtained through-out the mulch. This suggests that intensive irrigation can break off fragile decomposing pieces of mulch which accumulate in the bottom half of the mulch and reduce the transmissivity to shortwave radiation.
In future, we plan to improve the physically-based model of thermal, moisture, and radiation regimes of the soil-mulch-atmosphere system presented by Hares and Novak (1992a) based on the conclusions of this paper and I. We will test this model against our com-prehensive mulch measurement data, of which we have presented only a small fraction here.
Acknowledgements
The study was supported by a grant to MDN from the National Science and Engineering Research Coun-cil of Canada. WC was supported by a University of British Columbia Graduate Fellowship and a St. John’s Fellowship. We thank the staff of the UBC Plant Sci-ence Research Station for their help with plot prepa-ration. Dr. Andy Black, Dr. Marie-Claude Fortin, Dr. Douw Steyn, Dr. Kya Tha Paw U, and Dr. Roland Stull provided valuable suggestions on an early draft of this manuscript.
References
Bristow, K.L., 1988. The role of mulch and its architecture in modifying soil temperature. Aust. J. Soil Res. 26, 269–280. Bristow, K.L., Abrecht, D.G., 1989. The physical environment of
two semi-arid tropical soils with partial surface mulch cover. Aust. J. Soil Res. 27, 577–587.
Bristow, K.L., Campbell, G.S., Papendick, R.I., Elliott, L.F., 1986. Simulation of heat and moisture transfer through a surface residue-soil system. Agric. For. Meteorol. 36, 193–214. Bussière, F., Cellier, P., 1994. Modification of the soil temperature
and water content regimes by a crop residue mulch: experiment and modelling. Agric. For. Meteorol. 68, 1–28.
Chen, W.J., Novak, M.D., 1997. An improved tension-plate system for measuring first-stage evaporation under straw much. Agric. For. Meteorol. 85, 1–17.
Chen, W.J., Novak, M.D., Ketler, R., 1994. Turbulent vapour transfer through uniform straw mulches using an improved tension-plate apparatus. Proceedings of the 21st Conference on Agricultural and Forest Meteorology, San Diego, USA, 7–11 March 1994. Am. Meteorol. Soc., Boston, MI, pp. 207–210. Chen, W.J., Novak, M.D., Black, T.A., Lee, X., 1997. Coherent
eddies and temperature structure functions for three contrasting surfaces Part II. Renewal model for sensible heat flux. Boundary-Layer Meteorol. 84, 125–147.
Denmead, O.T., Bradley, E.F., 1985. Flux-gradient relationships in a forest canopy. In: Hutchison, B.A., Hicks, B. (Eds.), The Forest-Atmosphere Interaction. D. Reidel Publishing Company, Dordrecht, Holland, pp. 421–442.
Hares, M.A., 1988. Effects of mulching on the surface energy balance and soil thermal regimes. Ph.D. Thesis, University of British Columbia, Vancouver, BC.
Hares, M.A., Novak, M.D., 1992a. Simulation of surface energy balance and soil temperature under strip tillage I. Model description. Soil Sci. Soc. Am. J. 56, 22–29.
Hares, M.A., Novak, M.D., 1992b. Simulation of surface energy balance and soil temperature under strip tillage II. Field test. Soil Sci. Soc. Am. J. 56, 29–36.
Heilman, J.L., McInnes, K.J., Gesch, R.W., Lascano, R.J., 1992. Evaporation from ridge-tilled soil covered with herbicide-killed winter wheat. Soil Sci. Soc. Am. J. 56, 1278–1286.
Idso, S.B., Reginato, R.J., Jackson, R.D., Kimball, B.A., Nakayama, F.S., 1974. The three stages of drying of a field soil. Soil Sci. Soc. Am. Proc. 38, 831–837.
Jacobs, A.F.G., van Boxel, J.H., Shaw, R.H., 1992. The dependence of canopy layer turbulence on within-canopy thermal stratification. Agric. For. Meteorol. 58, 247–256. Kimball, B.A., Lemon, E.R., 1971. Air turbulence effects upon
soil gas exchange. Soil Sci. Soc. Am. Proc. 35, 16–21.
Kohnke, H., Werkhoven, C.H., 1963. Soil temperature and soil freezing as affected by an organic mulch. Soil Sci. Soc. Proc. 27, 13–17.
Lemon, E.R., 1965. Micrometeorology and the physiology of plants in their natural environment. In: Stewart, F.C. (Ed.), Plant Physiology IVA. Academic Press, New York, pp. 203–227. Monteith, J.L. (Ed.), 1976. Vegetation and the Atmosphere, Vol.
2: Case Studies. Academic Press, London, UK, 439 pp. Novak, M.D., Black, T.A., 1985. Theoretical determination of
the surface energy balance and thermal regimes of bare soils. Boundary-Layer Meteorol. 33, 313–333.
Novak, M.D., Chen, W.J., Orchansky, A.L., Ketler, R., 2000a. Turbulent exchange processes within and above a straw mulch Part I: Mean wind speed and turbulent statistics. Agric. For. Meteorol. 102 (2–3), 139–154.
Novak, M.D., Chen, W.J., Hares, M.A., 2000b. Simulating the radiation distribution within a barley-straw mulch. Agric. For. Meteorol. 102 (2–3), 155–171.
Radke, J.K., 1982. Managing early season soil temperatures in the northern corn belt using configured soil surfaces and mulches. Soil Sci. Soc. Am. J. 46, 1067–1071.
Raupach, M.R., 1979. Anomalies in flux-gradient relationships over forest. Boundary-Layer Meteorol. 16, 467–486. Raupach, M.R., 1989. A practical Lagrangian method for relating
scalar concentrations to source distributions in vegetation canopies. Q. J. R. Meteorol. Soc. 115, 609–632.
Raupach, M.R., Finnigan, J.J., Brunet, Y., 1996. Coherent eddies and turbulence in vegetation canopies: the mixing-layer analogy. Boundary-Layer Meteorol. 78, 351–382.
Steiner, J.L., 1989. Tillage and surface residue effects on evaporation from soils. Soil Sci. Soc. Am. J. 53, 911–916. Stigter, C.J., Mwanpaja, A.R., Kainkwa, R.M.R., 1984. Infrared
surface and thermistor sub-surface temperatures explaining the thermophysical characteristics of grass mulches. Proceedings on the 2nd Symposium on Temperature Measurement in Industry and Science, IMEKO, Suhl, GDR, pp. 523–531.
Tanner, C.B., Shen, Y., 1990. Water vapor transport through a flail-chopped corn residue. Soil Sci. Soc. Am. J. 54, 945– 951.
Thompson, N., 1981. Modelling the field drying of hay. J. Agric. Sci., Camb. 97, 241–260.
Tuzet, A., Perrier, A., Oulid Aissa, A.K., 1993. A prediction model for field drying of hay using a heat balance method. Agric. For. Meteorol. 65, 63–89.