MODELING URBAN DYNAMICS USING RANDOM FOREST: IMPLEMENTING ROC
AND TOC FOR MODEL EVALUATION
Ahmadlou, M.a, M.R Delavarb, H. Shafizadeh-Moghadamc, A. Tayyebid
aGIS Dept., School of Surveying and Geospatial Eng., College of Eng., University of Tehran, Tehran, Iran, Email:
b
Center of Excellence in Geomatic Eng. in Disaster Management, School of Surveying and Geospatial Eng., College of Engineering, University of Tehran, Tehran, Iran, Email: [email protected]
cDepartment of GIS and Remote Sensing, Tarbiat Modares University, Tehran, Iran, Email: [email protected]
dCenter for Conservation Biology, University of California-Riverside, Riverside, CA, USA, Email: [email protected]
Commission II, WG II/4
KEY WORDS: Random Forest, Urban Growth Modelling, Relative Operating Characteristics, Total Operating Characteristics, Coastal Region
ABSTRACT
The importance of spatial accuracy of land use/cover change maps necessitates the use of high performance models. To reach this goal, calibrating machine learning (ML) approaches to model land use/cover conversions have received increasing interest among the scholars. This originates from the strength of these techniques as they powerfully account for the complex relationships underlying urban dynamics. Compared to other ML techniques, random forest has rarely been used for modeling urban growth. This paper, drawing on information from the multi-temporal Landsat satellite images of 1985, 2000 and 2015, calibrates a random forest regression (RFR) model to quantify the variable importance and simulation of urban change spatial patterns. The results and performance of RFR model were evaluated using two complementary tools, relative operating characteristics (ROC) and total operating characteristics (TOC), by overlaying the map of observed change and the modeled suitability map for land use change (error map). The suitability map produced by RFR model showed 82.48% area under curve for the ROC model which indicates a very good performance and highlights its appropriateness for simulating urban growth.
1. INTRODUCTION
Around 2% or 3% of the Earth’s land surface is covered by
urban land (Poelmans and van Rompaey 2010). Thus, information with respect to the intensity and future direction of urban expansion is of great importance for urban planners, policy makers and scholars. In this regard, using satellite images to monitor, identify and analyze urban expansion is the initial step.
A review of the previous studies shows that urban dynamics operate in a non-linear and complex manner (Tayyebi et al., 2014; Shafizadeh-Moghadam et al., 2015). A number of statistical (e.g., logistic regression and auto-logistic regression) and machine learning approaches (e.g., neural networks and support vector machines) have been calibrated and developed for modelling urban dynamics (Poelmans and van Rompaey
2010; Tayyebi and Pijanowski 2014; Shafizadeh-Moghadam et al., 2015); however, random forest (RF) (Breiman, 2001) has rarely been used in the field of land change modelling.
modelling urban change. They found that RF-CA model outperformed SVM-CA and LR-CA models. Compared to statistical models (e.g., logistic regression), RF is not sensitive to outliers and is superior to generalized additive mixed models which fail to account for interaction among the explanatory. For these reasons, RF is increasingly employed in spatial analysis, remote sensing and modelling spatial data for purposes such as land use classification, soil evaluation, uncertainty analysis and landslide hazard mapping (e.g., Gislason et al., 2006; Loosvelt et al., 2012; Heung et al., 2014).
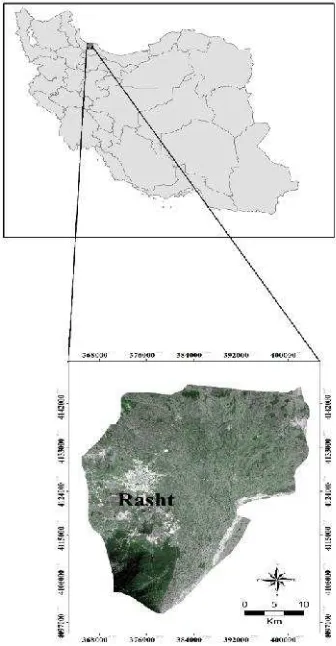
To the best of our knowledge, with the exception of Kamusoko and Gamba (2015) who used the RF-CA urban land change model, no study has used RFR to simulate urban growth. Thus, the main objective of this paper is to evaluate RFR model in terms of urban change detection performance and spatial accuracy in Rasht, capital of Gilan Province, Iran. The simulated maps will be evaluated using the observed maps and statistical tools. region of Rasht receives thousands of tourists annually. The total area of the region is approximately 180 km2. The city, in
Figure 1. Study area, Rasht, Iran
recent decades, has experienced increasing population growth and urban expansion. Due to the urban expansion in recent decades, many of the peripheral villages have been appended into the urban regions of Rasht.
2.2 Data
In this study, Landsat data are the main source for information extraction and monitoring urban change. Table 1 lists the dataset and driving forces prepared for modeling urban growth using RFR model. The Landsat images of 1985 (TM, May 1985), 2000 (ETM+, May 2000) and 2015 (ETM+, April 2015) were processed for spatio-temporal mapping and were then projected to UTM Zone 39 North with 30m spatial resolution. The classification procedure was conducted using maximum likelihood classification followed by a post-classification phase for improving the accuracy of the classified maps.
The processing stage resulted in five classes including built-up class, crop land, open land, water bodies and forest. The classification accuracy, using the Kappa index, was 87%, 86% and 88% for 1985, 2000 and 2015 respectively.
The urban change between the 1985 and 2000 was the target variable and a set of 11 driving forces including distance from main roads, distance from built-up areas, distance from coast, distance from agricultural land, distance from open land, digital elevation model (DEM), slope, aspect, northing and easting were used as explanatory variables. The selection of driving forces was based on previous experimental studies (e.g. Hu and Lo 2007; Shafizadeh-Moghadam et al. 2015) and the local characteristics of the region.
2.3 Method
A set of classification and regression trees (CART) are known as Random forests so that each tree relies upon the values of an independently sampled random vector with the same distribution for all trees in the forest (Breiman 2001; Tayyebi and Pijanoswski, 2014). RF can be used for classification and regression tasks while estimating variable importance through these processes (Tayyebi et al., 2014). In RFR model, the output is calculated by taking the average over k of the trees (Breiman 2001). From the total amount of predictors (p), as a rule of thumb, the square root (m) of p is used to make decisions at each tree node. Since there were 11 independent factors for predicting the target variable, the m parameter was set at 4. The number of trees to be fitted was set at 400. To assess the model performance, out-of-bag (OOB) approach was used. The OOB is an internal error estimate of an RF as it is being constructed, from the data which are not in the bootstrap sampling process (Mellor et al., 2013).
Variables Range Mean Data type Distance from agriculture areas
(m) 0-1,590 42 Continuous
Distance from sea (m) 0-47,306 20,524 Continuous
Distance from built-up areas (m) 0-9,703 1,688 Continuous
Distance from river (m) 0-23,365 5,041 Continuous
Distance from forest (m) 0-1,667 125 Continuous
Distance from roads (m) 0-9,710 2,585 Continuous
DEM (m) 44-683 24 Continuous
Slope (°) 0-51 5 Continuous
Aspect (°) 0-360 175 Continuous
Easting parameter (m) 364,929-403,689 383,062 Continuous Northing parameter (m) 4,098,817-4,145,917 4,125,967 Continuous
Table 1. Spatial explanatory variables of urban change between 1985 and 2000.
Figure 2.Urban growth for the years between 1985 and 2000 and between 2000 and 2015.
the TOC gives size information of each entry (Pontius and Si 2014).
3. RESULTS AND DISCUSSION
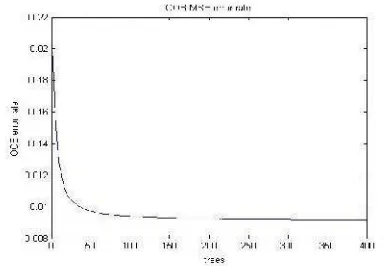
Model construction followed two consequent steps. In order to develop RF model, we used the urban growth between 1985 and 2000 for model calibration and the urban growth between 2000 and 2015 for model validation (Fig 2). The model obtained from the calibration phase was then used to predict urban change between 2000 and 2015. In the modelling process, built- up areas and water bodies in 2000 were considered as exclusionary zones and the rest were seen as the regions where urban expansion could occur. We set the built-up gain between the two consequent times as target variable (Target variable was coded as either 0 or 1, pixels that were transformed to the built-up class between 1985 and 2000 were coded as 1, and those which were unchanged were considered as 0) and a set of 11 driving forces as explanatory variables (Table 1). By running the model, as seen from Figure 3, after 100 trees, the model starts converging and the error rate falls below 0.01 at 400 trees
point. Then, a probability map was obtained with values ranging from 0 to 1 representing lowest to highest probability of urban change occurrence. The processes of calibration and prediction were conducted using MATLAB®.
Figure 4
.
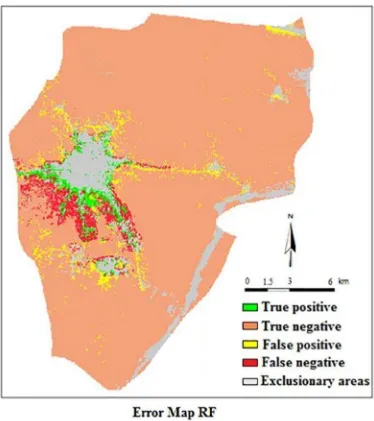
The observed maps of 2000 and 2015 overlaid by the simulated map of 2015.By subtracting Landsat images of 2000 and 2015, it was revealed that 68313 cells were transmitted to built-up class from all other classes. Following the approach of Pijanowski et al. (2002), 68313 cells which had the greatest change likelihood values were selected from the output transition probability map obtained from RFR and classified as new built-up areas. Figure 4 shows the observed changes between 2000 and 2015 along with the predicted changes obtained by RFR model. The model was able to correctly predict 44476 out of 68313 urban changes and 1113353 out of 1156506 non-changed pixels. The area under ROC curve was 82.48% which indicates good performance of the model. Each threshold in ROC creates a two-by-two contingency table, which has four numbers: True Positive (TP; shows cells which are predicted as change and are actually change cells in the observed map), False negative (FN; shows cells which are predicted as change but are actually
non-change cells in the observed map) False positive (FP; shows cells which are predicted as non-change but are actually change cells in the observed map), True negative (TN; shows cells which are predicted as non-change and are actually non-change cells in the observed map) as shown in Fig. 4. Unlike ROC, TOC shows the four numbers in contingency table for each threshold. For example, the values for TP, TN, FP and FN were 44387, 968116, 23926 and 188390 for a threshold of 0.8 in the TOC curve (Fig. 5), respectively. Also, the area under ROC curve (82.48%) is equal to the ratio of the area of TOC curve within the parallelogram to the whole area of parallelogram (Fig. 5).
Figure 5. Total operating characteristic (TOC) for the performance of RFR in simulating urban change between 2000
and 2015
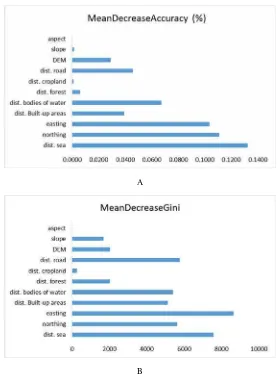
A
B
However, the slope, aspect, forest and croplands did not appear to be significant predictors (Fig 6).
RFR is a powerful model similar to the other black box models such as neural networks which are desirable where the prediction is prioritized. In contrast to the logistic regression, a drawback of RFR model is that it does not provide insights regarding the positive or negative influence of each variable. The variable importance is indeed an indicator of the predictive ability of each variable in RF model.
4. CONCLUSIONS
Understanding the complexity and interaction among the drivers of urban dynamics is key to accomplishing a highly accurate urban growth prediction. The spatial accuracy of urban change simulation map is of great importance to urban planners and policy makers which highlights the importance of developing
more accurate models. In this paper, on the basis of the extracted land use classes from the Landsat imageries, RFR model was calibrated for modeling and understanding the importance of urban growth factors. Then, using ROC and TOC statistical tools and by overlaying the observed and simulated maps, spatial accuracy of RFR model was calculated.
The RFR model proved to be a proper tool for urban growth simulation. A measure of variable importance was also computed through the modeling process of RFR which is related to the predictive ability of the model and thus not analogues to the statistical approaches such as logistic regression which are well known for their ability to quantify causality. On the other hand, by the relaxation of statistical assumptions, ease of use and parameter tuning, RFR application is highly recommended for the other geographical regions. It is also suggested to calibrate the model for multiple land use/cover change modeling. However, when using RFR, it should be noted that it is a time-intensive method where running time goes up enormously by increasing the number of trees.
5. REFERENCES
Breiman, L., 2001. Random forests,Machine learning,45(1), 5-32.
Gislason, P. O., Benediktsson, J. A., & Sveinsson, J. R., 2006. Random forests for land cover classification,Pattern Recognition Letters, 27(4), 294-300.
Heung, B., Bulmer, C. E., & Schmidt, M. G., 2014. Predictive soil parent material mapping at a regional-scale: a random forest approach,Geoderma, 214, 141-154.
Hu, Z., and Lo, C., 2007. Modeling urban growth in Atlanta using logistic regression.Computers, Environment and Urban Systems, 31, 667-688.
Kamusoko, C., and Gamba, J., 2015. Simulating urban growth using a random forest-cellular automata (RF-CA) model,ISPRS International Journal of Geo-Information,4(2), 447-470.
Loosvelt, L., Peters, J., Skriver, H., Lievens, H., Van Coillie, F. M., De Baets, B., & Verhoest, N. E., 2012. Random Forests as a tool for estimating uncertainty at pixel-level in SAR image classification, International Journal of Applied Earth Observation and Geoinformation, 19, 173-184.
Mellor, A.; Haywood, A.; Stone, C.; Jones, S., 2013. The performance of random forests in an operational setting for large area Sclerophyll forest classification,Remote Sensing., 5, 2838–2856.
Pal, M. 2005. Random forest classifier for remote sensing classification. International Journal of Remote Sensing, 26(1), 217-222.
Pijanowski, Bryan C., Daniel G. Brown, Bradley A. Shellito, and Gaurav A. Manik. G. A., 2002. Using neural networks and
GIS to forecast land use changes: a land transformation model,Computers, Environment and Urban Systems26, No. 6, 553-575.
Pijanowski, B. C., Tayyebi, A., Delavar, M. R., & Yazdanpanah, M. J., 2010. Urban expansion simulation using geospatial information system and artificial neural networks.
Poelmans, L., and van Rompaey, A., 2010. Complexity and performance of urban expansion models,Computers, Environment and Urban Systems,34(1), 17-27.
Pontius, R. G., and Schneider, L. C., 2001. Land-cover change model validation by an ROC method for the Ipswich watershed, Massachusetts, USA.Agriculture, Ecosystems and Environment,85(1), 239-248.
Pontius Jr, R. G., and Si, K., 2014. The total operating characteristic to measure diagnostic ability for multiple thresholds,International Journal of Geographical Information Science,28(3), 570-583.
Shafizadeh-Moghadam, H., Hagenauer, J., Farajzadeh, M., & Helbich, M., 2015. Performance analysis of radial basis function networks and multi-layer perceptron networks in modeling urban change: a case study,International Journal of Geographical Information Science, 29(4), 606-623.
Tayyebi, A., and Pijanowski, B. C., 2014. Modeling multiple land use changes using ANN, CART and MARS: Comparing tradeoffs in goodness of fit and explanatory power of data mining tools,International Journal of Applied Earth Observation and Geoinformation,28, 102-116.