INSAR AND FINITE ELEMENT ANALYSIS OF GROUND DEFORMATION AT LAKE
URMIA CAUSEWAY (LUC), NORTHWEST IRAN
R. Shamshiri a, M. Motagh b, M. Baes b, M. A. Sharifi a
a
Dept. of Surveying and Geomatics Engineering, University of Tehran, Tehran, Iran - (r.shamshiri, sharifi)@ut.ac.ir
bHelmholtz Centre Potsdam, GFZ German Research Centre for Geosciences, Potsdam, Germany
-(motagh,
baes)@gfz-potsdam.de
KEY WORDS: InSAR, SBAS, FEM, Deformation, Lake Urmia Causeway (LUC)
ABSTRACT:
Precise long-term deformation monitoring of causeways and bridges is of vital task for maintenance and management work related to transportation safety. In this study, we analyse the settlement of Lake Urmia Causeway (LUC), northwest Iran, using observations from InSAR and Finite Element Model (FEM) simulation. For InSAR processing, we analyse 58 SAR images of ENVISAT, ALOS and TerraSAR-X (TSX) using the SBAS technique to assess the settlement of embankments in the years 2003-2013. The InSAR results show deflation on both embankments with a peak velocity of > 5 cm/year in the satellite Line Of Sight (LOS) direction. The InSAR observations are then used to construct a settlement compaction model for the cross section at the distance of 4 km from the most western edge of the causeway, using a 2D Finite Element Model. Our FEM results suggest that settlement of the embankments will continue in the future due to consolidation phenomenon.
1. INTRODUCTION
Precise long-term deformation monitoring of causeways and bridges is of vital task for maintenance and management work related to transportation safety. The use of advanced InSAR time-series techniques such as Persistent Scatterer Interferometry (PSI) and Small Baseline Subset (SBAS) (Anderssohn et al., 2009; Berardino et al., 2002; Ferretti et al., 2001; Hung et al., 2010; Motagh et al., 2007) that enable the retrieval of deformation time-series and velocity maps from a stack of SAR data over a region further enhances our capability for precise deformation monitoring of engineering structures using radar data (M. Daniel et al., 2010; P. Daniel et al., 2009; Qingli et al., 2011; ZHANG et al., 2012).
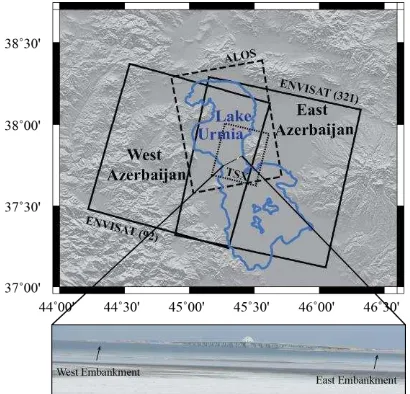
In this study, we assess the settlement of Lake Urmia Causeway (LUC), northwest Iran, using observations from InSAR and Finite Element Model (FEM) simulation. The LUC consists of one bridge and two embankments on both sides of it (see Fig. 1) that connects two Iranian provinces of East Azerbaijan and West Azerbaijan. Construction time period of the embankments is between 1979 and 1995 and the construction of the bridge was started in 2002 and was finished in the late 2009s.
2. MONITORING
2.1 Data
The data used in this study include 30 ENVISAT in two descending tracks: 20 from Track 321 covering September 2003-November 2006 and 10 from Track 92 covering July 2007-September 2010, 10 ALOS in an ascending track
covering December 2006-July 2010, and 18 TSX in a descending track covering May 2012-January 2013. Figure 1 illustrates the outline SAR frames from satellites used in this study.
Figure 1. Shaded relief-topography map of the area. The blue curve shows Lake Urmia shoreline. Rectangles show the area covered by radar scenes used in this study. The thick lines corresponds to ENVISAT from Track 321 and Track 92, in descending path, dashed line corresponds to ALOS in ascending path and dotted line corresponds to TSX in descending path. The bridge and embankments are shown
below the map.
International Archives of the Photogrammetry, Remote Sensing and Spatial Information Sciences, Volume XL-1/W3, 2013 SMPR 2013, 5 – 8 October 2013, Tehran, Iran
2.2 Methodology
In this study all SAR images data are processed using the SBAS approach implemented in StaMPS software (http://radar.tudelft.nl/~ahooper/stamps). The processing is done in three main steps. They are (1) generation of small baseline interferograms, (2) selection of slowly decorrelating filtered phase (SDFP) pixels, and (3) phase unwrapping and least-squares inversion.
2.3 InSAR Results
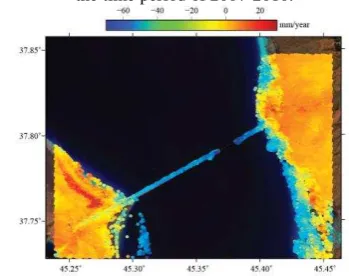
Figures 2-5 illustrate the deformation velocity maps of the area using different SAR sensors. The maps are overlaid on a Landsat 8 image. All deformation maps show a bowl-shaped pattern of deformation along the causeway. We obtained a peak Line of Sight (LOS) velocity of ~ 65 mm/year (Fig. 2)using ENVISAT data from 2003-2007 (Track 321), ~ 50 mm/year (Fig. 3)using ENVISAT data from 2007-2010 (Track 92), ~ 75 mm/yearusing ALOS data during 2007-2010 (Fig. 4), and ~ 85 mm/year using TSX for the year 2012-2013 (Fig. 5).
Figure 2.LOS deformation velocity map derived from ENVISAT (Track 321) in the time period of 2003-2007.
Figure 3.LOS deformation velocity map derived from ENVISAT (Track 92) in the time period of 2007-2010.
Figure 4. LOS deformation velocity map derived from ALOS in the time period of 2007-2010.
Figure 5. LOS deformation velocity map derived from TSX in the time period of 2012-2013.
3. MODELLING
In order to predict the future settlement of the embankment, we utilize FEM as implemented in PLAXIS software. A major part of the vertical settlement of the waterway is due to the consolidation phenomenon. Consolidation is the time-dependent settlement of saturated soils resulting from the expulsion of water from the soil pores (Budhu, 2011). So we model the filling and consolidation phases of the embankment from the construction year (1981) to 2112 of the cross section at 4 km, for which the stratigraphy and material parameters are known (Karlsrud, 2006).
3.1 Model Setup
The geometry of the cross section has been constructed based on surveys carried out in 2002. The model geometry of the section has a depth of 181 m (from 1100 m to 1281 m above mean sea level) and a width of 400 m. The lateral boundaries are fixed in the horizontal direction at distances of 200 m from the embankment centreline. The bottom boundary is fixed in both directions, simulating the presence of the rock layer at the depth below 1100 m.
In general the soil conditions in the section consist of deep sediments of clay, with layers of silt and sand. Figure 6 shows the geometry, finite element meshes, boundary conditions and soil types.
Figure 6. Geometry, finite element meshes, boundary conditions and soil types of the cross section at 4 km. International Archives of the Photogrammetry, Remote Sensing and Spatial Information Sciences, Volume XL-1/W3, 2013
SMPR 2013, 5 – 8 October 2013, Tehran, Iran
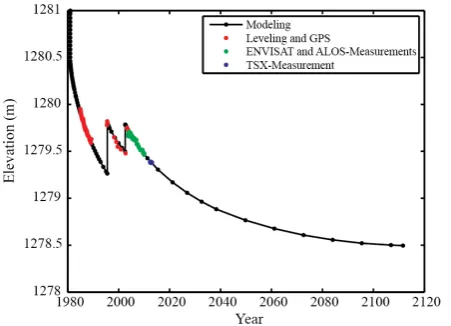
3.2 FEM Results rates (red points in the figure) in addition to the InSAR derived settlement rates from 2003 to 2010 (green points in the figure) are used as constrains in the models, while TSX derived settlement rate from 2012 to 2013 is used as validation of the models (blue points in the figure). The jumps in the plot correspond to the refilling of the embankment in the years 1995 and 2002.
Figure 7. The settlement–time plot of one point on the top of the rock-fill at the cross section 4.0 km.
4. DISCUSSION AND CONCLUSION can be seen that the trend of deformation along the causeway in these periods are similar to each other and the maps show that the rate of deformation at embankments is increased towards the Urmia bridge. Also comparing the Fig. 2 and Fig. 5, it can be concluded that from the year 2003 to 2013 the deformation rate along the embankments has been increased.
The InSAR observations are then used to construct a settlement consolidation model for the cross section at the distance of 4 km from the most western edge of the causeway, using a 2D Finite Element Model implemented in PLAXIS software. Geodetic measurements and InSAR data derived by ALOS and ENVISAT satellites in the period of 2003-2010 are used to constrain the model, while the TSX measurements from 2012-2013 are used to check the accuracy of the predicted model settlement. Validation results demonstrate the high accuracy of our compaction model for settlement analysis at the embankments. Our FEM results of prediction indicate that the
subsidence rate will gradually reduce after 2012 due to algorithm for surface deformation monitoring based on small baseline differential SAR interferograms. IEEE Trans. Geosci. Remote Sens., 40, 2375–2383.
Budhu M. (2011). Soil mechanics and foundations. John Wiley & Sons.
Daniel M, Giuseppe C, Jordi J. M, Sergi D, Paco L-D, Roberto T, Gerardo H, Juan M. L-S, Vicente F, Victor D. N-S, Joaquín M, . (2010). Application of TerraSAR-X data to the monitoring of urban subsidence in the city of Murcia In: Geoscience and Remote Sensing Symposium (IGARSS), 2010 IEEE International, Honolulu, HI, pp. 3506-3509.
Daniel P, Claudio P, Fabio R, Teng W. (2009). PSInSAR Analysis over the Three Gorges Dam and urban areas in China. In: Urban Remote Sensing Joint Event.
Ferretti A, Prati C, Rocca F. (2001). Permanent Scatterers in SAR Interferometry. IEEE Transactions on Geoscience and Remote Sensing 39, 8-20.
Hung W-C, Hwang C, Chen Y-A, Chang C-P, Yen J-Y, Hooper A, Yang C-Y. (2010). Surface deformation from persistent scatterers SAR interferometry and fusion with leveling data: A case study over the Choushui River Alluvial Fan, Taiwan.
Remote Sensing of Environment. doi:
10.1016/j.rse.2010.11.007.
Karlsrud K. (2006). Updated assessment of stability and settlement of the embankment. In. Norwegian Geotechnical Institute (NGI).
Motagh M, Hoffmann Jr, Kampes B, Baes M, Zschau J. (2007). Strain accumulation across the Gazikoy-Saros segment of the North Anatolian Fault inferred from Persistent Scatterer Interferometry and GPS measurements. Earth and Planetary Science Letters, 255, 432-444.
Qingli L, Daniele P, Hui L, Qinghua L, Ralf D. (2011). Railway Subsidence Monitoring by High Resolution INSAR Time Series Analysis in Tianjin. In: Geoinformatics, 2011 19th International Conference on, Shanghai.
Zhang N-n, Chen Z-j, Chen Y-j, Bian L. (2012). PSI and CRI joint algorithm used to monitor settlements of Sutong bridge foundation Rock and Soil Mechanics, 33.
6. ACKNOWLEDGEMENT
We would like to thank the European Space Agency (ESA) for supplying the ENVISAT and ALOS images through the category 1 project AOALO3740 and German Aerospace Agency (DLR) for acquiring and providing TerraSAR-X data under the research project GEO0179.
International Archives of the Photogrammetry, Remote Sensing and Spatial Information Sciences, Volume XL-1/W3, 2013 SMPR 2013, 5 – 8 October 2013, Tehran, Iran