THE DESIGN OF INTELLIGENT WORKFLOW FOR GIS FUNCTIONS: A DATA
QUALITY PERSPECTIVE
Jung-Hong Honga, *, Min-Lang Huang b
a
Department of Geomatics, National Cheng Kung University, 1, University Rd., East Dist., Tainan City 701, Taiwan - [email protected]
b
Department of Geomatics, National Cheng Kung University, 1, University Rd., East Dist., Tainan City 701, Taiwan- [email protected]
KEY WORDS: Quality-aware, quality information, GIS functions
ABSTRACT:
Despite data quality has been long recognized as an essential component of geospatial data, it didn’t receive its deserved attention in the GIS-based applications. Due to the lack of a comprehensive framework for modelling, distribution and analysis of data quality of heterogeneous geospatial data, users are often forced to deal with data of unknown or unclear quality, an unpredictable level of risk is hence inevitable. With the rapid growth of data sharing mechanism, a close link between data producers and domain users must be established. We argue the use of quality information must be fully integrated with the commonly used GIS functions and further extended to the visualization of operation results. This is especially necessary for users who do not possess the required knowledge to correctly interpret the illustrated results in GIS-based interface. We first proposed a quality-aware workflow driven by standardized quality information, then use “data select” function as an example to demonstrate how the consideration of quality information can be assimilated into the design of GIS functions to ensure the correct interpretation of final results. The proposed workflow will not only improve the interoperability when integrating geospatial data from different resources, but also tremendously upgrade the intelligence of GIS-based operations to avoid wrong decision making.
* Corresponding author. This is useful to know for communication with the appropriate person in cases with more than one author. 1. INTRODUCTION
Despite data quality has been long recognized as an essential component of geospatial data, how to correctly use acquired data remains a big challenge to GIS uses. The integration of data potentially brings more possible error to the final results (Lanter and Veregin, 1992). As the sharing of geospatial data becomes increasingly easy and convenient, the discrepancy and heterogeneity of data quality between datasets acquired from various georesources must be taken into consideration. However, due to the lack of a comprehensive framework for modelling, distribution and analysis of data quality of heterogeneous geospatial data, GIS users are often forced to deal with data of unknown or unclear quality. An unpredictable level of risk is hence inevitably hidden in the final decisions. Such awareness of data quality must extend to the design of GIS functions, which GIS users often naively use to analyse and derive new information. Otherwise GIS users are constantly working in a risky application environment.
The quality of the geospatial data serves as the basis for determining its fitness for use to a particular application. For example, the making of topographic maps must follow rigorous specifications to ensure the quality of the final product. As different scales of maps represent different levels of quality, users are trained to select the “right” scale of maps for their applications. In Goodchild (2002), he proposed the concept of measurement-based GIS, where the details of measurements will be retained for propagating the error of position. The scope of spatial data quality is no longer restricted to the well-known “positional accuracy” anymore (Devillers, 2006). The ISO19113, 19114 and 19138 (will be replaced by ISO19157) are standards specifically designed to address the issue of
principles, evaluation and measures of data quality by the International Standard Organisation (ISO). These standards provide a standardized framework on the measurement of various types of spatial data quality and its documentation (Devillers et al., 2010). The data distributor must store, maintain, and provide access to the metadata that describes the data quality, licensing and pricing properties (Dustdar, S., R. Pichler, et al. 2012).
The concept of “Quality-aware GIS” (Yang,2007; Devillers et al.,2005; Devillers and Zargar,2009) intended to include the consideration of data quality into GIS-based functions. Rather than waiting for experts to individually inspect the quality of selected datasets, the quality-aware GIS automatically prompts useful information to aid users’ decision making. Devillers et al.(2007) and Yang (2007) transformed the data quality information into symbols to enable the illustration of their differences in the map interface. Zargar and Devillers (2009) modified the “MEASURE” operation in ArcGIS to demonstrate that the inclusion of quality report (position accuracy, completeness and logical consistency) can improve the quality of decision making. Hong and Liao (2011) proposed the theory of “valid extent” to illustrate the data completeness status of multiple datasets in the map interface. As the availability of quality information becomes possible, its use becomes even more versatile in the integrated GIS-based applications. This paper intends to propose a new workflow for the design of GIS functions by taking the development of quality-aware applications into considerations.
The remainder of this paper is organized as follows: Section 2 explores the relationship between quality information of International Archives of the Photogrammetry, Remote Sensing and Spatial Information Sciences, Volume XL-2/W1, 2013
geospatial data and GIS functions. Section 3 proposes the encoding strategy for geospatial data and its quality information. Section 4 presents the general workflow for implementing the quality-aware concepts into basic GIS operations. Finally, section 5 concludes our major findings.
2. REQUIRED DATA QUALITY OF GIS OPERATIONS
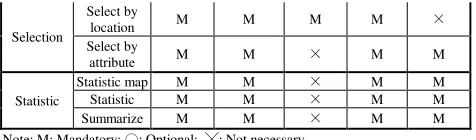
GISs are often considered as a “toolbox” capable of handling complex issues with hundreds of useful and powerful functions. Every GIS function has its own purpose, input, output and algorithms. GIS professionals are expected to have the ability to select the “right” functions and “right” data to solve the problems. However, current GISs often operate under an assumption that the input data is perfect for the conditions the functions are designed. Data quality information is often ignored even if it is documented in the metadata. Except the display of metadata, the support of data quality interpretation and evaluation of current GIS functions is extremely limited. For example, it is important to be aware of the difference of time, accuracy, scale and criteria of the selected datasets in a map overlay task, but most of the time we are only presented a superimposed result of selected datasets for visual inspections without any other information to indicates the differences. By taking data quality into consideration, we increase the intelligence of GIS functions and avoid wrong decision making. We first select thirty frequently used GIS functions (selection, thematic search and measurement) and analyse their purpose, algorithm, input, and output, then further analyse the data quality elements that must be considered for each function. The following data quality elements from ISO19113 are considered: completeness, logical consistency, positional accuracy, thematic accuracy and temporal accuracy. Table 1 shows the relationship of GIS operations and related data quality elements.
Category Function Complete-ness consistency Logical Positional accuracy Temporal accuracy Thematic accuracy
Analysis
Table 1. Basic GIS operations and related quality elements
Three types of GIS functions are discussed in more detail in the following:
(1)Conversion
According to users’ needs, a conversion function changes the original status of features to another status. “Coordinate transformation” is a typical conversion function, which transform coordinates from one coordinate reference system to another to adapt to particular application needs. It is important to analyse how data quality changes after executing conversion functions. For example, although the number of features remains the same, the positional accuracy after coordinate transformation may be tremendously deteriorated if an approximate transformation method is used. Many current GIS packages are like black boxes, they hide the implementation details from users by only allowing them to input data and receive outputs. The ignorance of updating data quality status in metadata after applying conversion functions may cause unpredictable mistakes while users may never notice. Depending on the purpose and types of the conversion, the corresponding data quality elements must be evaluated and added to the design principle (e.g., positional accuracy is necessary in coordinate transformation function).
(2) Measurement
Measurement functions provide tools for users to measure selected properties of features (e.g., distance, area). As it is based on the location of features, the level of positional accuracy must be considered. Many measurement functions allow users to visually “digitize” features in the map window. Under such circumstances, not only the positional accuracy of the features must be considered, how features are presented to users (e.g., zoom level) must be also added into consideration.
(3)Selection
Selection functions allow users to retrieve a subset of features that meets users’ specified constraints. As the queried result is totally dependent on the comparison of data and given constraints, the quality of data has a dominant influence on the result. Data completeness must be considered for any selection functions, as it ensures all the features have been included for selection, nothing more and nothing less. For selection function based on geometric constraints, positional accuracy and topological consistency must be considered. For example, the “touch the boundary of” function is based on the mathematical formalization of topological relationship between two features. Unless the data is created following rigorous topological constraints, one feature seldom really “touch” the other feature. Depending on the type of constraint (e.g., location or attribute), the accuracy of data must be considered.
It is clear that even we have been using GIS functions for a long time, the functions do not provide useful clues to help the correct decision making. After adding the consideration of data quality into function design, the evaluation of the same outcomes may be totally different. Figure 1 illustrates the concept of quality-aware function design. Functions belong to International Archives of the Photogrammetry, Remote Sensing and Spatial Information Sciences, Volume XL-2/W1, 2013
the same category normally have similar design consideration of data quality. But since every function has its own unique characteristics, the modified workflow and corresponding data quality elements still needs to be examined individually.
Figure 1. Relationship between basic GIS operations and quality elements.
3. DATA QUALITY ENCODING STRATEGY
An essential requirement for a quality-aware GIS is the successful distribution and interpretation of quality information. This requires a linking between the distributed geospatial data and its metadata. The OpenGIS approach appears to be a good candidate for distributing these two types of information because of their XML-based nature. As geospatial data is dynamically selected according to application needs, the quality status after data integration must be dynamically determined.
3.1 Data Quality Scope
Theoretically, every quality description has its own data scope, which represents the domain of the data from which the quality information is evaluated. This scope information must be unambiguously specified for every individual quality evaluation result (ISO 19113). This implies that the description is only valid for this specified scope of data. Four major types of scope, namely, dataset series, dataset, feature and attribute, are identified according to how the evaluation of data quality is executed. A hierarchical relationship exists among these four data scopes. Since a dataset is composed of a number of features, the data quality information can be recorded at the level of dataset if the evaluation procedure in the whole dataset is consistent or all the features within the dataset share the same content of quality information. This property simplifies the encoding of data quality information and avoids unnecessary duplicates on the data quality information at the feature level. If the data quality is different from one feature to another (e.g., positional accuracy), then the quality information would be recorded at the feature level.
Although the majority of current quality information refers to individual datasets, it may also refer to a dataset series, feature, or attribute under certain conditions. For example, the quantitative measures for data completeness are based on the omission error and commission error after the dataset has been compared with the universe of discourse, so the data scope by default refers to a single dataset. The positional accuracy, on the other hand, may refer to either a dataset or a feature depending on the positioning technology and surveying procedures being used. Table 2 lists the data scopes and corresponding quality Table 2. Data quality consideration of geospatial data 3.2 Encoding Strategy of Data and Quality
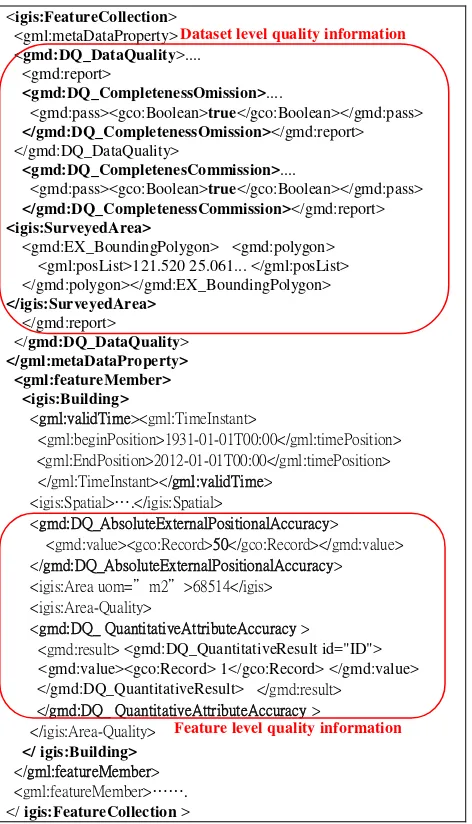
The distributed geospatial data and its quality information in this paper are encoded in GML and XML following ISO19136 and ISO19157, respectively. The open encoding framework allows applications to transparently parse necessary temporal, geometric, attribute and quality information on the basis of individual feature. Figure 2 shows a GML encoding example of the dataset “building”. The tag of SuveyedArea is an expanded element following the suggestion of Hong and Liaw.(2010).
<igis:FeatureCollection>
<i i :Sp i >….</igis:Spatial>
<gmd:DQ_AbsoluteExternalPositionalAccuracy> <gmd:value><gco:Record>50</gco:Record></gmd:value> </gmd:DQ_AbsoluteExternalPositionalAccuracy> <igis:Area uom=”m2”>68514</igis>
<igis:Area-Quality>
Figure 2. Example of “building” dataset encoding.
4. IMPLEMENTATION
4.1 Workflow rule of Quality-aware GIS operations
One distinct difference between traditional GIS and quality-aware GIS is the former deals with the data only, while the latter
Dataset level quality information
Feature level quality information International Archives of the Photogrammetry, Remote Sensing and Spatial Information Sciences, Volume XL-2/W1, 2013
help users to evaluate the difference between the results and reality. To add data quality into consideration, the design of GIS function workflow needs to be re-examined. The design of GIS function typically involves three components: input, algorithm and output. The input component demands both the geospatial data and its metadata, as described in section 3. In addition to the current workflow, the modified algorithm must additionally include the evaluation and constraints of data quality. Finally, the output component must be augmented with new design for visualizing the data quality status after executing the functions. The modification to the current design of GIS function may vary according to its purpose. The following discussion uses “data select” function as an example to explain the design of quality-aware functions. Regardless of the type of constraint, the major purpose of a “data select” function is to filter out a subset of data from the original dataset with given constraint. The result nonetheless only reflects what has been recorded in the data, which may be different from the real situation unless data quality is considered.
4.1.1 Input
After users select a number of datasets, the input component is responsible of parsing the spatial, temporal, identification and quality information of features. Any missing information must be carefully identified and prompted to users for further actions. For example, the data completeness information serves as the basis for evaluate the queried results. Users can deselect those datasets with incomplete quality information to avoid wrong decision making. It is common that different data quality elements may be necessary for different GIS functions.
4.1.2 Algorithm
Depending on the purpose of the functions, different consideration regarding data quality must be added to provide useful aids to users. Since the queries result can be later used for calculating the number, area, length and volume for the selected feature, every “data select” function must take the “data completeness” of the queried dataset into consideration. A formal way for geographically describing the completeness status has been proposed by Hong and Liao (2011). For the “select by region” function, the queried region must be completely within the surveyed area of the dataset to ensure all the features within the queried region are returned. Otherwise the returned result may only represent partial data and any consequent statistical report may become false. If there are omission and commission error, then it is possible that some features may be missing or wrongly created, users must be aware of such possible risks. The “select by region” is based on the topological relationships between queried region and features, so the positional accuracy must be considered as well. Finally, it may be meaningless to conduct a spatial query if the valid time of the features and queried region is different in some applications. All of these factors that may influence the outcome of the results must be unambiguously prompted to users with appropriate interface technique. This suggests that the modified algorithm must additionally consider the possible influence brought by the data quality of the dataset, while the traditional design considers the data only.
4.1.3 Output
The output component is responsible for providing useful textual or visual aids to inform users about the data quality status in the applications. For the “select by region” function, the geometric intersection of the queried region and the surveyed area of dataset must be provided to users for visual inspection. Especially for region that is part of the queried
region and outside of the surveyed area of the dataset, it represents an area where no information is available. This visual approach subdivides the map interface into regions of different data quality status, so that users are always aware of any possible risks while making their decisions.
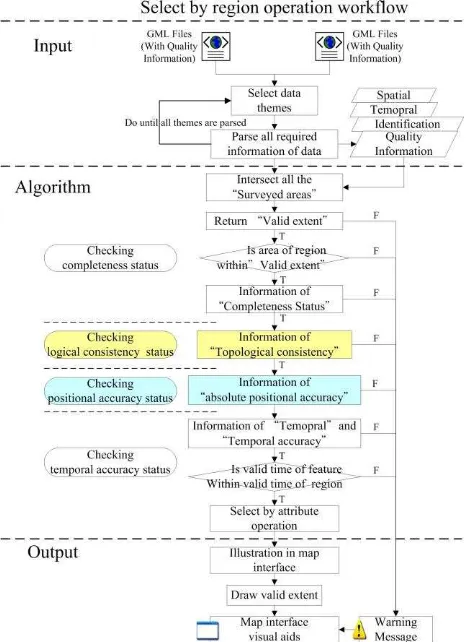
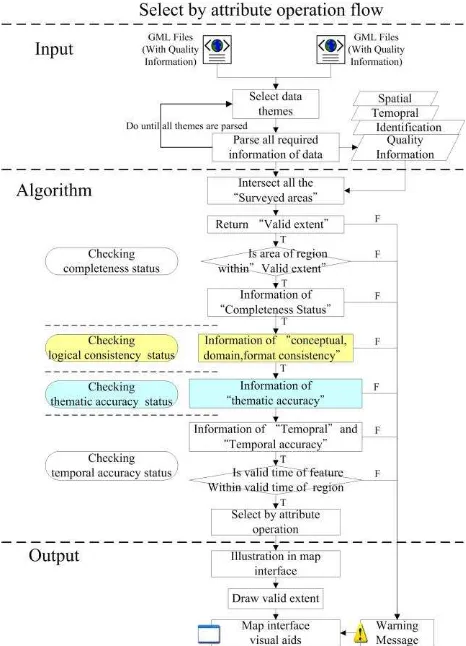
By incorporating data quality information into the workflow design of GIS functions, we add a new perspective to the development of intelligent GIS functions. The quality-aware result provides a reasonable evaluation about the situation in reality. The selection of necessary data quality elements for individual GIS function depends on its unique purpose and characteristics. For example, the design of “select by attribute” function needs to consider data completeness and attribute accuracy. Figure 3 and 4 respectively show the modified workflow of “select by region” and “select by attribute” function. They follow similar concept of workflow design, but each has its own unique algorithm for addressing the data quality issue.
Figure 3. Workflow rule of select by region operation. International Archives of the Photogrammetry, Remote Sensing and Spatial Information Sciences, Volume XL-2/W1, 2013
Figure 4. Workflow rule of select by attribute function.
4.2 Use Case
The following discusses the implementation of the “select by region” function to demonstrate how the quality information can be assimilated into the design of GIS functions. All of the test were developed using Visual Basic and ESRI ArcGIS 10. The evacuation plan for Chlorine gas exposures from a semiconductor company in Tainan Science Park, Tainan city, Taiwan is chosen as the test scenario. The Tainan Science Park is situated between Xinshi, Shanhua and Anding District of Tainan City with a total area of 2,578 acres. With the information of the threat zone available, the most straightforward solution for this task is to use the “selection by region” function on the data that can provide citizens’ locations, e.g., buildings, schools, factory, etc. This is typically regarded as a geometric function, where features are added to the result if their locations are within the threat zone. This, however, only works when the surveyed area of the selected dataset contains the spatial extent of the threat zone. Otherwise a warning message or visual aids must be prompted to users to inform the possible risks (some of the citizens may not be found). As this is often an emergence situation, decisions based on incomplete data or outdated data will potentially lead to serious damages to the public.
We use ALOHA (Area Locations of Hazardous Atmospheres) software to simulate the spatial extent of the threat zone. ALOHA is an air dispersion model used to predict the movement and dispersion of gases (EPA, NOAA, 1999). This software calculates the downwind dispersion of a chemical cloud based on the toxicological/physical characteristics of the released chemical, atmospheric conditions, and specific
circumstances. Figure5 illustrates the output (threat zone of Chlorine gas exposures) calculated by ALOHA software.
Figure 5. The threat zone of Chlorine gas exposures we demonstrate
Figure 6 illustrates the results after applying the modified “select by region” function. The polygon depicted by cross-line symbols represents the overlapped region of the predicted Chlorine gas threat zone and the surveyed area of the building dataset. With the addition of quality information, it indicates all buildings within this region have been found and put into the evacuation list. The yellow polygon indicates the surveyed area of the building dataset outside the Chlorine gas exposures region. Buildings outside region do not need to be evacuated. In the black region but outside ValidExtent (Figure 6) area indicates the subpart of the Chlorine gas exposures region where no information about buildings is available.
Figure 6: Valid extent of threat zone and selected building datasets.
Without the consideration of data completeness information, a user may naively assume that the buildings being found within the black region (e.g., the ValidExtent in Figure 6) are all the buildings that need to be evacuated. When multiple datasets about the citizens’ location are available, every dataset must be evaluated separately and a warning message must be issued if its surveyed area doesn't completely contain the Chlorine gas exposures region. The ideal scenario is when queried region (threat zone) is within the surveyed area of all the selected datasets.
The message box in Figure 7 is automatically prompted to users to indicate that users should be cautious about the data quality status of the searched results. Furthermore, visual aids must be International Archives of the Photogrammetry, Remote Sensing and Spatial Information Sciences, Volume XL-2/W1, 2013
promptly presented to remind users of the data quality status of the illustrated content in the map interface.
Figure 7: Quality information for selection by region operation.
5. CONCLUSION AND FUTURE OUTLOOK
The development of SDI facilitates a powerful data sharing mechanism for various domains of users to take advantages of the versatile georesources in the internet. In the future GIS-based applications, the role of data quality information should not be restricted to auxiliary information, but rather a mandatory consideration to ensure the correct use of data. To meet such demands, the design of GIS functions must be re-examined to add the consideration of data quality, so that users are automatically aware of the quality status of the outcomes. Even a simple and straightforward function may require multiple data quality components and more complicated algorithms to ensure the correctness of results. Meanwhile, a linking between geospatial data and standardized metadata is necessary, otherwise the quality-aware GIS is no different from the current GISs. To address the increasingly complicated challenges while integrating different resources of data, the innovated integration of quality-aware GIS and OpenGIS will enable an intelligent and interoperable application environment in the coming future.
References:
Devillers, R., Bédard, Y., & Jeansoulin, R., 2005. Multidimensional management of geospatial data quality information for its dynamic use within GIS. Photogrammetric Engineering and Remote Sensing, 71(2), pp. 205-215.
Devillers, R., R. Jeansoulin, et al., 2006. Fundamentals of spatial data quality, Wiley Online Library.
Devillers, R., B´edard, Y., Gervais, M., Jeansoulin, R., Pinet, F., Schneider, M., Zargar, A., 2007. How to improve geospatial data usability: From metadata to Quality-Aware GIS Community, Spatial Data Usability Workshop, AGILE 2007 Conference.
Devillers, R. and Zargar, A., 2009. Towards quality-aware GIS: Operation-based retrieval of spatial data quality information. Spatial Knowledge and Information (SKI) Conference, Fernie (BC), Canada.
Dustdar, S., R. Pichler, et al. 2012. Quality-aware Service-Oriented Data Integration: Requirements, State of the Art and Open Challenges. Sigmod Record 41(1)
Goodchild, M. F., 2002. CHAPTER ONE Measurement-based GIS. Spatial data quality.
EPA, NOAA, 1999. Area Locations of Hazardous Atmospheres
(ALOHA),User’s Manual, US Environmental Protection
Agency (USEPA) and the National Oceanic and Atmospheric Administration (NOAA).
Hong, J.-H. and Huang, M.-L, Kuo, C.-L. and Tseng, Y.-W. ,2010. A Spatio-Temporal Perspective towards the Intelligent and Interoperable Data Use in SDI Environment, AGIS 2010 International Conference.
Hong, J.-H. and H.-P. Liao. 2011. Incorporating visualized data completeness information in an open and interoperable GIS map interface. Journal of the Chinese Institute of Engineers 34(6): 733-745.
Lanter, D. P. and Veregin, H.,1992. A research paradigm for propagating errorin layer–based GIS. Photogrammetric
Engineering and Remote Sensing, vol. 58, no. 6, pp. 825–833.
Yang, T., 2007. Visualisation of spatial data quality for disturbuted GIS, The University of New South Wales, Australia. Zargar, Amin, Devillers, Rodolphe, 2009. An Operation-Based Communication of Spatial Data Quality. 2009 International Conference on Advanced Geographic Information Systems & Web Services ,pp.140-145.