A BAYESIAN NETWORK FRAMEWORK FOR AUTOMATIC DETECTION
OF LUNAR IMPACT CRATERS BASED ON OPTICAL IMAGES AND DEM DATA
J. Yang, Z. Kang*
Department of Remote Sensing and Geo-Information Engineering, School of Land Science and Technology, China University of Geosciences, Xueyuan Road, Beijing, 100083 CN – [email protected], [email protected]
KEY WORDS: Bayesian Network, CCD Images, Digital Elevation Model, Impact Crater Recognition, Data Integration
ABSTRACT:
Impact craters are among the most noticeable geo-morphological features on the planetary surface and yield significant information on terrain evolution and the history of the solar system. Thus, the recognition of lunar impact craters is an important branch of modern planetary studies. To address problems associated with the insufficient and inaccurate detection of lunar impact craters, this paper extends the strategy that integrates multi-source data and proposes a Bayesian Network (BN) framework for the automatic recognition of impact craters that is based on CCD stereo camera images and associated Digital Elevation Model (DEM) data. The method uses the SVM model to fit the probability distribution of the impact craters in the feature space. SVM model, whose output is used as the intermediate posterior probability, is embedded in the Bayesian network as a node, and the final posterior probability is obtained by integration under the Bayesian network. We validated our proposed framework with both CCD stereo camera images acquired by the Chang’e-2 satellite and DEM data acquired by Lunar Reconnaissance Orbiter (LRO). Experimental results demonstrate that the proposed framework can provide a very high level of accuracy in the recognition phase. Moreover, the results showed a significant improvement in the detection rate, particularly for the detection of sub-kilometer craters, compared with previous approaches.
1. INTRODUCTION
It is well known that lunar exploration and planetary science research has crucial practical and strategic significance. At the beginning of the 21st century, leading countries and organizations in the aerospace industry initiated a new round of lunar exploration projects with the goal of returning to the moon (Ouyang et al. 2002). NASA's Lunar Reconnaissance Orbiter (LRO) and Lunar Crater Observation and Sensing Satellite (LCROSS) pushed the moon exploration research into a new climax. The coverage area and data resolution of China’s “Chang’E-1” and “Chang’E-2” satellites have been improved (Li et al. 2010), and these satellites have provided reliable data for studies of the spatial differences and distributions of linear and circular structures that are associated with impact craters (Montopoli et al. 2011a, Montopoli et al. 2011b, Hu et al. 2014 and Hu et al. 2013). The “Chang’E-1” and “Chang’E-2” satellites have played a prominent role in these studies because they provide relatively fine-resolution multispectral and LIDAR data .
The complex topography and geomorphology of the moon’s surface has been studied by determining the distribution and characteristics of linear and circular structures (Chen et al. 2010, Chabot et al. 2000, Morota et al. 2003, Urbach et al. 2009 and Hawke et al. 2004). Impact craters are the most typical geo-morphological unit and the most basic geo-geo-morphological features of the moon, and their morphological characteristics and spatial distribution have been examined in recent studies. The presently proposed extraction method of impact craters from images can be classified into two categories, morphological fitting and machine learning. Both approaches have their own advantages. The former has better recognition effect when the terrain is relatively simple and the edges are clear, whereas the result of the latter is closely related to the learning samples and decision parameters. The method based on morphological fitting mainly uses the geometric shape of the impact craters on the image, whose edge is generally round or oval, and automatically
* Corresponding author.
identify the impact craters through the pattern recognition. The image (Magee et al. 2003, Kim et al. 2003 and Bruzzone et al. 2004) on Mars is processed by the circular Hough transform to identify the impact craters automatically. An elliptical detection method based on generalized Hough transform (GHT) (Leroy et al. 2001) is proposed to identify the asteroid impact craters. Using the simple black background and white round crater template with different sizes, the fast Fourier transform (FFT) method (Bandeira et al. 2007) was used to calculate the correlation between the template and the processed binary map, and then the impact craters were determined according to the correlation. Many research scholars also introduce the idea of machine learning into the automatic identification of craters, and construct the model classifier to detect the impact craters. As for automatic mapping of planetary surface, the SVM-based method (Stepinski et al. 2007 ) is used to classify the craters on the surface of Mars, the detection rate of which can reach 91%. A variety of supervised learning methods (Wetzler et al. 2005) were used to identify the impact craters of Mars, and the SVM-based method was verified to be superior to the method SVM-based on boundary extraction, such as Hough transform. Sparse boosting algorithm (Wang et al. 2015) was constructed to detect the impact craters in the high resolution planetary image. A modified boosting approach (Jin et al. 2014) was developed to detect small size craters on Mars.
In terms of detecting craters by combining images with DEM data, the template matching and elliptic fitting method (Kim et al. 2003) were used to extract the impact craters on lunar surface based on imagery and DEM data. A novel framework (Degirmenci et al. 2010), in which craters were extracted from Mars Digital Image Model and crosschecked by using Mars Digital Elevation Model, was developed by fusing data obtained from Mars Global Surveyor. Kang et al. 2015 utilized conditional matching to extract craters from the CCD image, incorrect extraction of which was removed based on the DEM data. However, DEM is only used as an auxiliary data to support
image analysis in the study of co-extraction of craters on the basis of image and DEM data.
Bayesian network (Koller et al. 2009) is a directed acyclic graph model which is used to express the probabilistic dependencies among variables. Multi-source information can be organized as the node of graph structure and processed effectively according to their relationship. Each node is able to play a role in the reasoning process because the result is calculated in terms of all nodes. The methods based on Bayesian maximum likelihood were proposed (Walter 2004 and Bartels et al. 2006). However, Bayesian Maximum likelihood classifier assumes that the classes have Gaussian probability distribution functions, which may not be suitable when spectral and elevation data are combined (Cao et al. 2012) Moreover, it is extremely difficult for a particular data to define a proper distribution model. To avoid improper Gaussian assumption, possible probability distribution estimation methods are investigated, one of which is the powerful SVM algorithm (Cao et al. 2012). It is a distribution-free approach, which requires no specific probabilistic assumption of data distribution. Hence, SVM model in this paper was embedded in Bayesian network, which is used to identify the craters automatically by fusing the CCD image and DEM data.
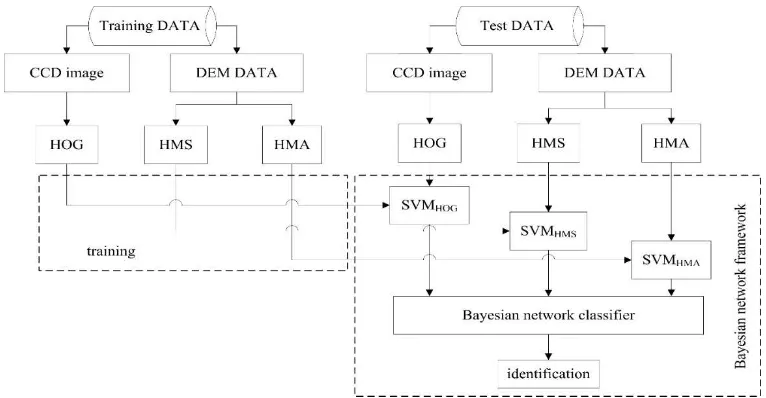
Based on an analysis of characteristics of CCD images and DEM data, we extend the strategy that integrates multi-source data and present a Bayesian Network framework, which combined CCD images with DEM data, for the automatic recognition of impact craters. Fig.1 shows the flow chart of automatic extraction of impact crater. The structure of the paper is organized as follow. Section 2 describes the feature extraction of impact craters. We first extract Histogram of Oriented Gradient (HOG) with CCD
images, which describes the local shape information of impact crater in the optical image and calculate morphological factors mainly including slope and aspect using DEM data and then the multi-scale frequency histograms based on the calculated morphological factors are established with spatial pyramid theory, which represents the morphology of impact crater in the three dimensional space. In section 3, Support Vector Machine (SVM)-based probability estimator is adopted to compute data probabilistic distribution. In this stage, three SVM classifiers are trained using HOG, Histogram of Multi-scale Slope (HMS) and Histogram of Multi-scale Aspect (HMA) respectively and performed for the initial detection, and then a Bayesian network-based framework is constructed to combine the initial detection result for the final decision. Section 4 show experimental studies for verifying the proposed framework. This paper concludes with a discussion of future research consideration in section 5.
2. FEATURE EXTRACTION OF IMPACT CRATERS
2.1 Image Feature Extraction
The pattern of the craters on the lunar surface has a certain regularity on images, the edges of which are mostly round or oval from the simple bowl-type craters to the complex craters with a central peak. However, the illumination conditions in different areas of the lunar surface are inconsistent. In order to overcome the influence of the environment, the feature extracted from images needs to be insensitive to light.
The HOG feature is proposed by Dalal (Dalal et al. 2005) to describe the gradient intensity of the local region of the image and the gradient direction distribution. HOG feature has good robustness and is almost not affected by the gray scale, the Figure 1 The flow chart of automatic extraction of impact crater by fusing CCD image and DEM data under the Bayesian network
framework
Figure 2 The flow chart of HOG feature extraction
(a) (c) (d)
cell block
(b)
20 40 60 80 100 120 140 160 20
40 60 80 100 120 140 160
illumination change and the noise since it is calculated on the local region of the image. The information of the object can be better represented by the HOG feature if it has a specific pattern and even some local subtle changes. The shape information of the impact craters on images can be well described by the HOG feature due to the fact that the craters are similar to the circle or oval. Thus, the HOG feature is well suited as a feature of the craters of the lunar surface.
Figure 2 indicates the flow chart of HOG feature extraction, that is to say an image is divided into several cells and the neighboring cell cannot overlap (figure 2(b)). Gradient direction in each cell is counted to establish the histogram which is used as feature descriptor of the cell, in other words, all gradient directions are divided into 9 bins as the horizontal axis of the histogram and the gradient value corresponding to the angular range is added as the vertical axis of the histogram. Nevertheless, the range of the gradient is relatively large since the illumination condition varies. Therefore, adjacent 2x2 cells are merged into a block, as shown in figure 2(c), the feature descriptor of which the descriptors of all the cells in a block are concatenated as. And then the descriptor of each block is normalized to better adapt to changes in light and shadows, which is of significance for enhancing the detection rate. Meanwhile, there is some overlap between adjacent blocks so that the spatial information can be integrated into the feature vector effectively, which is beneficial to detection results. The descriptors of all the blocks in an image are concatenated together as the final feature vector used to describe the current image. Figure 2(d) provides the HOG feature map of each cell in the current image.
Figure 3 compares the HOG feature map of the impact craters and non-impact craters. It can be concluded that the HOG feature describes the contour information of the impact craters on the image effectively, while the HOG feature map of non-impact craters is not regular.
2.2 Morphological Feature Extracted from DEM Data HOG is a descriptor that can describe the edge information of an object in an image effectively. By calculating the histogram of the gradient direction of the local region, the HOG feature can
not only well express the edge information of the impact craters
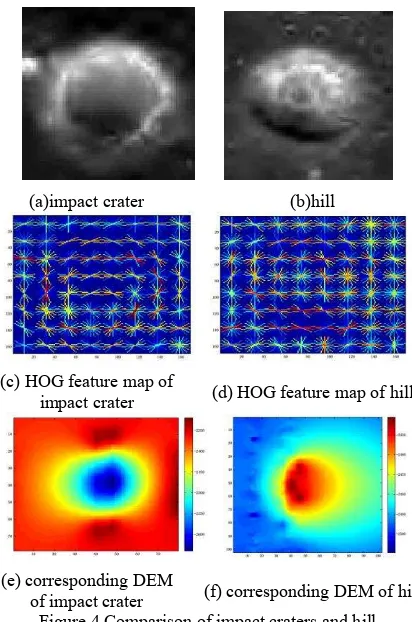
on the two-dimensional image, but is also insensitive to the change of the illumination. However, the HOG feature map of other structures on the moon’s surface, such as hill (figure 4(a) and (b)), may be similar to that of the craters (figure 4(c) and (d)). Thus, the representation of the feature vector is limited if the craters are described only from a single perspective, such as the edge information of the impact craters. With the improvement of the spatial resolution of DEM data, quite a few researchers have begun to analyze the shape of the impact craters in three-dimensional space (as shown in figure 4 (e) and (f)) and use morphological information to identify and extract craters automatically.
DEM contains a large number of important factors which describe the terrain of the crater, such as slope, aspect, etc. These morphological factors which represent the terrain structure and spatial form of the craters in the three-dimensional space are quantitative data that are what image-based analysis method fail to provide. Kim et al. 2005 and Michael et al. 2003 applied slope measurements to the identification of the craters, where they considered the area with a high slope change to be the edge of the crater, which successfully identified 75% of the craters with a diameter greater than 10 km. Bue et al. 2007 not only considered slope information, but also added texture analysis and profile curvature analysis to detect the craters. Simpson et al. 2008 utilized high resolution HRSC stereo imagery to construct 3D crater model and recognized the craters automatically by terrain profile analysis. Di et al. 2014 used a new scaled Haar-like feature combined with Haar-Haar-like and LBP features to train the cascade classifier for crater detection on the basis of Mars DEM. The Flooded method, the Object-Oriented method and the Flooded Object-Oriented method (Wan et al. 2012) were implemented for automatic extraction of the impact craters based on based on the DEM data originating from Change’E-1 CCD stereo camera.
(a)impact crater (b)hill
(c) HOG feature map of
impact crater (d) HOG feature map of hill
(e) corresponding DEM
of impact crater (f) corresponding DEM of hill Figure 4 Comparison of impact craters and hill
(a)impact crater (b)HOG feature map of impact crater
(c)non-impact crater (d) HOG feature map of non-impact crater Figure 3 HOG feature map of impact crater and non-impact
crater
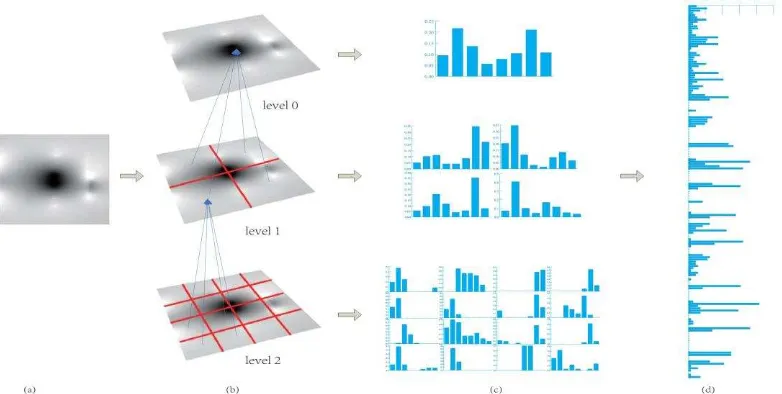
In order to represent the 3D shape of the craters, Histogram of Multi-scale Slope (HMS) and Histogram of Multi-scale Aspect (HMA) are constructed, which introduce the spatial information into the feature vector based on the spatial pyramid matching theory (Grauman et al. 2005). Figure 5 demonstrates the flow chart of extracting HMA of the craters based on the DEM data. We firstly calculate the slope probability histogram at the original spatial scale of the DEM data, where all the slope directions are divided into 8 bins as the horizontal axis of the histogram and the slope value corresponding to the slope is added as the vertical axis of the histogram. Then, The length and width of DEM data are divided into l
2 units respectively, which means we can get l
4 patches of the same size DEM data, where l represents the lth layer of the pyramid (in this paper, l1,2). The histogram of the slope probability of each patch is then counted respectively and concatenated as the feature of the lth layer. Finally, the histogram of all layers of the DEM data is concatenated together as a feature vector that describes the 3D shape of the craters. Likewise, HMS can be also established.
The DEM, in this paper, is divided by the regular grid of various scales, and the slope or aspect histogram model of each patch in each scale is counted and arranged in a certain order to construct the probability model containing the spatial information. These spatial relationships between the local region is extremely crucial to improve the performance of the feature vector, which not only describe the 3D shape of the craters, but also represent the spatial layout well. As seen from figure 5(c), the size of the feature vector increases with decrease in the spatial scale, and the multi-scale feature vector describes the morphological changes of the craters in the three-dimensional space from coarse to fine and well establishes the spatial relationship of the local region.
3. BAYESIAN NETWORK-BASED FRAMEWORK FOR AUTOMATIC DETECTION
3.1 Probabilistic Distribution Estimated by SVM
In view of the fact that collecting training samples of impact craters is difficult and the size of HOG, HMA and HMS is high, SVM-based method was used to estimate probabilistic distribution of feature space in this paper since it performs well
for classifying high-dimensional data with limited training samples (Cao et al. 2012).
SVM (Cortes et al. 1995) is a two-class model introduced initially by both Cortes and Vapnik in 1995 and its key idea is to transform the non-linearly separable features to a higher dimensional space by using the kernel function and then construct the optimal hyperplane, which should be as far away from the data of both classes as possible, with the structural risk minimization. Let data set be D{(x1,y1),(x2,y2),...,(xn,yn)}, hyperplane can be found by solving the following constrained optimization problem
We need a Lagrange multiplier i for each of the constraints.
Thus, the new objective function is
)
Given that all constraints are met, minimizing 2 2 1
ω is equivalent to minimizing(ω).For the details, please reference to (Andrew et al. 2000).
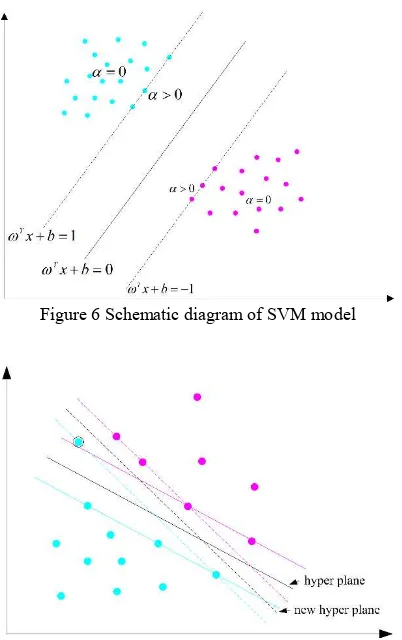
As shown in figure 6, the full line in the middle is the large-margin decision hyperplane which is equal to the distance between the two dotted line on which the support vectors are. In fact, Lagrange multiplier of all the non-support vectors ,i.e.
1 that is to say, the optimal decision hyperplane is determined only by the support vectors, i.e. ωTxb1 shown in figure 6. For describing and approximating the probability distribution of the craters efficiently due to the limited training data, we enhanced the performance of the trained SVM model by selecting the optimal sample set, inspired by MI-SVM (Andrews et al. 2016). The detailed process is as follows:
ķLet test data be A, which is selected randomly in the whole samples and constant during iterations. The remaining samples, which do not belong to A in the whole samples, are categorized into two groups, one of which is used as the initial training data marked as B for SVM model and the other of which is considered as training sample library marked as C. ĸEach sample in C is classified by the SVM model trained by B and the distance between the current hyperplane and each sample is calculated. Then, the training data B are updated according to the following rules. i) The sample in C
is added to B if it is classified wrongly. ii) As for an unknown sample, the bigger the distance between the sample and the hyperplane, the bigger the confidence of the classification result. Hence, the samples in C are selected and added to B according to the distance between the hyperplane and the samples when there is no false classification. Subsequently, the SVM model can be updated based on the new training data B (as shown in figured 7). The test data A is classified by the new SVM model and its detection rate is recorded.
ĹRepeat stepĸ until the fluctuation of the detection rate is less than the threshold .
In figure 7, the blue point with a black box is the sample that is classified wrongly by the current decision hyperplane, and the black full line is the current decision hyperplane while the black dotted line denotes the new optimal decision hyperplane optimized by iteration.
The class information acquired from SVM model can be transformed into intermediate posterior probability by calculating the distance between the unknown sample and the hyperplane after the optimal hyperplane is trained. The output of standard SVM model, that is to say the distance between the unknown sample and the optimal hyperplane, is processed and transformed into the posterior probability by using sigmoid-fitting method (Platt 2000) as follow.
)
Sigmoid-fitting method not only preserves the sparseness of SVM model, but also estimates the posterior probability well.
3.2 Class Posterior Probability Calculated under The Framework of Bayesian Network
Bayesian network (Koller et al. 2009) is a directed acyclic graph model, where the node denotes the random variable and the directed edge represents the probabilistic dependencies among variables. Inspired by Kononenko et al. 1991 and Tao et al.2010, we divide the features of the craters extracted in section 2 into three group, i.e. HOG, HMA and HMS, the probability distribution of which can be represented by SVM model respectively, and then the SVM model, whose output is considered as the intermediate posterior probability of the node, is embedded as a node into the Bayesian network. Finally, the Bayesian network combines the intermediate posterior probability for the final decision.
In the proposed framework, the class node is the parent of all feature nodes, whose joint probability distribution
)
Figure 6 Schematic diagram of SVM model
Figure 7 Hyperplane optimization based on the optimal sample set
Where 1,2,...,ndenotes the feature node
cdenotes the class node
nis the number of the feature node, n3 in this paper.
For each unknown sample, the posterior probability matrix pij
(i1,2,...,n , j1,2,...,k ,in this paper k2 , i.e. crater and non-crater) consists of the intermediate posterior probability obtained in section 3.1 These posterior probabilities are used as the input of the Bayesian network, and then the joint probability is calculated by Eq. (6), and finally the posterior probability of the class node is obtained. The unknown sample is classified to the class that holds the highest posterior probability.
4. EXPERIMENTATION AND ANALYSIS
To verify the proposed framework, we used CCD images acquired from Chang' E II satellite of Chinese lunar exploration project and DEM data acquired from LRO mission of the United States as experimental data and performed both qualitative and quantitative evaluations on four scenes. Scene I-III covered areas between 38°W and 54°W latitude and 43°N and 55°S longitude, and scene IV covered areas between 23°E and 26°E latitude and 39°N and 41°S longitude. Chang' E II satellite is equipped with a three-line array CCD stereo camera, which can record two images of each small area from the front and rear view, and the image used in this paper is the Ortho-photo image of the whole moon, the spatial resolution of which is about 50m. The spatial resolution of the DEM data is 1024 pixel/degree. The experimental data is shown in figure 8. The DEM data are rendered as grey-scale images (as seen in figure 8(b)(e)(h)(k)), and the red box illustrated in figure 8(c)(f)(i)(l) is the results of visual extraction for the evaluation.
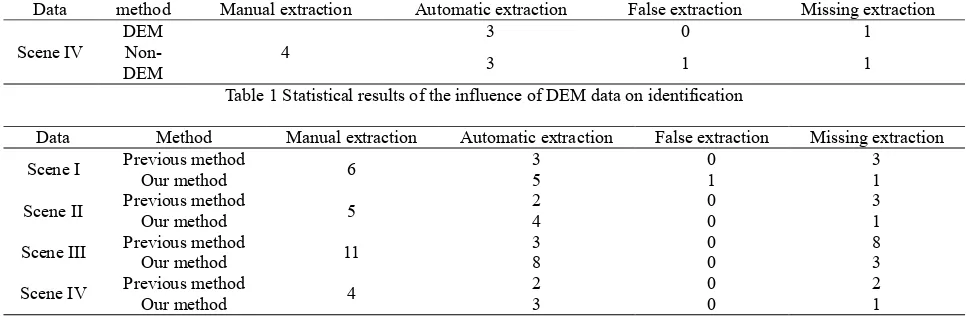
For quantitative evaluation, the extraction results of the experimental data are presented in table 1 and 2. “Manual
extraction” refers to impact craters that were obtained by visual identification, “automatic extraction” refers to impact craters that were obtained using the algorithm, “false extraction” refers to non-impact craters that were extracted by the algorithm, and “missing extraction” refers to impact craters that were not extracted by the algorithm.
4.1 The Influence of DEM Data on Identification
To enhance the accuracy of the extracted craters, we combined the image with the DEM data for the automatic extraction of the impact craters under the proposed framework in this paper. A
(a)Detection results without integrating DEM data
(scene IV)
(b)Detection results with integrating DEM data
(scene IV) Figure 9 The influence of DEM data on identification
(a) Previous method (scene I) (b) Our method (scene I)
(c) Previous method (scene II) (d) Our method (scene II)
(e) Previous method (scene
III) (f) Our method (scene III)
(g) Previous method (scene
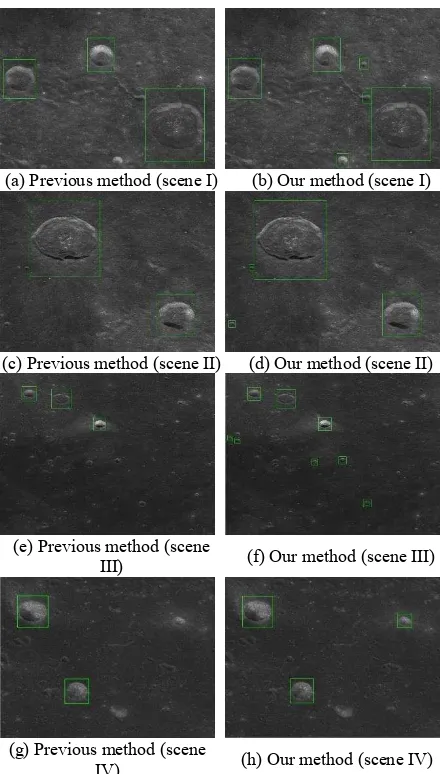
IV) (h) Our method (scene IV) Figure 10 Result comparison between different methods The green box in the figure 10 is the result of the impact craters extracted for the corresponding method.
(a) CCD image
(scene I) (b) DEM data (scene I) detection (scene I)(c) Manual
(d) CCD image
(scene II) (e) DEM data (scene II) detection (scene II)(f) Manual
(g) CCD image
(scene III) (h) DEM data (scene III) (i) Manual detection (scene III)
(j) CCD image
comparative experiment on the scene IV was implemented to evaluate the performance of the method. As shown in section 2.2, the HOG feature of some structure, such as hill, in scene IV is similar to that of the craters, which is arduous to distinguish the craters from the non-craters only using the images. Hence, the 3D shape of the craters was integrated into the automatic identification under the Bayesian network framework. The green box in figure 9 is the results of automatic extraction and the false extraction is where the red arrow points to (as shown in figure 9(a)). The results of the comparison are presented in table 1. We can conclude that it is of utmost importance fusing the DEM data in order to improve the performance of the automatic extraction.
4.2 Comparison with Previous Method
To further evaluate the performance and the robustness of the proposed framework, the previous method (Kang et al. 2015) was compared to the proposed framework in this paper on the scene I-IV. Table 2 lists the comparative results. As shown in figure 10, the previous method is mainly applied to the extraction of large craters, and less prone to the extraction in error, whereas the proposed framework in this paper can provide a much higher level of accuracy in the recognition phase, particularly for the identification of small size and blurred edge craters. However, the local edge information in the optical images and the 3D shape in the DEM data are extracted for the automatic detection of the craters, which is difficult to identify the linear structure (as depicted in Figure 10 (b)). Consequently, quite a few false extractions may occur.
5. CONCLUSIONS
This study extends the strategy that integrates multi-source data and proposes a Bayesian Network framework for automatic detection of impact craters on the basis of CCD image and DEM data. In order to improve the accuracy of the crater extraction, HMA and HMS were constructed on the basis of DEM data of LRO to represent the morphology of impact crater in the three dimensional space, combined with HOG feature extracted to describe the local shape information of impact crater in the optical image under the Bayesian network framework to distinguish craters from non-craters. Experimental results demonstrate that the framework presented in this paper can achieve good performance in the recognition phase. Moreover, the results showed a significant improvement in the detection rate, particularly for the detection of sub-kilometer craters, compared with previous methods. Future research can focus on the improvement of the efficiency of detection by finding crater candidates. Furthermore, some of the impact craters might be removed in error due to the quality of DEM data. This will be
investigated in future research.
REFERENCES
Andrew A. M. , 2000. An Introduction to Support Vector Machines and Other Kernel-based Learning Methods. Printed in the United Kingdom at the University Press.
Andrews S., Tsochantaridis I., Hofmann T. , 2016. Support Vector Machines for Multiple-Instance Learning. HCI International 2016 – Posters' Extended Abstracts. Springer International Publishing.
Bandeira L. P. C., Saraiva J., Pina P. , 2007. Development of a methodology for automated crater detection on planetary images. Iberian Conference on Pattern Recognition and Image Analysis. Springer Berlin Heidelberg:, pp. 193-200.
Bartels M., Wei H. , 2006. Maximum Likelihood Classification of LIDAR Data incorporating multiple co-registered Bands. Proceedings of 4th International Workshop on Pattern Recognition in Remote Sensing/18th International Conference on Pattern Recognition. 20, pp.17-20.
Bruzzone L., Lizzi L., Marchetti P. G., et al. , 2004. Recognition and detection of impact craters from EO products. Proceedings of ESA-EUSC.
Bue B. D., Stepinski T. F., 2007. Machine detection of Martian impact craters from digital topography data. IEEE Transactions on Geoscience and Remote Sensing, 45(1), pp. 265-274. Cao Y., Wei H., Zhao H., et al. , 2012. An effective approach for land-cover classification from airborne lidar fused with co-registered data. International Journal of Remote Sensing, 33(18), pp. 5927-5953.
Chabot N. L., Hoppa G. V., Strom R. G, 2000. Analysis of lunar lineaments: Far side and polar mapping. Icarus, 147(1), pp. 301-308
Chen S., Meng Z., Cui T., et al, 2010. The mapping to geological analysis by lunar satellite remote sensing in rainbow ray area. Chinese Science: Physics Mechanics Astronomy, 40(11), pp. 1370-1379.
Cortes C., Vapnik V., 1995. Support-Vector Networks. Kluwer Academic Publishers.
Dalal N., Triggs B. , 2005. Histograms of Oriented Gradients for Human Detection. IEEE Conference on Computer Vision & Data method Manual extraction Automatic extraction False extraction Missing extraction
Scene IV DEMNon- 4 3 0 1
DEM 3 1 1
Table 1 Statistical results of the influence of DEM data on identification
Data Method Manual extraction Automatic extraction False extraction Missing extraction
Scene I Previous methodOur method 6 35 01 31
Scene II Previous methodOur method 5 24 00 31
Scene III Previous methodOur method 11 38 00 83
Scene IV Previous methodOur method 4 23 00 21
Table 2 Performance comparison between different methods
Pattern Recognition, pp. 886-893.
Degirmenci M., Ashyralyyev S. , 2010. Impact crater detection on mars digital elevation and image model. Middle East Technical University.
Di K., Li W., Yue Z., et al. , 2014. A machine learning approach to crater detection from topographic data. Advances in Space Research, 54(11), pp2419-2429.
Grauman K., Darrell T. , 2005. The pyramid match kernel: discriminative classification with sets of image features. Tenth IEEE International Conference on Computer Vision. IEEE, pp. 1458-1465.
Hawke B., Blewett D. T., Lucey P. G., et al, 2004. The origin of lunar crater rays. Icarus, 170(1), pp. 1-16.
Hu G. P., Chen K., Huang Q.L., et al, 2014. Brightness Temperature Calculation of Lunar Crater: Interpretation of Topographic Effect on Microwave Data From Chang'E. Geoscience and Remote Sensing, IEEE Transactions on, 52(8), pp.4499-4510.
Hu W., Di K., Yue Z., et al, 2013. Crossover analysis and adjustment for Chang’E-1 laser altimeter data. Acta Geodaetica et Cartographica Sinica, 42(2), pp. 218-224.
Jin S., Zhang T. , 2014. Automatic detection of impact craters on Mars using a modified adaboosting method. Planetary and Space Science, 99, pp. 112-117.
Kang Z., Luo Z., Hu T., et al. , 2015. Automatic Extraction and Identification of Lunar Impact Craters Based on Optical Data and DEMs Acquired by the Chang’E Satellites. IEEE Journal of Selected Topics in Applied Earth Observations & Remote Sensing, 8(10), pp. 4751-4761.
Kim J. R., Muller J. P., 2003. Impact crater detection on optical images and DEMs.
Kim J. R., Muller J. P., van Gasselt S., et al. , 2005. Automated crater detection, a new tool for Mars cartography and chronology. Photogrammetric Engineering & Remote Sensing, 71(10), pp. 1205-1217.
Koller D., Friedman N. , 2009. Probabilistic Graphical Models: Principles and Techniques - Adaptive Computation and Machine Learning. MIT Press.
Kononenko I., 1991. Semi-naive bayesian classifier. Springer Berlin Heidelberg, pp. 206-219.
Leroy B., Medioni G., Johnson E., et al. , 2001. Crater detection for autonomous landing on asteroids. Image and Vision Computing, 19(11), pp. 787-792.
Li C., Liu J., Ren X., et al, 2010. The image data processing of Chang’E-1 and the image mapping to the Moon. Chinese Science: D, no. 3, pp. 294-306.
Magee M., Chapman C. R., Dellenback S. W., et al. , 2003. Automated Identification of Martian Craters Using Image Processing. Lunar and Planetary Science Conference. Lunar and Planetary Science Conference.
Michael G. G. , 2003. Coordinate registration by automated crater recognition. Planetary and Space Science, 51(9), pp. 563-568.
Montopoli M., Carlofelice A. D., Cicchinelli M., et al, 2011a. Lunar Microwave Brightness Temperature: Model Interpretation and Inversion of Spaceborne Multi-frequency Observations by a Neural Network Approach. IEEE Transaction on Geoscience and Remote Sensing, 49(9).
Montopoli M., Carlofelice A. D., Tognolatti P., et al, 2011b. Remote sensing of the Moon’s sub-surface with multi-frequency microwave radiometers: A numerical study. Radio Science., 46, p. RS1 012.
Morota T., Furumoto M. , 2003. Asymmetrical distribution of rayed craters on the Moon. Earth and Planetary Science Letters, 206(3), pp. 315-323.
Ouyang Z., Li C., 2002. The progress and the development strategy of deep space exploration in our country. Chinese Aerospace, 12, pp. 28-32.
Platt J. C. , 2000. Probabilistic Outputs for Support Vector Machines and Comparisons to Regularized Likelihood Methods. Advances in Large Margin Classifiers, 10(4), pp. 61--74. Simpson J. I., Kim J. R., Muller J. P. , 2008. 3D crater database production on Mars by automated crater detection and data fusion. ISPRS.
Stepinski T. F., Ghosh S., Vilalta R. , 2007. Machine learning for automatic mapping of planetary surfaces. National Conference on Innovative Applications of Artificial Intelligence. AAAI Press, pp. 1807-1812.
Tao J.B., Shu N., Shen Z. Q., 2010. Continuous Bayesian Network Classifier for Remote Sensing Images Based on Improved Gaussian Mixture Model. Remote Sensing Information. 2, pp. 18-24.
Urbach E. R., Stepinski T. F., 2009. Automatic detection of sub-km craters in high resolution planetary images. Planetary and Space Science, 57(7), pp. 880-887.
Walter V. , 2004. Object-based classification of remote sensing data for change detection. ISPRS journal of photogrammetry and remote sensing, 58(3) , pp. 225-238.
Wan C., Cheng W. M., Zhou Z. P., et al. , 2012. Automatic extraction of lunar impact craters from Chang’E-1 satellite photographs. Science China Physics, Mechanics and Astronomy, 55(1), pp. 162-169.