Chemical and Physical Characteristics of Wood Smoke
in the Northeastern US during July 2002 Impacts from
Quebec Forest Fires
Paper # 94, A&WMA Specialty Conference on: Regional and Global Perspectives on Haze: Causes, Consequences and Controversies, Asheville, NC, October 25-29, 2004.
Richard L. Poirot
Department of Environmental Conservation, Vermont Agency of Natural Resources, Waterbury, VT 05671-0402
Rudolf B. Husar
Center for Air Pollution Impact and Trend Analysis, Washington University, One Brookings Drive, Campus Box 1124, St Louis, Missouri 63130
ABSTRACT
During early July 2002, dense smoke from a number of large forest fires in central Quebec Province was transported south by prevailing winds into the New England and Mid-Atlantic states. Given the high concentrations of smoke, strong flows from the north, and relative absence of other emissions in that direction, this event provides a unique opportunity to evaluate impacts of nearly pure wood smoke at multiple monitoring sites in the Northeast. Continuous measurements of PM2.5 mass from State and Federal monitoring programs and light scattering from (a few) IMPROVE nephelometers and (many) ASOS forward scatter meters reveal highly complex spatial and temporal patterns of smoke impacts at the surface on July 6-8, 2002. Maximum observed 24-hour smoke impacts at most US surface sites occurred on July 7th, which was coincidently a routine filter sampling day for the IMPROVE, STN and FRM (fine mass-only) networks. Combining the continuous PM, light scattering and filter-based chemical data provides insights into the chemical and physical features of the smoke during this “event of opportunity”.
INTRODUCTION
Recently established US EPA regulations for regional haze have led to expansion of measurements of fine particle concentration, composition and light extinction in the IMPROVE network (Interagency Monitoring of PROtected Visual Environments). Recently promulgated National Ambient Air Quality Standards for PM2.5 have led to a deployment and expansion of routine monitoring programs for quantifying concentrations of PM2.5 mass, its spatial and temporal variability and its chemical composition. Recent deployment of ASOS (Automated Surface Observing Systems) including visibility
sensors (Belfort model 6220 forward scatter meter) at National Weather Service sites also provides a unique, new, spatially and temporally dense set of haze and aerosol–relevant data. Growing interest in climate change and associated global radiation budgets have led to recent deployment of sophisticated satellite and aircraft sensors and surface-based solar radiation monitors which provide additional perspectives on aerosol concentrations and optical properties. With support from EPA and Regional Planning Organizations (RPOs), these many varied forms of haze and aerosol-related data are also becoming more readily accessible to analysts – for example through Internet-based data distribution and analysis systems like AIRNOW1, VIEWS (Visibility Information Exchange Web System)2 and FASTNET (Fast Aerosol Sensing Tools for Natural Event Tracking).3
In July, 2002, many of the above data and information exchange systems were available in near-real time and led to many quick but detailed assessments of the smoke plume(s) from a series of large, lightning-induced forest fires which ignited in central Quebec Province during the first week of July. See for example the various data, images, animations and analyses reports in the link to “0207 Quebec Smoke” in the FASTNET Events Catalog.4 Other data, such as from chemical analysis of filters have become available more slowly. Filter data from the EPA STN network and the IMPROVE network are especially useful for evaluating the chemical characteristics of the smoke, since the day of maximum 24-hour smoke impacts at most sites was July, 7th, 2002. This was a routine 1 in 3 day filter sample day for STN and IMPROVE sites, which are relatively densely configured in the MANE-VU region of maximum smoke impact. The location of the fires, as well as regions (north and) south of the fires along the transport route, are otherwise characterized by very low densities of anthropogenic or other natural emissions sources. July 7th was a Sunday, assuring day-of-week minima in local
emissions in the region of highest smoke impact. Thus the aerosol concentrations, compositions and optical effects during this event are largely due to pure wood smoke.
METHODS
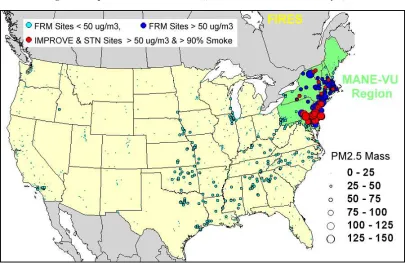
Aspects of the wood smoke’s chemical composition were explored with two approaches. Both began with extraction from VIEWS of all IMPROVE and STN data for the MANE-VU region for the summer (July and August) of 2002. In the first approach (“assumption of overwhelming smoke”), the data were rigorously screened to meet the following criteria: PM2.5 mass > 50 ug/m3, OC > 25 ug/m3, and sum of all “non-organic species” (estimated ammonium sulfate + ammonium nitrate + fine soil + EC + all other trace elements) equal to less than 10% of the mass. For screening purposes, missing nitrate at a few sites was estimated as the average of nearest sites and sulfur (x3) was substituted for missing sulfate (or vice versa). The objective was to identify sites with lots of smoke and almost nothing but smoke. The screening yielded data from 6 IMPROVE sites and 20 STN sites, all on the 7/7/02 sample day of maximum smoke impact. A seventh IMPROVE site, PMRF, VT, was also added after upward adjustment of the (flagged) 7/7/02 module A data to account for reduced flow observed for that sampler. The adjustment factor of 1.38 applied to all module A variables was based on the ratio of IMPROVE fine mass (45 µg/m3) to that from collocated FRM PM2.5 sampler (62 ug/m3). Following adjustment, a number of QA metrics, including S:SO4, OMH:OMC, OC:MF and K:OC which had initially been inconsistent were improved to their expected values. Locations and relative fine mass concentrations of the IMPROVE and STN sites that met this screening criteria are displayed in Figure 1, which also shows the national spatial pattern of 7/7/02 fine mass concentrations with FRM PM2.5 data. Here it can be noted that the influence of “overwhelming smoke” on 7/7/02 was clearly limited to the MANE-VU region (shaded light green), and reached highest ground level concentrations in eastern sections of the Mid-Atlantic states.
Chemical composition of the smoke was also estimated by a second approach (“regional receptor model”) in which all IMPROVE and STN data from all MANE-VU sites for July and August, 2002 were entered as independent observations in two runs (one for each network’s data) of the UNMIX receptor model (version 3.1 for MATLAB).5 Traditionally, this kind of receptor model is applied to large time series of multi-species data from an individual site, with the objective of identifying specific sources that impact that site. Similar mathematical approaches – for example “Empirical Orthogonal
Functions” – are also traditionally applied to multi-site data for individual species. In the current application, a relatively short time series of two months of data from multiple sites within a small region and intentionally including the large Quebec smoke event, was employed with the specific objective of identifying the chemical composition of that event, while also accounting for other regional-scale or more local source influences which may have been present during that time period. An identified wood smoke source and any other identified sources that result from this kind of regional application would need to meet the characteristics of having a fixed, unique chemical composition, and also having contributions in different samples that were uniquely different from other
identifiable sources, and would need to meet these criteria for multiple sites. Thus the source influences resulting from this approach must be regionally consistent.
IMPROVE and STN data were prepared for model input as follows. The Washington, DC IMPROVE site was excluded so that the IMPROVE model run would be exclusively for rural sites – in contrast with the urban STN sites. Observations for which fine mass, OC and/or both S and SO4 were missing were eliminated, after which all below-MDL and negative values were coded as “missing” along with other occasionally “true
missing” minor species. After these prepared data were initially entered into UNMIX, a limited number of model input values were initially selected, which included fine mass (for intended use as the “total” and “normalization” variable in the model runs); major mass-contributing species (S or SO4, NO3, OC, EC); potassium (anticipated to be a potential wood smoke tracer if the “crustal” K is accounted for in the model), crustal elements (Si, Al, Fe, Ca, Ti – to assure identification of a clear soil source, and thereby account for “crustal K”) and Sr (which is frequently below MDL but can be a good indicator of fireworks, which like wood smoke has a high K and OC content. Other trace elements, such as Na, Ni, V, Se, As, Pb, Zn, which might help identify “strongly flavored local” sources at a few sites, were intentionally not used as model input here, since the objective was to identify sources with common regional-scale influence.
Following the above-described data screening and hole-filling procedures, 358
observations from 18 sites were employed as final model input. For the STN model run, 667 observations (from an original
753) for 43 sites were employed as STN model input. The locations of the selected sites are displayed in Figure 2, in which the large symbols depict the geographical centroids of the two networks within the MANE-VU region. In addition to
differences in sampling and
analytical methods, and in local site characteristics between the (urban) STN and (rural) IMPROVE
networks, note that the spatial
distribution of MANE-VU STN sites is distinctly to the southwest of the IMPROVE sites in this region.
Figure 2. Locations of MANE-VU Region IMPROVE & STN Sites for multi-site Unmixruns.
For the final IMPROVE and STN model runs, fine mass was specified as the “total” and “normalization” variable (the model objective is to apportion the fine mass, and resulting source compositions and contributions will be in relation to fine mass concentrations). The above-indicated input species were used to drive the model, and all other species were subsequently apportioned among the sources using the UNMIX “fit remaining species” (MLR regression) option.
Optical characteristics (specifically light scattering) of the Quebec smoke were also explored using a variety of IMPROVE (Optec NGN2 and NGN3) nephelometer data, ASOS visibility observations (from Belfort forward scatter instruments), and various collocated or nearby PM2.5 speciation or continuous mass data. The details of methods employed are best described in association with specific results to follow, but in general: IMPROVE NGN2 nephelometer and PM2.5 speciation data for the LYBR, GRGU and ACAD sites were extracted from VIEWS2; data from an experimental operation of a (heated, 2.5 um cut) NGN3 nephelometer at ACAD were provided by Air Resource Specialists6; Continuous fine mass data were obtained from the states of VT, NY, CT, MA and ME; ASOS “bext” data were obtained from FASTNET3. These ASOS data were initially archived as hourly visual range averages, truncated at 10 miles or less and binned into 16 standard bins when visual range was less than 10 miles. Generally, the truncation was not a problem for the sites and hours of heavy smoke impact – where VR was
consistently below 10 miles. In the current FASTNET version of these data, a bext
RESULTS: Smoke Chemical Characteristics
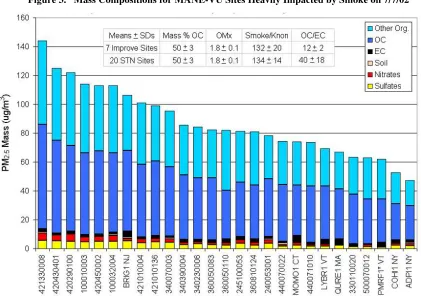
Fine Mass and species compositions for the (20) STN and (7) IMPROVE sites that met the “overwhelming smoke” screening criteria are displayed in Figure 3, which also includes several summary statistics for the selected sites for the two networks.
Figure 3. Mass Compositions for MANE-VU Sites Heavily Impacted by Smoke on 7/7/02
The IMPROVE sites are identified by name and State (i.e. BRIG1 NJ is Brigantine New Jersey), and the STN Sites are identified by AQS site code, for which the first 2 numbers are the state code (42=PA, 10=DE, 34=NY, 36=NY, 24=MD, 44=RI, 33 = NH and 50=VT). As indicated in Figure 1, the most heavily impacted sites lie in the southeast corner of the MANE-VU region and decrease toward the north, west and northeast.
is implied for both networks for this “event of opportunity”. Using this implied OMx of 1.8, the mass of smoke was estimated as EC + 1.8 OC, and this “smoke mass” was compared to “non-soil potassium”7 (KNON = K – 0.6 FE) to evaluate the consistency of KNON as a potential quantitative smoke tracer specifically for this event. For this specific fire and sample day, a fairly consistent smoke:KNON ratio of about 133:1 is obtained for both IMPROVE and STN sites, and may have some value for estimating smoke impacts (from this fire or “similar ones”) at less heavily impacted sites or dates.
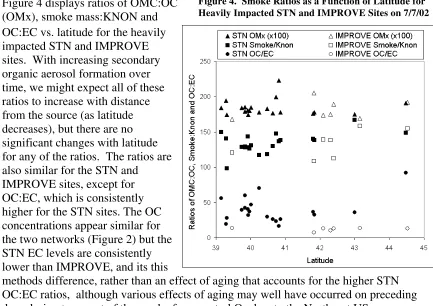
KNON has generally been used as a qualitative smoke tracer in past analyses, but it can and does vary among sites and fires, since K is emitted as a function of fuel K content and fuel consumed, while the carbonaceous matter from a given fire can vary according to the efficiency of combustion – and so the ratio can vary widely. It has also been suggested that the smoke: KNON ratio may deteriorate with age, as aerosol K from biomass may tend to form more slowly and have a smaller size distribution than organic aerosols.8 Conversely, it might also be expected that secondary organic aerosol formation would lead to increasing organic concentrations as the smoke ages – perhaps accounting for the higher concentrations at the more southerly sites in the region. This might also contribute to the higher OC:EC ratios observed at the STN sites which tend to be located further south than the IMPROVE sites (Figure 2), and if the aging results in increased formation of oxygenated organic compounds, the ratio of smoke organic matter to organic carbon (OMx) might also increase with age.
Figure 4 displays ratios of OMC:OC (OMx), smoke mass:KNON and OC:EC vs. latitude for the heavily impacted STN and IMPROVE sites. With increasing secondary organic aerosol formation over time, we might expect all of these ratios to increase with distance from the source (as latitude decreases), but there are no significant changes with latitude for any of the ratios. The ratios are also similar for the STN and IMPROVE sites, except for OC:EC, which is consistently higher for the STN sites. The OC concentrations appear similar for the two networks (Figure 2) but the STN EC levels are consistently lower than IMPROVE, and its this
methods difference, rather than an effect of aging that accounts for the higher STN OC:EC ratios, although various effects of aging may well have occurred on preceding days during transport of the smoke from central Quebec to the Northeast US.
In addition to summary statistics reported in Figure 3, several other metrics can be calculated from additional data available for the IMPROVE sites. The ratio of PM10 to PM2.5 averaged 1.0 + 0.1 indicating that all the smoke was fine, and also suggesting minimal impacts from local (coarse particle) sources on the day of highest smoke impact. The ratio of OMC:OMH was also 1.0 + 0.1, indicating that these separate estimates of organic matter were very consistent with each other (as they typically are in this region). It should be emphasized, however, that this consistency does not necessarily make these estimates correct. Both are based on common assumptions about the relative fractions of carbon and hydrogen in organic matter. OMC in this case was calculated with the
traditional 1.4 factor (OMC = 1.4 OC) and OMH was calculated as 13.75(H- S/4). If the correct OMx factor for this event (or other samples) is 1.8 rather than 1.4, the OMH calculation would need to be increased to (1.8/1.4 * 13.75 = ) 17.7(H-S/4) to balance.
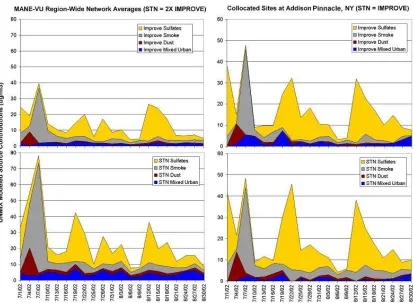
The multi-site UNMIX analysis, conducted as separate model runs for all STN sites and all IMPROVE sites in the MANE-VU region for the months of July and August, 2002 yielded 4-source solutions for each network run. Despite differences in the STN and IMPROVE measurement methods, the modeled “regional source influences” appear similar for the two networks. The sources are interpreted as representing “wood smoke”, “dust”, “regional sulfates” (primarily transported) and “mixed urban” (primarily local) source influences. Average regional time series are displayed in Figure 5, with single-site results from Addison Pinnacles, NY, where STN and IMPROVE are collocated.
It may be noted that on a regional network-wide basis, the average total source (and total fine mass) concentrations are twice as high for the urban STN network than for the rural IMPROVE sites. However, the modeled source impacts are quite similar for the
collocated site, indicating that the differences in regional network model results don’t appear to be driven by differences in the measurement methods for IMPROVE and STN.
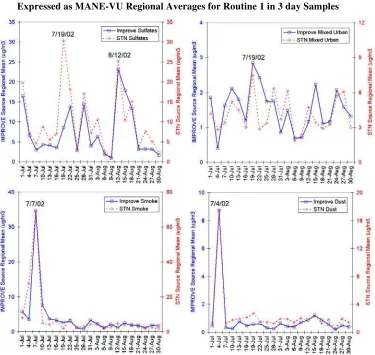
Additional details for the network average time series are displayed in Figure 6. Note that, for all sources except the regional sulfate, the STN and IMPROVE results “fitted” in magnitude, but are plotted on different Y-Scales. The largest difference in scales (STN = 3X IMPROVE) is for the “mixed urban” source, which is interpreted as resulting
primarily from local stagnation in the MANE-VU region. This difference seems logical given the predominantly urban nature of the STN sites.
Figure 6. Time Series of Regional STN and IMPROVE Sources for Summer, 2002 Expressed as MANE-VU Regional Averages for Routine 1 in 3 day Samples
For the Smoke source - clearly dominated by the 7/7/02 Quebec fire event, and for the dust source – also exhibiting an extreme regional spike on the preceding sample day of 7/4/02, the regional average impacts are twice as high for the urban STN sites. As will be demonstrated later, the 7/4/02 dust spike appears to be associated with a major Sahara dust transport event, which arrived in the MANE-VU region from the Midwest, where it exhibited even higher concentrations on the preceding sample day of 7/1/02. By
ground-level concentrations in the southern half of the MANE-VU domain, where there is a higher concentration of STN sites (Figure 2), and it is this general regional difference in network siting characteristics, rather than the urban/rural or measurement methods differences which account for the average network differences for the distant smoke and dust sources. It may also be noted that the sulfate source impacts, plotted on the same scale in Figure 6, track closely except for the 7/19/02 sulfate event which reached much higher concentrations in southern sections of MANE-VU, and was also a day of high impacts from local sources.
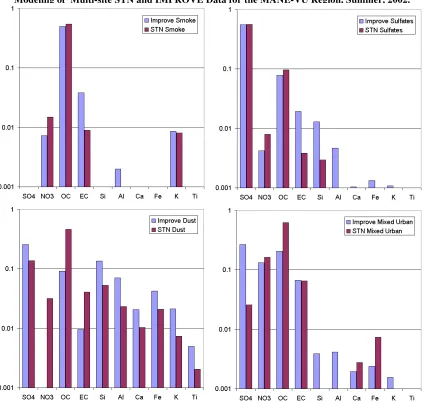
The modeled source compositions are presented in Figure 7, constrained in this case to species used as common input to the 2 model runs. It should be emphasized that “sources” resulting from the UNMIX model are un-named, and characterized only by their (unique, constant) chemical compositions and (unique, varying) contributions to each sample used as model input. Source interpretations (names) are dependent on the subjective judgment of the modelers. Also, in this case, the interpretation that these 2 sets
of sources – resulting from 2 independent model runs on data from 2 networks with different sites, site characteristics, sampling and analytical methods – have matching counterparts in the other model run is also a subjective judgment of the modelers.
As for the time series comparisons in Figure 6, the Figure 7 source compositions are similar for the independent STN and IMPROVE model runs. The extent to which differences may be related to the different network’s analytical methods or site
characteristics is unknown, but considering these network differences, the similar time series and compositions are encouraging. Fractional compositions for most species were generally more than 2 sigma of their uncertainties for most modeled sources, with the notable exception of the dust source – for which 2 sigma uncertainties for all species exceeded the fractional source compositions for both IMPROVE and STN model results. Both dust sources are substantially enriched in SO4 compared to “pure” crustal material,
and the STN dust is also heavily enriched in OC, NO3 and EC, compared to IMPROVE. Such enrichment might be due to influence from re-entrained urban road dust and/or reactions of urban gaseous pollutants on the surface of crustal particles. If the “urban excess” is subtracted from the STN dust profile, the proportionate mass fractions of the other species are quite similar to those for the IMPROVE dust source (Figure 8). For the Quebec fire-dominated wood smoke source, the STN source composition shows a
substantially lower EC fraction, consistent with the Figure 3 composition of heavily impacted sites on 7/7/02 and with the different definitions of EC in the IMPROVE and STN networks. The IMPROVE regional sulfate source also shows higher EC content than STN as well as higher (but trace) levels of several crustal elements. The STN mixed urban source has higher OC and lower SO4 than its IMPROVE counterpart. Both IMPROVE and
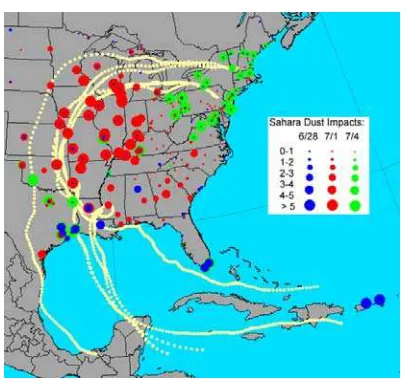
STN Dust sources have relatively high Al/Ca ratios (>3) and Al/Si ratios (>0.5), and as evident in the Figure 6 time series, both networks are impacted by a large, regional-scale dust event on 7/4/02, one sample day prior to the Quebec smoke. Figure 9 displays 10-day HY-SPLIT back trajectories starting from the centroids of MANE-VU STN and IMPROVE sites on 7/4/02. Also shown are the spatial patterns of fine soil from all eastern IMPROVE and STN sites on 6/28, 7/1 a 7/4/02. All of the above features are consi with a major intrusion of Sahara dust into the Northeast on 7/4/02, and the arduous transport route through the Eastern US may help explain the excess SO4 associated with the dust.
Figure 8. Dust Profiles with "urban excess" OC, EC and NO3 removed from STN Dust.
nd stent
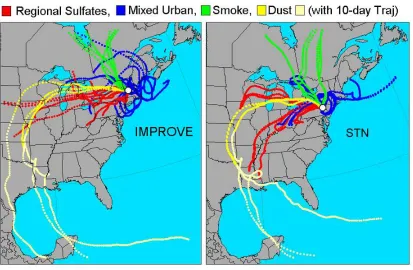
Figure 10. HY-SPLIT Back Trajectories on Days of Highest Proportionate Contributions for Modeled Unmix Sources at MANE-VU IMPROVE & STN sites during July & August, 2002.
Figure 10 displays HYSPLIT (version 4.7)9 backward air trajectories for the days of highest proportionate regional average contributions of the sources resulting from multi-site UNMIX runs on IMPROVE and STN data. The trajectories were driven by EDAS (ETA Data Assimilation System, 80 km grid) meteorological data10 and started at noon EST at heights of 250, 500 and 750 meters AGL from the centroids of the IMPROVE and STN sites in the MANE-VU region (see Figure 2). They were run for 72 hours backward, with the exception of the 7/4/02 dust day, where they were extended back 10 days. It should be noted that these dust day calculations were truncated at a duration of about 8 days due to exceedance of the southern or eastern limits of the ETA meteorological domain. The 3-day trajectories for the dates of highest proportionate wood smoke (7/7 and 7/10 for IMPROVE and 7/7 and 8/9 for STN) were also truncated at about 2 days, due to exceedance of the northern edge of ETA domain. As these smoke trajectories appear to terminate near (or just beyond the origin of the Quebec fires, just east of James Bay, a transport time of 2 days (or less) is implied for the smoke, which originated about 500 miles north of the northern edge of the MANE-VU domain and nearly 1000 miles from the southern edge of the MANE-VU domain where maximum smoke impacts were observed. The trajectories for the regional sulfate source and the “mixed urban” source are consistent with the interpretations that these sources tend to be associated with regional transport and local stagnation, respectively.
impact. On average, the smoke source accounted for 88% of the modeled fine mass on 7/7/02 across the regional STN and IMPROVE sites, with smoke percentages ranging from less than 50% to more than 95% at some individual sites on 7/7/02. Including the less heavily impacted sites and dates and accounting for other source influences provides an independent means of estimating the smoke composition, for comparison with the estimate derived by screening the sites to identify “overwhelming smoke” impacts.
Figure 11 compares the TOR thermal carbon fraction composition (as percent of total carbon) for the smoke fingerprint derived from the 7 IMPROVE “overwhelming smoke” sites on 7/7/02 with the IMPROVE smoke composition derived from the 2-month, multi-site UNMIX
approach. These fingerprints, which agree closely with each other are a compared to their counterparts derived for the MANE-VU region for summer 2002 and to the 3-year 2001-03 MANE-VU IMPROVE regional average (excluding the Quebec smoke impact days).
Compared to these regional averages (which presumably also include influence from other forest fires or residential wood combustion), the Quebec smoke has substantially lower fractions of EC1, EC2, EC3 and OC4, with higher fractions of OC2 and OC3. OC1 and OP fractions for the smoke are similar to the 2002 summer average but higher than the 3-year annual mean percentages. The consistency between the UNMIX and overwhelming smoke estimates adds some confidence to both estimates, while the differences from other averaging times emphasizes the potential value of the TOR
thermal fractions for other receptor modeling applications for sites with mixtures or wood smoke and other carbonaceous source impacts.
Figure 11. TOR Carbon Fractions for Heavily Smoke -Impacted IMPROVE sites on 7/7/02 vs. Smoke from Regional UNMIX and for Other Averaging Times.
lso
A more detailed profile of the UNMIX smoke composition, including species not used as model input but subsequently apportioned by regression (UNMIX “Fit Remaining
All three estimated wood smoke compositions are strikingly similar, especially
considering the recent PMF analysis was based on 3 years of data for the PMRF, VT site, but specifically excluded the 7/7/02 sample date as it was observed to represent an
“extreme anomaly” which adversely affected the preliminary PMF results. The Regional UNMIX included that 7/7/02 PMRF VT sample as input, but only as one of 358
observations from other dates and sites in the region.
Figure 12. Wood Smoke Compositions from PMF Modeling of 2000-2003 IMPROVE Data from PMRF, VT (Gao et al., 2004, which excluded 7/7/02), PMRF, VT composition on 7/7/02, and Smoke
Composition from Regional UNMIX Modeling of Summer 02 MANE-VU Region IMPROVE Data.
The similar potassium content of the multi-site UNMIX and single-site PMF smoke sources (which is similar to KNON, since the Fe content of these sources is more than 20 times lower than K) compares well with the smoke mass:KNON ratio of 132 + 20 to1 for the previously reported estimates based on the assumption of overwhelming smoke at selected IMPROVE sites (Figure 3). It may be noted that this ratio is approximately double that for previous PMF12 and UNMIX13 wood smoke sources (about 60:1) modeled from 1989-95 IMPROVE measurements at the PMRF site. Unlike the recent Gao et al. (2004) results, those earlier smoke sources showed strong winter maxima from local residential wood burning and sugaring operations, which may have accounted for the lower ratios. The UNMIX IMPROVE wood smoke source has a Smoke:K(non) ratio of 131, an OC Mass fraction of 52%, an implied organic matter conversion factor of OMC = 1.8 OC (to account for the modeled smoke mass) and OC:EC ratio of 13:1 - all of which are consistent with the composition estimates for the smoke-dominated IMPROVE sites summarized in Figure 3. The UNMIX STN source had a Smoke:K(non) ratio of 124 (or 127 if K+ ion is used in place of KNON), an OC Mass fraction of 49 %, an implied organic matter conversion factor of OMC = 1.8 OC , and an OC:EC ratio of 55:1. These values are also consistent with the smoke composition estimates for the smoke-dominated STN sites summarized in Figure 3, with the exception that the modeled STN OC:EC ratio of 55 is higher than the Figure 3 STN ratio of 40 + 18, although it is within the
RESULTS: Smoke Optical Characteristics
IMPROVE Optec NGN2 ambient nephelometer data (bsp) are available for three smoke-impacted sites in the Northeast during early July 2002. As indicated in Figure 13 (hours with RH > 95% removed), impacts occurred first at the most southerly and westerly Lye Brook, VT site and last (and least) at the most northerly and easterly Acadia, ME site. Only Lye Brook saw large impacts on the 7/7/02 routine IMPROVE filter day, Gt. Gulf, NH and Acadia were impacted early and late on 7/8/02 respectively, and all 3 sites show a final, smaller impact late on 7/9 and early on 7/10, with the Acadia impact primarily on the 7/10 routine filter sample day. The Acadia data are especially informative, due to the temporary deployment of a collocated Optec NGN3 nephelometer (with heated 2.5 um inlet) by Air Resource Specialists6. Figure 14 compares the Acadia NGN2 and NGN3 data for the first 15 days of July 2002, with the 7/8 and 7/10 days of smoke impact identified separately. Relative humidity ranged from 55% to 85% on 7/8 and from 36% to 91% on 7/10, but the relatively high smoke impacts on these days clearly exhibit no enhanced effects from humidity. Acadia 24-hour filter-based fine mass concentration on 7/10 was 21 ug/m3, of which 46% was OC, 14% was non-carbonaceous and, as for the much more heavily impacted sites on 7/7/02, a factor of 1.8 x OC is needed to account for the measured mass. Since the 7/10 Acadia smoke is clearly not hygroscopic, the best estimate of its scattering efficiency can be estimated from the NGN3 data, since there is no need to consider the complex effects of coarse particles or the unknown timing of the day’s sulfate and nitrate with respect to RH. Reconstructed dry fine particle scattering (in Mm-1) can be calculated as bsfpd (from NGN3) = 10 (Rayleigh) + 3 x (ammonium sulfate + ammonium nitrate) + 1 x (fine soil) + S:MO x (1.8 OC). Solving for S:MO (scattering to mass ratio for organic matter) yields a scattering to mass ratio of 4 m2/g for organic matter. This would increase to 5 m2/g if the traditional OMC factor of 1.4 OC were employed, although 1.8 seems more consistent with the data.
Figure 13. Nephelometer Bsp at 3
Smoke-impacted Northeastern IMPROVE Sites
Figure 15 shows additional details of the data from Acadia and near-by sites, including ASOS visibility data (forward scatter meter) from the Bar Harbor airport (about 6 miles NE of the IMPROVE site) and continuous PM 2.5 mass data (TEOM) from Bangor Maine (about 40 miles to the NW). The ASOS scattering data are initially recorded as 1-minute averages, and subsequently averaged to 1 hour and converted to visual range (VR). For archival, they are subsequently truncated at VR = 10 miles with lower visibilities binned into progressively smaller categories (<0.25, 0.25, 0.5, 0.75, 1, 1.25, 1.5, 1.75, 2, 2.5, 3, 4, 5, 6, 7, 8, 9 and 10+ miles). The NWS conversion factor from measured bscat to VR is unknown (to us; find out!), but comparing the Acadia nephelometer and nearby Bar Harbor ASOS data, a Koschmeider (K) constant of 3.9 (where VR = K/bext, where bext is in Km-1, or 3900/ bext, if bext is in Mm-1) seems to best fit the ASOS VR to the IMPROVE nephelometer data. Effects of ASOS 10-mile data truncation are clearly evident during the cleaner hours, but during periods of moderate to high smoke impacts, they agree closely with the NGN2 (and NGN3) nephelometer data.
he more distant Bangor TEOM data (left-hand scale) track the bscat data well on 7/10, ut are offset in time on the 7/8 period of larger impact. The ratio of the scales employed ere is bscat = 5 x PM2.5 (an implied scattering to mass ratio of 5 m2/g). On less heavily
pacted 7/10, the peak PM2.5 exceeds the bscat implying a lower scattering efficiency of 2
/g, but for hours of maximum smoke impact on 7/8, maximum bscat equals or exceeds e peak PM2.5 suggesting a scattering efficiency of 5 m2/g or higher, with higher smoke oncentrations.
t the Lye Brook IMPROVE site, where maximum smoke impacts were centered on the /7/02 routine aerosol sampling day, bsp averaged 563 Mm-1 and PM2.5 mass was 69
Figure 15. Acadia Nephelometer and nearby ASOS visibility and PM2.5 Data.
T b h im 4 m
h t c
ug/m3, of which the presumed hygroscopic species accounted for only 3 ug/m3. Even if it assumed that all the sulfate and nitrate occurred during the first, most humid hours of
e day and therefore account for the highest possible fraction of the scattering, a
attering to mass ratio for organic matter (as 1.8 x OC) is slightly above 7 m2/g – which ems near or above the theoretical maximum. Comparing the Lye Brook bscat data with earby ASOS data from North Adams, MA, Albany, NY and Glens Falls, NY indicate
at the Lye Brook nephelometer data are consistent with nearby sites, and unless there ere unknown errors in the aerosol data, there is no way to account for the “unreasonably igh” extinction efficiency by measurement error.
PM2. st of
ass) tracked the TEOM fairly closely, but during the smoke event its estimated mass concentration exceeded the TEOM by a factor of 2. It was run in this case without an internal “adjustment factor”, in which case a dry scattering:mass ratio of about 3 m2/g is implied. The doubling of estimated fine mass during the smoke impact, suggests a doubling of the scattering efficiency or about 6 m2/g. A similar efficiency is also implied if it is assumed that the peak Rutland TEOM PM2.5 mass concentrations were similar to what was observed in Lye Brook a few hours offset in time.
Figure 17 compares ASOS bscat data from Boston, MA, Hartford, CT, New Haven, CT and White Plains NY with continuous PM2.5 mass data from nearby sites in these cities. The 2 independent measurements agree remarkably well during the period of peak smoke impact, when the ASOS 10-mile data truncation is not a problem, and strongly highlight the potential value of this dense ASOS network for future analyses. If the raw ASOS
is
scat itted to the PM2.5 mass, is sistently 6:1 in all cases, for an implied scattering to mass ratio of 6m2/g.
is
Figure 16 compares hourly Lye Brook Nephelometer data (hours > 95% RH removed) with continuous PM2.5 mass measurements from nearby Rutland, VT – about 35 miles NW. At that time, VT DEC was testing a Mie Data Ram (nephelometer) configured as a
the su
estimated fine m
data (prior to truncation, binning and averaging) could be made routinely available, th value would be greatly extended for analysis of events of less overwhelming magnitude.
e that the ratio of the scales, by which the b data are f
Figure 16. Lye Brook Bsp with Continuous Fine Mass Data from nearby Rutland, VT
5 mass monitor in Rutland, collocated with a 30 degree C TEOM. During mo mmer of 2002, the Data Ram (which internally converts light scattering to
Figure 17. ASOS bscat vs. nearby PM2.5 in selected Northeastern Cities, July 6-9, 2002.
These very high implied scattering efficiencies are unusual, but are consistent with the relatively large particle size distributions of this smoke as reported by Taubman et al. (2004)
and 100 Mm-1 respectively and the estimated single scattering albedo was 0.93. They noted with an optical particle counter (Met One Model 9012) that there were as many particles (by number) in the range of 0.40 to 0.491 nm as there were in their (smallest) 0.3 to 0.40 nm size bin, and at several of their flight locations, there were as many particles in the 0.491 to 0.60 nm size range as there were in their smallest bin. Beneath the smoke plume, in a more typical anthropogenic plume, the smaller 0.3 to 0.4 um particles were much more numerous than the larger ones.14 The extremely high scattering efficiency implied by the various surface measurements reported here would require a tight particle size
distribution centered near the most optically efficient 0.5 um size. With an OMC factor of 1.8, smoke scattering of 6 m2/g and EC absorption of 10 m2/g, the single scattering
albedo (scattering / [scattering + absorption]) for the heavily-smoke-impacted IMPROVE sites would be the same 0.93 (for 550nm) observed in the more sophisticated aircraft observations reported by Taubman et al. (2004).14
14
CON
The unusually large im
US provided a unique “event of opportunity” for exploration of the chemical and physical properties of nearly pure wood smoke at a large number of routine monitoring sites. The smoke event was preceded and followed by other large regional-scale impacts from local sources, mid-range sulfate transport, and very distant transport of a major Sahara Dust event. During the smoke event, most measurements from the STN and IMPROVE networks appeared to be quite comparable, with the notable exception of EC. The organic mass to OC ratio was consistently 1.8 throughout the impacted region. Non-soil K appeared to be a relatively stable tracer for this specific event, with a smoke:KNON ratio of about 130:1. The smoke scattering efficiency appeared to increase with smoke concentration from 4 m2/g at low concentrations to 6 m2/g at heavily impacted sites. EPA reconstructed extinction formulae would understate the smoke impacts by a factor of 2.
REFERENCES
1. Air Quality Index (AQI) – AIRNow, http://www.epa.gov/airnow/
CLUSIONS
pacts from the July 2002 Quebec forest fires in the Northeastern
2. Visibility Information Exchange Web System, http://vista.cira.colostate.edu/views/
3. Fast Aerosol Sensing Tools for Natural Event Tracking,
http://webapps.datafed.net/dvoy_services/dvoy_book.aspx?path=HOME/Projects/FASTNET
4. FASTNET Event Catalog, See event link to “0207 Quebec Smoke” under;
http://capita.wustl.edu/fastnet/Events/FASTNETEvents.htm .
5. Henry, R. C. (2004) UNMIX 3.1 for MATLAB, February, 2004.
6. Adlhoch, J. P. (2002) Pers. Com. (transmittal of July, 2002 Acadia NGN3 data).
7. Cahill T.A., Eldred R.A. and Feeney P.A. (1986) Particulate monitoring and data analysis for the National Park Service 1982-1985," U. of California, Davis, CA.
8. Sisler, J.F., D. Huffman, D. A. Latimer,W. C. Malm and M. L. Pitchford (1993) Spatial and Temporal Patterns and the Chemical Composition of the Haze in the United States: An Analysis of Data from the IMPROVE Network, 1988-1991, IMPROVE Report 1. 9. Draxler, R.R. and Rolph, G.D. (2003) HYSPLIT (HYbrid Single-Particle Lagrangian
Integrated Trajectory) NOAA Air Resources Laboratory, Silver Spring, MD.
10. Rolph, G.D.(2003) Real-time Environmental Applications and Display sYstem (READY) Website (http://www.arl.noaa.gov/ready/hysplit4.html). NOAA Air Resources Laboratory, Silver Spring, MD.
11. Gao, N., K. Krumhansl, K. Lafferty, E. Kim, P.K. Hopke, R..Poirot, "Sources of Fine Particulate Species in Ambient Air over Lake Champlain Basin, Vermont," This Conference. 12. Polissar, A.V., P.K. Hopke, and R.L. Poirot (2001). Atmospheric aerosol over Vermont:
chemical composition and sources, Environ. Sci. Technol., 35: 4604-4621.
13. Poirot,R.L., P.R. Wishinski, P.K. Hopke and A.V. Polissar (2001) Comparative application of multiple receptor methods to identify aerosol sources in northern Vermont, Environ. Sci.
Technol. 35: 4622-4636.
14. Taubman, B.F., L.T. Marfu, B.L. Vant-Hull, C.A. Piety, B.G. Doddridge, R.R. Dickerson, and Z. Li (2004) Smoke over haze: Aircraft observations of chemical and optical properties and the effects on heating rates and stability, JGR Vol 109, D02206,
doi:10.1029/2003JD003898.
AKNOWLEDEMENTS
The authors thank Alan Leston, CT DEP, Tom Downs, ME DEP, Dirk Felton, NY DEP, Peter Babich, VT DEC and George Allen, NESCAUM for providing continuous PM 5