See discussions, stats, and author profiles for this publication at: https://www.researchgate.net/publication/233390671
Use of Multi-temporal Satellite Data for
Land-use/Land-cover Change Analyses and its
Impacts on Soil Properties in the...
Conference Paper · May 2010
CITATIONS
3
READS
34
4 authors:
Some of the authors of this publication are also working on these related projects:
Identification of rocks and their quartz content in Gua Musang gold field using Advanced Space-borne Thermal Emission and Reflection Radiometer (ASTER) imageryView project
Development of glacio-hydrological model for application in glaciated catchments in the Himalaya
View project Khalid Biro
6PUBLICATIONS 94CITATIONS SEE PROFILE
Biswajeet Pradhan
Universiti Putra Malaysia
406PUBLICATIONS 8,259CITATIONS SEE PROFILE
Manfred Buchroithner
Technische Universität Dresden 691PUBLICATIONS 2,382CITATIONS
SEE PROFILE
Franz Makeschin
Technische Universität Dresden 126PUBLICATIONS 2,774CITATIONS
SEE PROFILE
All content following this page was uploaded by Biswajeet Pradhan on 17 December 2016.
Use of Multi-temporal Satellite Data for
Land-Use/Land-Cover Change Analyses and its Impacts on Soil Properties
in the Northern Part of Gadarif Region, Sudan
Khalid BIROa,1, Biswajeet PRADHANa, Manfred BUCHROITHNERa,
and Franz MAKESCHINb
a
Institute for Cartography, Dresden University of Technology, 01062 Dresden, Germany
b
Institute of Soil Science and Site Ecology, Dresden University of Technology, 01062 Dresden, Germany
Abstract. Several decades of intensive dryland farming took place in the Gadarif Region, located
in the East part of Sudan. Rapid land-use/land-cover (LULC) changes occurred within this region, mainly due to agricultural expansion, government policies and environmental calamities such as drought. In this paper, an attempt has been made to analyse and monitor the LULC changes using multi-temporal Landsat data of the years 1979, 1989 and 1999 and ASTER data of the year 2009. In addition, efforts were made to discuss the impacts of LULC changes on selected soil properties. For this, a post-classification comparison technique was used to detect LULC changes from the satellite images. Three main LULC types were selected to investigate the properties of soil namely: cultivated land, fallow land and woodland. Moreover, soil samples were collected from ten sample plots for each LULC type at two depths of surface soil. For these soil samples, various soil properties such as texture, bulk density, organic matter, pH, electrical conductivity (EC), so-dium adsorption ratio (SAR), phosphorous and potassium were analysed. The results show that there is a significant and extensive change of LULC patterns which occurred in the last three dec-ades in the studied area. Further, laboratory tests revealed that soil properties were significantly af-fected by the LULC changes. It was observed that in the cultivated land bulk density increased, whereas organic matter decreased in the cultivated land as compared to the woodland and fallow land. The values of the physical and chemical soil properties of soil were found to be lower in the cultivated land as compared to the woodland and the fallow land. The change of the physical and chemical properties of the soil may be attributed to the changes in the LULC contributing to land degradation, which in turn leads to a decline in soil productivity. Consequently, dryland-farming systems within the study area need to be improved by developing sustainable land use practices in order to reduce the rate of soil degradation in the future.
Keywords. Land use/land cover, change detection, remote sensing, Gadarif Region, Sudan
Introduction
Land degradation is a global problem associated with desertification, loss of biological diversity and deforestation in drylands, which covers some 47 % of the globe’s surface. As a consequence, Africa accounts for 65 % of the total extensive cropland degradation of the world. LULC change consti-tutes a major part of the land degradation and also a main cause of global environmental changes [1-4]. Many studies have been showing that land use change and conversion can lead to deteriora-tion in the physical and chemical properties of soils and degradadeteriora-tion of a land [5-7].
The large modern mechanized rainfed agriculture sector has developed since 1944/45 in the Gadarif Region, when the government projected to cultivate the cracking clays of Central Sudan, in order to meet the food needs of army units stationed in the British colonies in East Africa. During 1960ies the
1
Khalid BIRO, et al.: Use of Multi-temporal Satellite Data for Land-Use/Land-Cover Change Analyses
private sector was involved to invest in this sector, which resulted to massive vegetation cutting. There-fore, fallow lands occurred every four years, while the investors started continuously clearing new areas. By the end of 1970ies and in the early 1980ies most of the land was used for mechanised farming [8]. This situation, coupled with mono cropping of sorghum, lack of crop rotation and inappropriate meth-ods of soil preparation and management resulted in severe land degradation problems. Rapid physical, chemical and biological deterioration of the soil and subsequent declines in agricultural productivity and deterioration of the environment took place within the region [9]. This paper describes the LULC changes in the northern part of the Gadarif Region during the period 1979 – 2009.
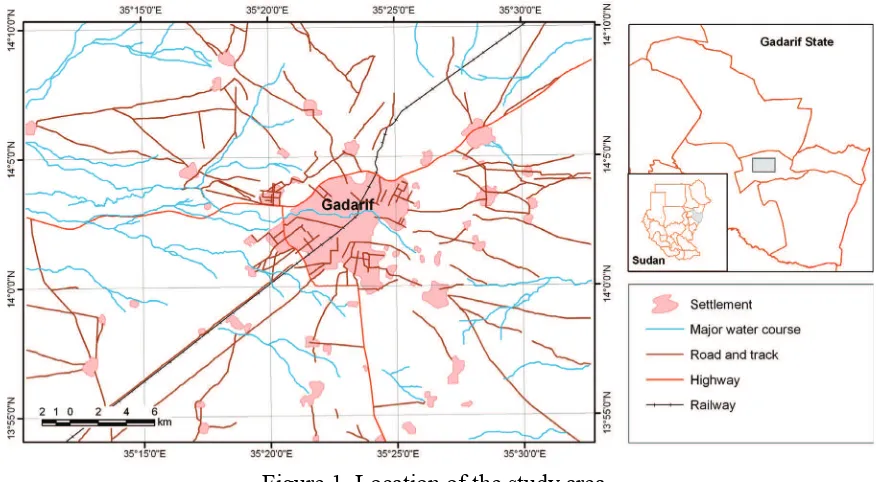
The Gadarif State is located in the eastern Sudan between 12º and 13ºN and 33º and 37ºE. Its average altitude is 600 m a.s.l. (Figure 1). The region is characterized by semi-arid climatic condi-tions where rainfall is erratic and concentrated in only few months of the year, mainly from June to October. The annual rainfall in the northern part is less than 500 mm. Temperature ranged from a mean minimum of 22ºC in winter to a mean maximum of 37ºC in summer, while in the hottest April or May it may reach 40-42ºC [10]. Soils are heavy dark cracking clays; the clay content is very high and generally amounts to 70 to 80%. Organic matter and nitrogen contents of the soil are low, but as there is no deficiency of other plant nutrients: the soils are moderately fertile.
Figure 1. Location of the study area.
1. Data and methodology
1.1. Remote sensing data and image processing
Multi-temporal Landsat data of the years 1979, 1989 and 1999 and ASTER data for the year 2009 with a path/row of 171/50 (Table 1) were used in this study. ASTER data was ordered in level 1B quality, which is radiometrically and geometrically corrected [11]. The images were selected in the same season to minimize the influence of seasonal variations on the result. Ancillary data on the dif-ferent land use/land cover features and their location points were recorded using a GPS instrument.
Table 1. Remote sensing data used in this study
Satellite Acquisition date Spectral resolution Ground resolution
Landsat-3 MSS 05.Nov. 1979 1 – 4 bands 57 m
Landsat-5 TM 16.Dec. 1989 1 – 7 bands 30 m
Landsat-7 ETM+ 21.Nov. 1999 1 – 8 bands 30 m
ASTER 17.Jan. 2009 1 – 3 bands 15 m
The Landsat MSS, TM and ETM+ were geo-referenced to the ASTER image of 2009 using ap-proximately 20 – 30 well-distributed GCPs. Second-order polynomial equations were used, and, like for the MSS image, maximum RMS error was 0.7 pixels. Using the nearest neighbour method the images were resampled to a pixel size of 30 m × 30 m. Atmospheric correction was not applied in this study, because the post-classification comparison approach adopted for LULC change analy-sis compensates for variation in atmosphere conditions and vegetation phenology between dates since each LULC classification is independently mapped [12,13].
1.2.Classification scheme and land use/cover classes
A classification scheme (Table 2), based on the land cover and land use classification system devel-oped by Anderson et al. (1976) was adopted [14]. Training areas were selected based on image in-terpretation and extensive field survey. Supervised classification using maximum likelihood classi-fication (MLC) was employed to classify the individual images independently [15].
1.3.Classification accuracy assessment
Accuracy assessment determines the quality of the information derived from remotely sensed data. It is most reliable when using reference data collected on the ground or from aerial photographs at or near the time of satellite overpasses [16]; however, in the African countries, such data is rarely available for retrospective remote sensing data analyses [17]. In this study the accuracy of the 1979, 1989 and 1999 classified images was assessed by visual interpretation of the unclassified satellite images [18]. In the present study a total of 300, 352, 347 and 360 pixels were selected for the LULC maps of 1979, 1989, 1999 and 2009 respectively. Error matrices as cross-tabulations of the classi-fied data vs. the reference data were used to assess the classification accuracy. Overall accuracy, user’s and producer’s accuracies, and the Kappa statistic were then derived from the error matrices. A multi-date post-classification comparison (PCC) change detection algorithm was used to deter-mine the LULC changes in four intervals: 1979–1989, 1989–1999, 1999–2009, and 1979–2009. It is the most commonly used method for LULC change detection [19,20].
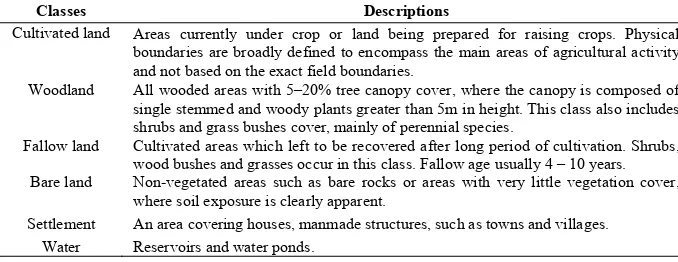
Table 2. Description of the land use/cover classes identified in the study area
Classes Descriptions
Cultivated land Areas currently under crop or land being prepared for raising crops. Physical boundaries are broadly defined to encompass the main areas of agricultural activity and not based on the exact field boundaries.
Woodland All wooded areas with 5–20% tree canopy cover, where the canopy is composed of single stemmed and woody plants greater than 5m in height. This class also includes shrubs and grass bushes cover, mainly of perennial species.
Fallow land Cultivated areas which left to be recovered after long period of cultivation. Shrubs, wood bushes and grasses occur in this class. Fallow age usually 4 – 10 years. Bare land Non-vegetated areas such as bare rocks or areas with very little vegetation cover,
where soil exposure is clearly apparent.
Settlement An area covering houses, manmade structures, such as towns and villages. Water Reservoirs and water ponds.
1.4.Soil sampling and analysis
Soil samples were collected from three LULC types: cultivated land, fallow land and woodland. The soil was sampled at two different depths: 0-5 cm and 5-15 cm from 10 sample plots for each LULC type. A bulk soil sample from each plot was collected, air-dried and passed through a 2 mm sieve.
Khalid BIRO, et al.: Use of Multi-temporal Satellite Data for Land-Use/Land-Cover Change Analyses
method [21]. Available Phosphorus (P) was determined using the Olsen sodium bicarbonate extrac-tion [22], while ammonium acetate was used to extract and determine available potassium (K) in the soil [23]. Electrical conductivity (EC) was determined in (1:5) soil:water suspensions [24].
2. Results and discussion
2.1.Classification accuracy assessment and LULC mapping
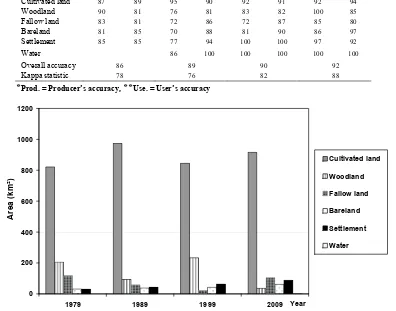
An overall LULC classification accuracy level for the four images varies ranging from 86 to 92%, with Kappa indexes of agreement ranging from 76 to 88% (Table 3). The image-processing ap-proach was judged to have been effective in producing compatible LULC data over time, irrespec-tive of the differences in spatial, spectral and radiometric resolution of the satellite data.
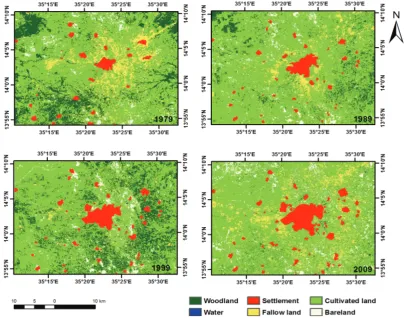
According to (Figure 2) cultivated land, woodland and fallow land were the dominate LULC classes for the maps of 1979 and 1989. The map of 2009 illustrates that the predominant LULC classes were cultivated land, fallow land and settlement. However, significant spatial expansion in cultivated land and the large decrease in woodland were observed in the 1989 LULC map. The area of cultivated land increased to 80.47%, while woodland area was reduced to 7.78%. A slight in-crease of 6.87% in the spatial extent of settlement and bareland was also observed. Spatial analysis of the 1999 LULC map reveals increases in woodland and settlement areas, which occupied 19.33 and 5.31% respectively, while the cultivated area decreased to 69.87%. Nevertheless considerable spatial expansion in cultivated land and the rapid decrease in woodland were observed in the 2009 LULC map. General patterns of LULC identified in all four images were largely dominated by cul-tivated land, woodland and fallow land areas (Figure 3). A significant increase of the culcul-tivated land indicates that deforestation, due to the expansion of the mechanized rain-fed agriculture, has been a continuing trend in the study area.
Figure 2. Land use/land cover map for the year 1979, 1989, 1999 and 2009.
Table 3. Summary of classification accuracies (%) for 1979, 1989, 1999, and 2009
Overall accuracy 86 89 90 92
Kappa statistic 78 76 82 88
٭Prod. = Producer’s accuracy,٭٭Use. = User’s accuracy
Figure 3. Areas of LULC classes in the study area
2.2.Impacts of LULC change on soil properties
2.2.1.2.2.1 Soil texture and bulk density
Within the different LULC types, clay content in the surface layers (0-5 and 5-15 cm) varied from 58.73 to 64.89%, while silt fractions ranged from 26.92 to 36.99% (Table 4). Clay content were higher in the cultivated land and fallow land compared to woodland at the layer 0-5 cm, however there was no significant difference (p > 0.05) between the three LULC types at the depth of 5-15 cm. Table 4 show that sand and silt fractions differed significantly across LULC types. There was a sig-nificant difference (p > 0.05) for bulk density values between the three LULC types (Table 4).
Table 4. Soil particle size distribution and soil Bulk density (BD) of the main LULC types (mean values, n = 10, SE in
parenthesis, different letters within one row indicate significant difference at P < 0.05)
Soil Properties Depth (cm) Cultivated Land Fallow Land Woodland
Khalid BIRO, et al.: Use of Multi-temporal Satellite Data for Land-Use/Land-Cover Change Analyses
310
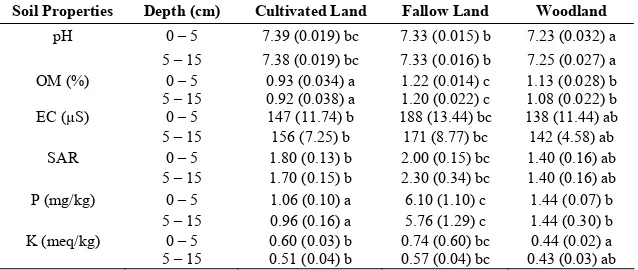
2.2.2.Soil pH and organic matter (OM)
Soil pH value was slightly higher for the cultivated land compared to the woodland. This is attrib-uted to the reduction of organic matter and the ploughing processes of cultivated fields. A trend of increased organic matter content for the fallow land and woodland was observed in the both depths of soil. Obviously, the conversion of woodland into the cultivated land has led to a drop in soil or-ganic matter contents.
2.2.3.Electrical conductivity (EC) and sodium adsorption ratio (SAR)
EC values in the soils of fallow land were found to be significantly different (p < 0.05) from the soils of cultivated land and woodland (Table 5). Also, the Statistics given in Table 5 indicated that LULC types differed significantly regarding the SAR of soils. The high values of EC and SAR in the fallow land compared to the cultivated land and woodland is attributed to the leaching of soil bases and subsequent reduction in soil carbonate. Sodium is well known as a dispersing agent in soils. Thus, alkaline conditions and the presence of sodium contribute to the degradation of vertisols.
2.2.4.Available phosphorus and exchangeable potassium
The data in (Table 5) reveals that, the available phosphorus was higher in the fallow land than that for the cultivated land and woodland. High phosphorus content in fallow land can be attributed to fewer uptakes by the grasses and shrubs, which usually dominated in fallow areas. However, the low phosphorus contents under woodland systems with a relatively high-tree density could be at-tributed to high plant uptake and possibly to higher sequestrations of phosphorus in tree biomass, because of the comparatively larger number of trees per unit area and massive root network in these systems. The exchangeable potassium content decreased with the soil depth for all LULC types (Ta-ble 5). Soil potassium was significantly different (p < 0.05) across the three LULC classes. The higher amount of potassium in the first layer is attributed to the increases of potassium fixation with the increasing soil pH. Also, potassium still exists in soil, although organic matter decreases with erosion.
Table 5. Selected soil chemical properties of the main LULC types (mean values, n = 10, SE in parenthesis, different
letters within one row indicate significant difference at P < 0.05)
Soil Properties Depth (cm) Cultivated Land Fallow Land Woodland
pH 0 – 5 7.39 (0.019) bc 7.33 (0.015) b 7.23 (0.032) a
References
[1] E. F.Lambin, H. Geist, Land-use and land-cover change-local processes and global impacts. Springer, Germany, (2006), 71-113
[2] L. M. Kiage, K.-B. Liu, N. D. Walker, N. Lam, O. K. Huh, Recent land-cover/use change associated with land deg-radation in the Lake Baringo catchment, Kenya, East Africa: evidence from Landsat TM and ETM+. International Journal of Remote Sensing, 28 (2007), 4285 – 4309
[3] E. N. Mwavu, E.T.F. Witkowski, Land-use and cover changes (1988 – 2002) around Budongo forest reserve, NW Uganda: Implications for forest and woodland sustainability. Land Degradation and Development, 19 (2008), 606– 622
[4] I. Onur, D. Maktav, M. Sari, N.K. Sönmez, Change detection of land cover and land use using remote sensing and GIS: a case study in Kemer, Turkey. International Journal of Remote Sensing, 30 (2009) 1749–1757
[5] A. K. Braimoh, P.L.G. Vlek, The impact of land-cover change on soil properties in northern Ghana. Land Degrada-tion and Development, 15 (2004), 65–74
[6] S. Khresat, J. Al-Bakri, R. Al-Tahhan, Impacts of land use/cover change on soil properties in the Mediterranean Region of Northwestern Jordan. Land Degradation and Development, 19 (2008), 397–407
[7] C. Gol, The effects of land use change on soil properties and organic carbon at Dagdami river catchment in Turkey. Journal of Environmental Biology, 30(2009), 825-830
[8] M. G. Craig, The Agriculture of the Sudan. Centre for Agriculture strategy, University of Reading. Oxford Univer-sity press (1991)
[9] SKAP (Southern Kassala Agriculture Development Project), Land use Survey and land use plan studies. Interim Report (1991)
[10] M. A. Hamdoun, A. O. Ageeb, I. M. Dawelbeit, Review on applied research Simsim dry land farming. CRC press, BocaBoton London, New York, Washington, D.C. (1991)
[11] M. Abrams, H. Simon, Bhaskar Ramachandran. Aster User Handbook, V2: Advanced Spaceborne Thermal Emis-sion and Reflection Radiometer, Jet PropulEmis-sion Laboratory. (2002)
[12] P. Coppin, I. Jonckheere, K. Nackaerts, B. Muys, E. Lambin, Digital change detection methods in ecosystem moni-toring: A review. International Journal of Remote Sensing, 25 (2004) 1565–1596
[13] J. R. Jensen, Introductory digital image processing. 3rd edition. Upper Saddle River, NJ: Prentice Hall. ISBN: 0-13-145361-0 (2005)
[14] R. Anderson, E. E. Hardy, J. T. Roach, R. E. Witmer, A land use and land cover classification system for use with remote sensor data. USGS Professional Paper 964, Sioux Falls, SD, USA (1976)
[15] J. A. Richards, X. Jia, Remote sensing digital image analysis, an introduction. 4th edition. Springer-Verlag Berlin Heidelberg (2006)
[16] R. G. Congalton, K. Green, Assessing the Accuracy of remotely sensed data, principles and practices. 2nd edition. CRC Press, Taylor & Francis Group, Boca Raton London New York (2009)
[17] C. Kamusoko, M. Aniya, Hybrid classification of Landsat data and GIS for land use/cover change analysis of the Bindura district, Zimbabwe. International Journal of Remote Sensing, 30 (2009), 97–115
[18] H. M. Sulieman, Mapping and modelling of vegetation changes in the southern Gadarif region, Sudan, using re-mote sensing. TUD press, ISBN-13: 978-3-940046-57-4 (2008)
[19] K. Rutchey, L. Velchek, Development of an everglades vegetation map using a SPOT image and the Global Posi-tioning System. Photogrammetric Engineering and Remote Sensing, 60 (1994), 767-775.
[20] C. C. Petit, E. F. Lambin. Impact of data integration technique on historical land-use/land-cover change: Compar-ing historical maps with remote sensCompar-ing data in the Belgian Ardennes. Landscape Ecology, 17 (2002), 117-132
[21] D. W. Nelson, L.E. Sommer, Methods of soil analysis. Part 3. Chemical methods, soil science of America and American Society of Agronomy, SSSA Book Series No.5. Madison-USA (1996)
[22] S. Kuo, Phosphorus in Sparks DL et al. (Eds). Methods of soil analysis. Part III. Chemical methods. Soil Science Society of America and American Society of Agronomy Madison, WI (1996)
[23] P. A. Helmke, D. L. Sparks, Lithium, sodium, potassium, rubidium, and cesium. In Methods of Soil Analysis. Part III. Chemical Methods, Soil Science Society of America and American Society of Agronomy: Madison, WI (1996)