THE USE OF SATELLITE REMOTE SENSING DATA AND GEOGRAPHIC
INFORMATION SYSTEMS ON CRITICAL LAND ANALYSIS
Agus Suharyanto1*), Ery Suhartanto2) and Pudyono1)
1) Department of Civil Engineering Brawijaya University Jl. MT. Haryono 167 Malang 65145 East Java Indonesia 2) Department of Water Resources Engineering Brawijaya University
Jl. MT. Haryono 167 Malang 65145 East Java Indonesia
*) Corresponding author Phone: +62-341- 587710, 587711 E-mail: [email protected]
Received: October 12, 2012/ Accepted: March 24, 2013
ABSTRACT
Critical land classification can be analyzed using Soil Thickness and BRLKT methods. Both methods need soil erosion data as one of input data. The soil erosion can be analyzed using USLE and MUSLE methods. Base on two critical land analyses methods with input soil erosion data analyzed using two methods will result in four combinations of critical land classification procedures. In this research, critical land classification and soil erosion classification were analyzed using GIS. The best method to classify critical land was investigated in this research, where the best classified critical land is the classified critical land result same with the field condition. Percentage of vegetation cover (PVC) is one of the most important input data in the critical land classification analysis using BRLKT method. This data has 50 of 100 total weights. To analyze this PVC classification, NDVI generated from satellite remote sensing data was employed in this research. From the four results of critical land classified using four procedures used in this research, critical land classified using BRLKT method with input soil erosion analyzed using USLE method produced the critical land classification same with the critical land condition in the field.
Keywords: critical land, land erosion, GIS, satellite remote sensing data, NDVI
INTRODUCTION
Critical land is one of the most important data in land capability analysis, especially in watershed management (Prakash et al., 2007). There are many methods to analyze critical land, two of which are Soil Thickness (ST) and BRLKT (Badan
Rehabilitasi Lahan dan Konservasi Tanah – Land Rehabilitation and Soil Conservation Agency) methods (Hardjowigeno, 2001). To classify the critical land using ST method, top soil thickness and soil erosion data are needed. The classification level of critical land is classified due to the combination of those values of input data. In the BRLKT critical land analysis method, soil erosion data is also one of input data.
Soil erosion data can be analyzed using USLE (Universal Soil Loose Equation) and MUSLE (Modified Universal Soil Loose Equation) methods. USLE (Wischmeier and Smith, 1978) and its principle derivative predict the long-term average annual rate of erosion on a field slope based on rainfall pattern, soil type, topography, crop system, and management practice. This method is an erosion model to estimate average soil loss that would generally result from splash, sheet, and rill erosion from agriculture plots. The empirical model, USLE has been widely used as an erosion prediction technology for soil conservation, but it has limited application in other regions with different topographical and climatic conditions (Park et al., 2012). The magnitude of soil erosion depends on two forces – the detachment of soil particle by the impact of rainfall energy, called the erosivity of rain, and the ability of the soil to resist the detachment of its particles by this force, called the erodibility of soil (Ghanshyam, 2004). In fact, the detachment of soil doesn’t affect only by the erosivity of rain but also affected by surface runoff. Therefore, the erosivity of rain factor in the USLE formula is replacing by surface runoff factor, and the model called MUSLE. By using the MUSLE formula, estimates sediment yield on per storm basis, instead of average soil erosion per year as done by the USLE. By using MUSLE model, the soil
Accredited SK No.: 81/DIKTI/Kep/2011
erosion based on surface runoff data on the catchment area can be analyzed well.
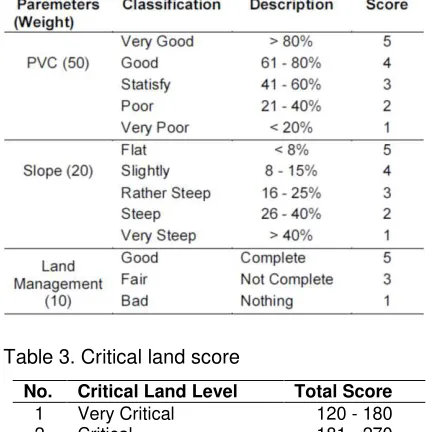
For BRLKT method, in addition to soil erosion data, percentage of vegetation cover (PVC), slope, and land management are needed as input data. BRLKT method was employed to analyze critical land condition in Indonesia from 1988 after published by Ministry of Forestry (Anonymous, 1988). In this method, four inputs of data were needed in critical land analysis. The input data represent the percentage of vegetation cover (50%), slope (20%), soil erosion (20%), and land management (10%), where the biggest percentage was in PVC which scored 5, 4, 3, 2, and 1. If the land covered by vegetation is more than 80%, the PVC score is 5. The other categories of PVC condition are land covered by vegetation 61 – 80%, 41 – 60%, 21 – 40%, and less equal than 20%. The score of each category are 4, 3, 2, and 1, respectively.
Usually, PVC can be analyzed using land use map, aerial photo interpretation, and manual interpretation from satellite remote sensing data. Base on theoretical frame, PVC interpreted from aerial photo has the highest precision result (Satofuka et al., 2006). This method needs availability of aerial photograph periodically, and the interpretation process is costly and time-consuming. Satellite remote sensing data is one of digital data which can be use to analyze land cover condition including vegetation cover. PVC is estimated using NDVI (Normalized Difference Vegetation Index). NDVI is the ratio between digital value (DV) of near infra red band and DV of red band (Morawitz et al., 2006). The value of NDVI ratio is represented as the PVC (Morawitz et al., 2006, Tittebrand et al., 2009). Because of all of the data used on the soil erosion and critical land analyses were spatial data, Geographic Information Systems (GIS) would be used as tool in the analyses process in this research. Each data is represented by layer, and analysis was done by overlapping layer by layer.
From this research, four classified critical lands and maps could be produced by four procedures of critical land classification. The four procedures of critical land classification are:
1. Critical land analyzed using ST with soil erosion generated by USLE method.
2. Critical land analyzed using ST with soil erosion generated by MUSLE method. 3. Critical land analyzed using BRLKT with soil
erosion generated by USLE method. 4. Critical land analyzed using BRLKT with soil
erosion generated by MUSLE method. Based on research background as described above, the purposes of this research can be defined as follows:
1. To find out the effectiveness of NDVI as input data to analyze the critical land. 2. To understand how to analyze critical land
using ST and BRLKT methods based on GIS.
3. To find out the best method to classify critical land from four procedures of critical land classification analyses donein this research.
MATERIALS AND METHODS
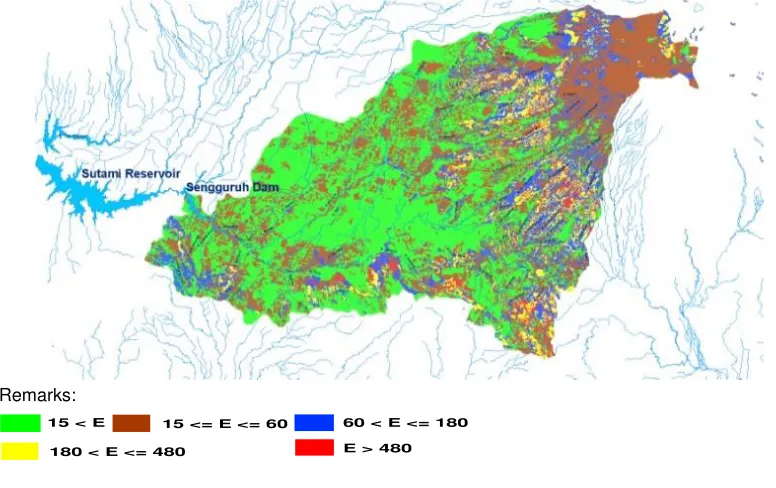
The research was done in Lesti watershed (63,750 km2). This watershed is located in Southern part of East Java Province, Indonesia. Lesti watershed was divided into three sub basins, namely Lesti Hulu sub basin, Lesti Hilir sub basin, and Genteng sub basin. The outlet of Lesti watershed is Sengguruh dam, which is as cover dam of Sutami reservoir (Harianto, 2007). Because of high soil erosion rate from Lesti watershed, Sengguruh cover dam is necessary to protect the sedimentation on Sutami reservoir. The topogra-phic conditions are from flat land until hilly area with slope from 0% until more than 45%. Six soil types were found in the research area. There were 11 rainfall stations used in this research. These rainfall stations were distributed in the whole area of Lesti watershed. The illustration of the Lesti watershed condition is shown in Figure 1.
The materials used in this research are as follows:
1. Indonesian Topographic Map in scale 1:25,000 for 15 sheets.
2. SPOT satellite Remote Sensing data with path and row numbers from297 - 366 and acquisition date on July 16, 2009.
3. Soil type map in scale 1:100,000 4. Soil thickness map in scale 1:100,000
Remarks:
Figure 1. Soil erosion map USLE
As mentioned, the soil erosion was analyzed using USLE and MUSLE methods. Those soil equations can be shown in equation 1 and 2, respectively:
E = R x L x S x K x C x P (1) E = Rw x K x L x SxC x P (2)
Where:
E = Estimated gross soil erosion (ton/ha/yr)
K = Soil erodibility factor R = Rainfall erosivity factor C = Crop management factor L = Slope length factor
P = Conservation practice factor S = Slope gradient factor Rw = Surface runoff erosivity
w=9.05 (Vo.Qp)0.56 Vo=Ra .e(-Rc Ro)⁄
Rc=1,000 .Ms.ρb.RD.(EoEt)0,50
Ro=Ra/Rn
Where:
Vo = Surface runoff volume (m3)
Ms = Field capacity soil moisture (%)
Qp = Peak discharge (m3/sec.)
ρb = Specific weight top soil (mg/m3)
Ra = Sum of monthly rainfall RD = Effective deep of root (m) Rc = Soil moisture capacity
Et/Eo = Ratio of actual (Et) and potential (Eto) Evapotranspirations
Table 1. Critical Land Using ST Method
Remarks: VL = Very Light, L = Light, M = Medium, H = Heavy, VH = Very Heavy
Critical land analyses were done by ST and BRLKT methods. The critical land classified using ST method need top soil thickness and soil erosion data. With the combination of those two data, the critical land could be classified. The combination pattern of those two data to classify the critical land can be seen in Table 1. From the Table, it can be seen that if soil thickness is 61 –
15 < E 15 <= E <= 60 60 < E <= 180
90 cm and soil erosion is 61 – 180 ton/ha/year (level III), the land could be classified into heavy (H) condition of critical land. The critical land condition in Lesti watershed was classified in the same way. The second method used to analyze critical land condition was BRLKT method. The parameters of this method involve PVC, soil erosion, slope, and land management. Each parameter was 50, 20, 20, and 10, respectively. Based on each parameter condition, scoring was given to each parameter. Parameters and scores to analyze critical land using BRLKT method are shown in Table 2. Score of each parameter could be calculated by timing weight and score of each parameter. The total score results from sum of score of each parameter. The critical land of Lesti watershed was classified based on the criteria shown in Table 3. For example, if the land has PVC which is in a good condition, land scores 50 x 4 = 200. The score for other parameters can be calculated in a similar way. By assuming of score from each parameter, the total score can be calculated. When the total score of analyzed critical land is 150, the land is categorized as very critical land level.
From Table 2, it can be seen that the most prominent weight of parameters to analyze critical land using BRLKT method is PVC. It is very difficult to analyze PVC using manual method, such as interpretation of land use map, interpretation aerial photograph, and classification obtained from satellite remote sensing data according to manual procedure. Therefore, in this research the NDVI was used to predict PVC. NDVI had value from -1 to 1, where the absolute value was used in this research, meaning that the NDVI value ranged from 0 to 1 (Suharyanto et al., 2009). Zero means that area is not covered by vegetation, and 1 means that area was covered 100% by vegetation (Nakagawa et al., 2007). Based on the NDVI value, the classification of PVC as shown in Table 2 was predicted. The prediction method is using the following assumption. PVC less than 20% is equal to the NDVI value less than 0.2, PVC between 21 – 40% is equal to 0.21 <NDVI < 0.4, PVC 41 – 60% is equal to 0.41 <NDVI < 0.6, PVC 61 – 80% is equal to 0.61 <NDVI < 0.8, and PVC more than 80% is equal to NDVI value more than 0.8. By using this prediction method, the PVC condition of Lesti watershed can be classified.
Table 2. Critical land using BRLKT Method
Table 3. Critical land score
No. Critical Land Level Total Score
1 Very Critical 120 - 180 2 Critical 181 - 270 3 Rather Critical 271 - 360 4 Potential to Critical 361 - 450 5 Not Critical > 450
RESULTS AND DISCUSSION
Lesti watershed is located in southern part of Malang Regency, East Java Province, Indonesia. The watershed boundary was determined using topographic map. After the boundary of Lesti watershed was decided, the soil erosion was analyzed. Rainfall erosivity factor was analyzed based on the 11 rainfall stations with 10 year daily rainfall data from 2000 to 2009. The unit map of rainfall erosivity factor was Thiessen polygon, which was obtained from 11 rainfall stations. The slope length and slope gradient factors were analyzed altogether as a topographic factor (Rodríquez and Suárez, 2010).
This layer was developed by classifying slope based on contour data with class interval as shown in Table 2. Layer soil erodibility was developed according to the soil type map. The crop management and conservation practice were combined as one factor, namely land management factor. The attribute of this layer was analyzed based on the land cover map obtained from SPOT data. When spatial and attribute data of all parameters of USLE method wereready, the over laid processing through the GIS rule was carried out. By using geo-statistical process, the classified soil erosion level data and map could be found as shown in Table 4 and Figure 1.The same way was done for calculating the soil erosion using MUSLE method. The unit map to calculate of surface runoff erosivity (Rw) was sub basin of Lesti watershed. After overlapping all layers, the soil erosion classified using MUSLE method on Lesti watershed could be obtained as shown in Table 4. From this Table, it can be seen that soil erosion calculated with USLE had different result from that of MUSLE methods. Both soil erosion data calculated using USLE and MUSLE methods are used as input data for calculating the critical land using ST and BRLKT methods. From Table 4 it can be seen that soil erosion evaluated using MUSLEwas spread evenly for each level. Almost each level of critical land classification occupied 20% of Lesti watershed area. Only 12% of Lesti watershed area was classified into very heavy level. On the other hand, using USLE almost area of Lesti watershed was classified into very light and light level. More or less, 45% of Lesti watershed area was classified into very light level and approximately 35% was classified into light level. Only 8.5% of
Lesti watershed area was classified into heavy and very heavy levels. However, the effect of these classified soil erosion to the critical land analysis will be investigated.
Critical land level was classified using ST and BRLKT methods. For ST method, soil thickness and soil erosion level layers were overlaid. According to the combination pattern shown in Table 1, critical land of Lesti watershed was classified. The first procedure was done by overlaying soil thickness layer and soil erosion layer analyzed using USLE method. The unit map attributed as combination of soil thickness and soil erosion data was obtained. Unit map with the attribute of soil thickness more than 90 cm and soil erosion between 61–180 ton/ha/year was classified into medium (M) class of critical land. By looking the attribute of all units map, and based on Table 1 criteria, the critical land of Lesti watershed was classified. For example, if the unit map have attribute of soil thickness is between 61 – 90 cm and attribute of soil erosion is more than 480 ton/ha./year, than the unit map was classified into very heavy critical land (VH).
Table 5.Critical land of Lesti watershed
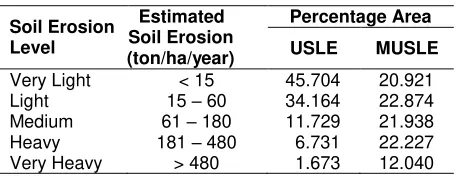
The last or fourth layer is land management developed based on land cover map and land management statistical data of Lesti watershed. Land cover was classified using unsupervised classification method with maximum distance classification (Mather, 1987). The developed four layers were overlaid, and due to the criteria shown in Table 2, the total score was calculated using geo-statistical method. Critical land of Lesti watershed was classified due to classification criteria shown in Table 3 based in the total score. Two critical land classifications were found from the BRLKT analysis involving (1) critical land classification with soil erosion data input analyzed using USLE and (2) critical land classification with soil erosion data input analyzed using MUSLE. The critical land classified using BRLKT is shown in Table 5. Figure 2 shows critical land map classified using BRLKT method with soil erosion input analyzed using USLE. From Table 5, the distribution pattern level of critical land classified using ST method is similar with distribution pattern of soil erosion level. This similarity of distribution pattern occurred because only two parameters which were used to classify the critical land used ST method. Those parameters are soil thickness and soil erosion level.
Critical land classified using BRLKT method with soil erosion analyzed using USLE and MUSLE as one of input data had different distribution pattern result. With soil erosion calculated using USLE as input data, the biggest area of critical land in Lesti watershed was rather critical with an area comprising 40.487% of total area. With soil erosion calculated using MUSLE as one of input data, the biggest area of critical land in Lesti watershed was critical with an area comprising 56.682% of total area. As listed in Table 5, there was no land classified into not critical category in critical land analysis using BRLKT with soil erosion input data calculated
using MUSLE. The same case, only 0.171% of Lesti watershed land was classified into potential to critical category. Therefore, in this research the best result of the classified critical land level using ST and BRLKT methods should be investigated. Here, the best result means the classified critical land level is nearest with the ground condition.
To find out the best method of critical land classification, 25 locations were selected as samples for ground check. Five samples for each critical land level were selected. The geographic coordinate of sample was measured using hand held GPS (Geodetic Positioning Systems). By comparing between the critical land condition observed from ground check and critical land from classification result on the same area for each sample, the checked off or agreement of critical land condition could be obtained. The best method of critical land classification procedure was selected for the procedure those have highest number agreement of classified critical land and sampling data from ground check.
From the agreements between critical lands categories were found from ground check and from the classification result, the highest agreement is critical land classified using BRLKT method with soil erosion input data analyzed using USLE.The agreement is 92%, it mean two samples only it was not agreed from the 25 samples. From this agreement it can be concluded that PVC generated from NDVI value can be used as input data in critical land analysis using BRLKT method. The PVC data is very important, because those data have weight 50 from 100 total weights. From this result it can be recommended that critical land analysis using BRLKT method with soil erosion analyzed using USLE can be used in Indonesia.
Remarks:
Figure 2.Critical land was classified using BRLKT with USLE soil erosion
CONCLUSIONS
Percentage of Vegetation Cover (PVC) data is one as important input data in the critical land analysis using BRLKT method. This data was classified based on NDVI data obtained from SPOT satellite remote sensing data. The classified critical land using BRLKT method with soil erosion input data classified using USLE had 92% agreement with ground check data. Therefore, it can be concluded that PVC classified based on NDVI is effective as input data to analyze the critical land.
All parameters data used in the critical land analyses were stored in GIS format. Both spatial and attribute data were stored layer by layer for each parameter. The critical land analysis could be done by only overlapping the layers relating to the parameters needed. After overlapping process, critical land was classified using geo-statistical process. This classification process is fast and precise. Based on the critical land classification process using GIS procedure, it can be concluded that the procedure in analyzing critical land using ST and BRLKT through the GIS rule is proven very effective and efficient.
The accuracy of classified critical land using ST and BRLKT methods was estimated by comparing with the field condition observed by ground check. Critical land level classified using BRLKT method with soil erosion input data classified using USLE had 8% disagreement. From this result, it can be concluded that the highest accuracy of classified critical land from four classified critical lands produced in this research was found in critical land classified using BRLKT method with soil erosion generated from USLE. Therefore, it is recommended that BRLKT critical land classification method with soil erosion analyzed using USLE as one of input data should be used to classify critical land in watershed area in Indonesia.
ACKNOWLEDGMENTS
The authors would like to acknowledge the Community Service and Research Centre (LPPM) University of Brawijaya for their help in this research administration. This research was carried out in the frame of research project funded by the Directorate General of Higher Education, Ministry of National
Potensial to Critical Rather Critical Critical Land Very Critical
Education, Indonesia through the competitive research grants in 2010.
REFERENCES
Anonymous. 1998. Guidance book for detail engineering design compilation of land rehabilitation and soil conservation in watershed. Ministry of Forestry Indonesia (in Indonesian). p. 50-110.
Ghanshyam, D.A.S. 2004. Hydrology and soil conservation engineering, Prentice Hall of India. p. 81-203.
Harianto. 2007. River basin development and its impact to sediment balance in the basin case study: the Brantas river basin Indonesia. Second International Workshop on Water and Sediment Management, JasaTirta I Public Corporation. Indonesia. p.25- 33.
Hardjowigeno, S.W. 2001.Land suitability and land use plan. Soil Science Department, Bogor Agriculture Institute. Bogor-Indonesia. p.110-155.
Mather, P.M. 1987. Computer processing of remotely sensed images. Chichester. p.76-144.
Morawitz, D.F., T.M. Blewett, A. Cohen and M. Alberti. 2006. Using NDVI to asses vegetative land cover change in central puget sound. Journal of Environmental Monitoring and Assessment. Springer 114: 85-106.
Nakagawa, H., Y. Satofuka, S. Oishi, Y. Muto, T. Sayama, K. Takara and R.H. Sharma. 2007. Rainfall and sediment run off in the Lesti river basin, Tributary of the Brantas river, Indonesia. Brantas River Workshop in Malang, Indonesia. p.45-51.
Ozcan, A.U., G. Erpul, M. Basaran and H. E. Erdogan. 2008. Use of USLE/GIS techno-logy integrated with geostatistics to assess soil erosion risk in different land use of Indagi mountain pass Çangkiri, Turkey. Journal of Environment and Geology. Springer. 53: 1731-1741.
Park S.D., K.S. Lee and S.S. Shin. 2012. Statistical soil erosion model for Burnt mountain areas in Korea – RUSLE Approach. J. of Hydrologic Engineering 17(2): 292-304. Prakash A.K., I.V. Muralikrishna, P.K. Mishra and
R.V.R.K. Chalam. 2007. Deciding alternative land use option in watershed using GIS, Journal of Irrigation and Drainage Engineering. 133 (2): 162-174. Rodríquez J.L.G. and M.C.G. Suárez. 2010. Estimation of slope length value of RUSLE factor L using GIS. Journal of Hydrologic Engineering 15(9): 717-717. Satofuka, Yoshifumi, and N. Hajime. 2006.
Satellite remote sensing data for Brantas river management. First Brantas River International Workshop, University of Yamanashi Japan – Jasa Tirta I Public Corporation Indonesia. p.10 – 16. Suharyanto, A., R. Anwar and Pudyono, 2009.
Landcover condition analysis using satellite remote sensing data, research report. Civil Engineering Department, University of Brawijaya Indonesia. p.10- 35.
Suharyanto, A. 2008. Mapping for critical land identification using GIS in Lesti river basin. Project Report, Civil Engineering Dept. Brawijaya University.Indonesia. p.33-78. Tittebrand A., U. Spank and C.H. Bernhofer. 2009.
Comparison of satellite-and ground-based NDVI above different land-use type. Journal of Theory Application Climatology. Springer .98: 171-186.