SATELLITE-BASED APPROACH FOR MULTI-TEMPORAL PM10 ANALYSIS OVER MALAYSIA
ASMALA AHMAD, MAZLAN HASHIM, M. NIZAM AYOF, AGUS SETYO BUDI
Dept. of Science and Mathematics, Centre of Academic Services (CAS), National Technical University, College of Malaysia (KUTKM), Locked Bag 1200, Ayer Keroh, 75450 Malacca, Malaysia
Dept. of Remote Sensing, Faculty of Geoinformation Science and Engineering, Universiti Teknologi Malaysia (UTM), Locked Bag 791, 80990 Johor Bahru,Malaysia.
Dept. of Science and Mathematics, Centre of Academic Services (CAS), National Technical University, College of Malaysia (KUTKM), Locked Bag 1200, Ayer Keroh, 75450 Malacca, Malaysia
Dept. of Science and Mathematics, Centre of Academic Services (CAS), National Technical University, College of Malaysia (KUTKM), Locked Bag 1200, Ayer Keroh, 75450 Malacca, Malaysia
Abstract: This study aims to analyse one of the haze major constituent, particulate matter sizing less than 10 micron (PM 10) from space-borne platform. Seven dates of NOAA-14 AVHRR satellite were successfully recorded for this purpose. These remotely sensed data represented the seven days during the September 1997 thick haze episode in Malaysia. Five locations of air pollution station were selected where PM10 has been measured. Visible (0.58 - 0.68 m) and Near Infrared (0.725 - 1.00 m) of AVHRR band was utilised for this purpose. Relationship between the satellite reflectance and the corresponding PM 10 ground measured API was determined using regression analysis. Variation of PM 10 concentration for seven days was then analysed using the obtained model. Finally, accuracy of the result was assessed using RMSE technique. The result proven that remote sensing technique using NOAA-14 AVHRR data was capable of quantifying PM 10 concentration spatially and continuously. Complementarily, DMSP and Earth Probe TOMS satellite data were also used as comparison.
Keywords: Haze, PM 10, API, NOAA-14 AVHRR, regression
1. Introduction
In recent times, reduced visibility has become a recurrent phenomenon across areas of Southeast Asia, resulting from biomass burning in Kalimantan and Sumatra. Haze events have been recorded in 1983, 1990, 1991, 1994, 1997 and 1998 (Radojevic and Hassan 1999, Muraleedharan et al. 2000). Koe et al. (2001) noted that reduced visibility in Malaysia during the 1997 haze episode was the result of long range transport of smoke from Sumatra. Haze from biomass burning contains large amount of trace gases (e.g., CO, NO2, SO2) and particles matter (e.g., organic matter, graphitic carbon), which are
hazardous to health. Lung and eye deceases have been identified as the common immediate effect of haze. In long term, haze is capable of increasing the atmospheric greenhouse effects besides affecting the tropospheric chemistry. In big cities, emission from industrial and vehicle have acted as local contributors that worsen the situation.
Main constrains over conventional monitoring instruments are that they could not detect an early sign of haze and is impractical for large areas or for continuous monitoring. Besides that they are also logistically expensive and time consuming. The 1997 haze events prompt the need for searching of an alternative method for determining and monitoring haze in Malaysia.
Remote sensing offers a cheap, fast and more reliable alternative to monitor haze continuously over any given areas and at any time. The current study is an extension of previous work that earlier discussed on techniques for determination and mapping of haze from NOAA-14 AVHRR scene (Asmala and Mazlan, 1997, 2000, 2002).
2. Materials
Materials used in this study are as follows:
2.1 Ground-truth data
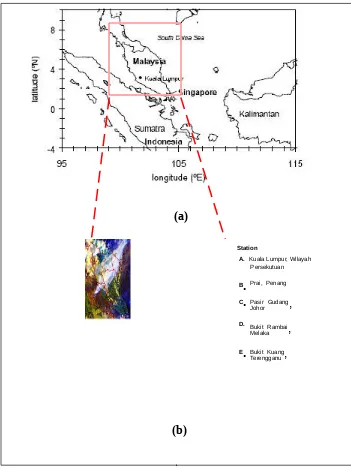
Figure 1 : (a) Study area, and (b) Combination of band 1 (0.58 - 0.68 m), 2 (0.725 - 1.00 m) and 4 (10.30 - 11.30 m) of NOAA-14 AVHRR data dated 22 September 1997, were used to differentiate between haze (orange), low clouds (yellow) and high clouds (white).
2.2 Satellite data
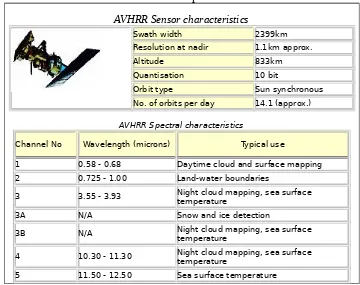
Seven sets of NOAA-14 AVHRR data dated 22, 23, 25, 2, 28, 29 and 30 September 1997 acquired from SEAFDEC (Southeast Asia Fishery Development Centre) receiving station were used. NOAA-14 AVHRR was suitable for haze study as it offers high spectral and temporal resolution with a minimum cost. Some useful characteristics of NOAA-14 AVHRR satellite are shown in Table 1.
2.3 Ancillary data
Meteorological information over study area, including visibility, air temperature, pressure, relative humidity, wind, etc were obtained from MMS (Malaysian Meteorological Service).
Station
A. Kuala Lumpur, Wilayah Persekutuan
B
.
Prai, PenangC
.
Pasir Gudang,
Johor
D. BukitRambai
,
Melaka
Table 1: NOAA-14 AVHRR sensor and spectral characteristics
AVHRR Sensor characteristics
Swath width 2399km
Resolution at nadir 1.1km approx.
Altitude 833km
Quantisation 10 bit
Orbit type Sun synchronous
No. of orbits per day 14.1 (approx.)
AVHRR Spectral characteristics
Channel No Wavelength (microns) Typical use
1 0.58 - 0.68 Daytime cloud and surface mapping
2 0.725 - 1.00 Land-water boundaries
3 3.55 - 3.93 Night cloud mapping, sea surface temperature
3A N/A Snow and ice detection
3B N/A Night cloud mapping, sea surface temperature
4 10.30 - 11.30 Night cloud mapping, sea surface temperature
5 11.50 - 12.50 Sea surface temperature
(Source: Kidwell et al., 1995)
3. Method
Four modules incorporated in this study are (a) Derivation of haze model, (b) Sampling and Regression analysis, (c) Multi-temporal analysis, and (d) Visual analysis from other satellite data.
3.1 Derivation of haze model
Prior to further data processing, post launch calibration of visible and near infrared channel was earlier implemented in order to compensate data degradation due to extreme temperature change before and after launching of AVHRR sensor to space (Rao et al., 1996). Clouds and haze were successfully differentiated using thresholding technique (Baum et al., 1997). This to ensure both were not being misinterpreted between each other. Model used in this study is based on Siegenthaler and Baumgartner (1996), which make use of skylight to indicate the existence of haze. Skylight is an indirect radiation, which occurs when radiation from the sun being scattered by elements within the haze layer. It is not a direct radiation, which is dominated by pixels on the earth surface. Figure 2 shows electromagnetic radiation path propagating from the sun towards the NOAA-14 AVHRR satellite penetrating through a haze layer. Path number 1, 3 and 4 are skylight caused by direct radiation, whereas path 2 is indirect radiation.
This model can be described by:
- R = L – V …(1)
where, : reflectance recorded by satellite sensor,
R : reflectance from known object from earth surface ,
L : skylight, and
V : lost radiation caused by scattering and absorption.
3.2 Sampling and regression analysis
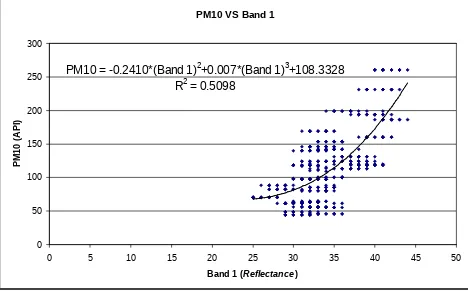
From the NOAA-14 AVHRR data, calibration pixels were sampled within a radius of 2.5 km from each of the air pollution stations in order to execute regression analysis. The best regression models for PM10 is shown below where the R2 (coefficient of determination) obtained is 0.5098 (Figure 3).
Figure 3 : Regression model for PM 10
3.3 Multi-temporal analysis
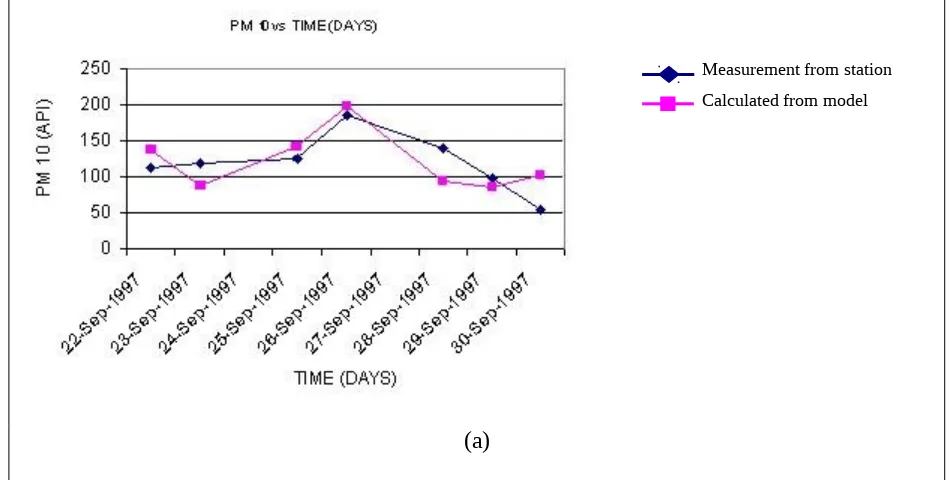
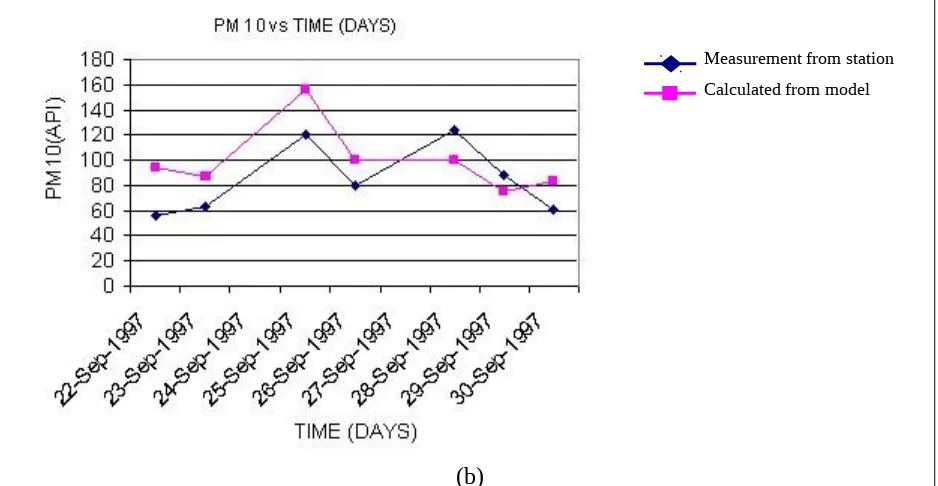
Multi-temporal analysis was performed at two selected cities, Prai Station in Penang and Pasir Gudang Station (Figure 4) in Johor. Results of the analysis were shown as graphs of haze intensity variation (API vs time) for all the five major components throughout the seven NOAA-14 AVHRR acquisition dates (Figure 6). Root-mean-square error (RMSE) analysis was carried out where ground-truth measured API and model derived API were used as input. Obtained RMSE both cities are shown in Table 2.
APIcalculated APImeasured 2 n
1
RMSE …
(2) where:
n : sample size,
APIcalculated : Air Pollution Index calculated by model
APImeasured : Air Pollution Index measured by air station
3.4 Visual analysis from other satellite data
Visually, the scenario was also observed from other satellite data such as DMSP (Defence Meteorological Satellite Program) satellite (Figure 7) and Earth Probe TOMS (Total Ozone Mapping Spectrometer) satellite (Figure 8).
4. Results and Discussion
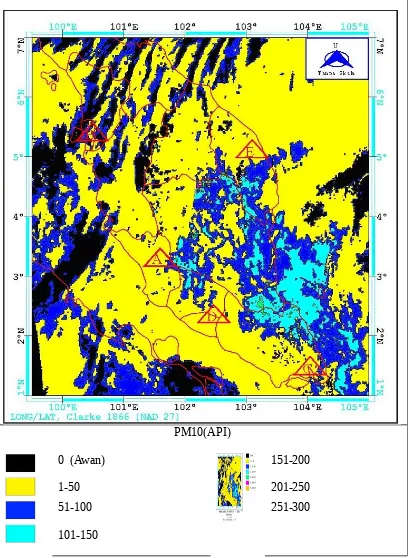
Result of this study was presented as PM 10 concentration map for the whole Peninsular Malaysia. PM 10 condition for 26 September 1997, 7.29 GMT is shown in Figure 5. RMSE for selected big cities; Prai and Pasir Gudang are 31 and 27 respectively. It was believed that the relatively high gained RMSE was due to limited number of air pollution stations used. Future study will consider of using more air pollution stations as well as higher resolution satellite data in order to obtain better accuracy.
PM10 VS Band 1
PM10 = -0.2410*(Band 1)2+0.007*(Band 1)3+108.3328
R2 = 0.5098 0 50 100 150 200 250 300
0 5 10 15 20 25 30 35 40 45 50
Band 1 (Reflectance)
Table 2 : RMSE for PM 10 concentration at Penang and Johor Bahru
Location PM10 (API)
Prai, Penang 31
Pasir Gudang, Johor Bahru 27
5. Conclusion
The study shows that remote sensing technique is capable of monitoring and quantifying PM 10 concentration continuously with minimum cost and time. These are useful in order to provide haze early warnings, so that necessary measures could be taken effectively by both government authorised party as well as public.
(a)
(b)
Figure 4 : Multitemporal trend of calculated and measured PM 10 at (a) Prai, Penang, and
(b) Pasir Gudang, Johor.
PM10(API)
0 (Awan)
151-200
1-50
201-250
51-100
251-300
101-150
Figure 6 : Haze visual analysis from band 1, 2 and 4 of NOAA-14 AVHRR satellite data for March 1997 (a)22nd,
(b)23rd, (c)25th, (d)26th, (e)28th, (f)29th and (g)30th .
Landcover Water Stable Fire Cloud Boundary N/A
[image:8.595.53.552.281.472.2](Source : National Geophysical Data Center, NOAA, USA)
Figure 7 : Haze visual analysis from DMSP satellite data for March 1997 (a)22nd, (b)23rd, (c)25th, (d)26th,
(e)28th, (f)29th and (g)30th .
(Source: Goddard Space Flight Center, USA)
Figure 8 : Haze visual analysis from Earth Probe TOMS satellite data for March 1997 (a)22nd, (b) 23rd, (c)26th,
(d)28th, (e)29th and (f)30th .
(a)
(b)
(c)
(d)
(e)
(f)
(g)
(a)
(b)
(c)
(d)
(f)
[image:8.595.68.536.516.668.2]References
Alam Sekitar Malaysia Sd. Bhd. (1998). “Measurement of Air Pollution Index (API).” ASMA: Unpublished.
Asmala Ahmad and Mazlan Hashim (2002). “Determination of Haze Using NOAA-14 Satellite Data.” Proceedings on The 23rd Asian Conference on Remote Sensing 2002 in Kathmandu, Nepal, 25-29 November 2002.
Asmala Ahmad, and Mazlan Hashim, (1997). “Determination of Haze from Satellite Remotely Sensed Data : Some Preliminary Results. “Proceedings on The 18th Asian Conference on Remote Sensing 1997 at Nikko Hotel, Kuala Lumpur.
Asmala Ahmad, and Mazlan Hashim, (2000). “Determination of Haze Air Pollution Index from Forest Fire Emission during the 1997 Thick Haze Episode in Malaysia using NOAA AVHRR Data.” Malaysian Journal of Remote Sensing & GIS. 1 : 77-84.
Baum, B.A. (1997). “Discrimination between clouds and smoke/fires in daytime AVHRR data.” NASA Langley Research Center Atmospheric Sciences Division Radiation Sciences Branch Homepage [Online] Available, http://asd-www.larc.nasa.gov/~baum/Pathfinder/smoke.html
Defense Meteorological Satellite Programme (DMSP) Website, http://dmsp.ngdc.noaa.gov/dmsp.html
Earth Probe TOMS Website, http://toms.gsfc.nasa.gov/eptoms/ep.html
Kidwell, K. B., comp. and ed., 1995, 14 Polar Orbiter Data (TIROS-N, 14-6, NOAA-14-7, NOAA-14-8, NOAA-14-9, NOAA-14-10, NOAA-14-11, NOAA-14-12, and NOAA-14) Users Guide: Washington, D.C., NOAA-14/NESDIS.
Koe, L. C. C, Arellano, A. F, and McGregor, J. L. (2001). Investigating the haze transport from 1997 biomass burning in Southeast Asia: its impact on Singapore. Atmospheric Environment 35, 2723– 2734,.
Malaysian Meteorological Service (1997a). : “Upper Air Data for September 1997.” Kuala Lumpur : MMS.
Malaysian Meteorological Service (1997b). : “Visibility for September 1997.” Kuala Lumpur : MMS. Muraleedharan, T. R., Rajojevic, M., Waugh, A., and Caruana, A.: Chemical characteristics of haze in
Brunei Darussalam during the 1998 episode. Atmospheric Environment 34, 2725–2731, 2000. Rao, C.R.N. and Chen, J. (1996), “Post-launch calibration of the visible and near-infrared channels of
the Advanced Very High Resolution Radiometer on the NOAA-14 spacecraft” International Journal of Remote Sensing, 17, 2743-2747.
Radojevic, M. and Hassan, H. (1999). Air quality in Brunei Darussalam during the 1998 haze episode. Atmospheric Environment 33, 3561–3568.
