TREE SPECIES CLASSIFICATION OF BROADLEAVED FORESTS IN NAGANO,
CENTRAL JAPAN, USING AIRBORNE LASER DATA AND MULTISPECTRAL IMAGES
S. Deng a, *, M. Katoh a, Y. Takenaka a, K. Cheung a, A. Ishii b, N. Fujii c, T. Gao d
a Institute of Mountain Science, Shinshu University, 8304, Minamiminowa-Village, Kamiina-County, Nagano 399-4598, Japan - (deng, mkatoh, 16as406j, 13a2036k)@shinshu-u.ac.jp
b Afan Woodland, 2742-2041, Shinanomachi, Kamiminochi-County, Nagano 389-1316, Japan - info@afan.or.jp c Asia Air Survey Co. Ltd, 1-2-2, Manpukuji, Kawasaki, Kanagawa 215-0004, Japan - nor.fujii@ajiko.co.jp d Key Laboratory of Forest Ecology and Management, Institute of Applied Ecology, Chinese Academy of Sciences, Shenyang
110016, China - tiangao@iae.ac.cn
Commission III, WG III/1
KEY WORDS: Forest resource measurement, Airborne laser scanning, Multispectral image, Broadleaved tree species classification, Support vector machine classifier, Neighborhood component analysis, Afan Woodland
ABSTRACT:
This study attempted to classify three coniferous and ten broadleaved tree species by combining airborne laser scanning (ALS) data and multispectral images. The study area, located in Nagano, central Japan, is within the broadleaved forests of the Afan Woodland area. A total of 235 trees were surveyed in 2016, and we recorded the species, DBH, and tree height. The geographical position of each tree was collected using a Global Navigation Satellite System (GNSS) device. Tree crowns were manually detected using GNSS position data, field photographs, true-color orthoimages with three bands (red-green-blue, RGB), 3D point clouds, and a canopy height model derived from ALS data. Then a total of 69 features, including 27 image-based and 42 point-based features, were extracted from the RGB images and the ALS data to classify tree species. Finally, the detected tree crowns were classified into two classes for the first level (coniferous and broadleaved trees), four classes for the second level (Pinus densiflora, Larix kaempferi, Cryptomeria japonica, and broadleaved trees), and 13 classes for the third level (three coniferous and
ten broadleaved species), using the 27 image-based features, 42 point-based features, all 69 features, and the best combination of features identified using a neighborhood component analysis algorithm, respectively. The overall classification accuracies reached 90% at the first and second levels but less than 60% at the third level. The classifications using the best combinations of features had higher accuracies than those using the image-based and point-based features and the combination of all of the 69 features.
* Corresponding author
1. INTRODUCTION
Japan has rich forest resources, with a total area of approximately 25.08 million ha and a total volume of approximately 49.01 million m3 in 2012. Of these, broadleaved forests account for approximately 47% of the total forested area (Learning Museum of the Forest and Forestry, 2017). Forest plantations were abandoned in some harvested forest areas following decreases in timber prices and as land owners aged and retired (Katoh et al., 2009). In recent years, rapid infection by pests such as pine wilt disease, which is caused by the pine wood nematode (Bursaphelenchus xylophilus) and the
Japanese pine sawyer (Monochamus alternatus), has damaged
several Japanese pine forests. Consequently, it may be necessary to clear-cut large areas dominated by infested trees and to curtail coniferous plantation programs. Broadleaved trees grow well in these clear-cut areas. Therefore, areas of secondary broadleaved forests will increase in the next few decades. Consequently, the management of broadleaved forests has become an urgent issue in Japan. Broadleaved trees have higher economic value than conifers because of their high timber hardness and use for high-value-added products, such as furniture. Currently, harvest activities in Japan are focused on planted conifer forests. More accurate information on the
condition of broadleaved forest resources is required for forestry officers and landowners to improve timber production of broadleaved trees. In addition, coniferous forests planted with a single tree species lead to ecological issues, such as pest disease and soil degradation. Recently, the change from pure conifer forests to broadleaved forests has received increasing attention from the Japanese government (NARO, 2016).
Precise tree species classification using high-density airborne laser scanning (ALS) data is a key research topic for automated forest inventories. During the last decade, many researchers have contributed to the study of tree species classification using ALS data (Ørka et al., 2009; Vaughn et al., 2012). Most studies have been limited to geometric or statistical features (Heinzel and Koch, 2011). Several point-based features have been developed to describe the structural properties of crowns of individual trees, such as crown shape and vertical foliage distribution (Li et al., 2013; Lin and Hyyppä, 2016). However, most of these studies found that it was difficult to classify mixed forests accurately based only on point clouds (Ørka et al., 2009; Heinzel and Koch, 2011; Yu et al., 2014). To our knowledge, few studies have focused on broadleaved tree species identification at the individual tree level. Consequently, this study explored the classification of broadleaved trees in a
secondary forest with a large species mixture by combining ALS and multispectral data.
2. MATERIALS AND METHODS
2.1 Study Area
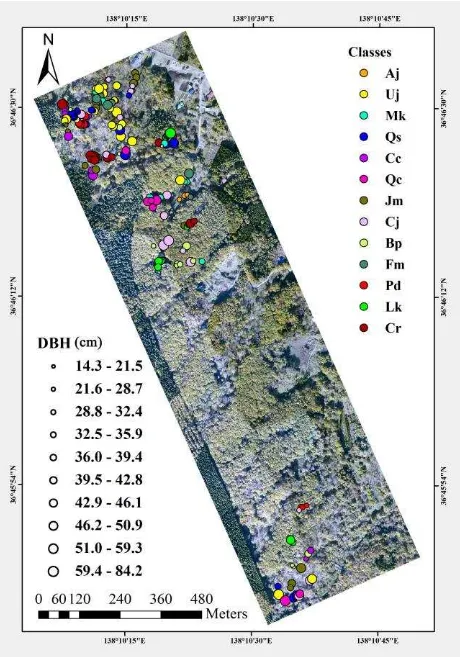
The study area, located in Northern Nagano Prefecture, central Japan, is private land that belongs to the Afan Woodland Trust. The center of the test site was located at 36°46'00"N, 138°10'30"E and has an altitude of 800 m above sea level. The study area was covered by natural broadleaved forest until the 1920s. Then, most of the natural trees were cut and conifers were planted from the 1920s to the 1950s. Over the next 30 years, these plantations were abandoned after the forest was harvested, until the Afan Woodland Trust was established in 1986. Currently, it is an ecological forest and has become a well-known educational site that is popular with Japanese elementary and middle school students. Several endangered species occur in the Afan Woodland. The forests are dominated by ten broadleaved species [Alnus japonica (Aj), Ulmus japonica (Uj), Magnolia kobus (Mk), Quercus serrata (Qs), Cornus controversa (Cc), Quercus crispula (Qc), Juglans mandshurica (Jm), Cerasus jamasakura (Cj), Betula platyphylla (Bp), and Fraxinus mandshurica (Fm)] and three
coniferous species [Pinus densiflora (Pd), Larix kaempferi
(Lk), and Cryptomeria japonica (Cr)].
2.2 Field Measurements
Field measurements were made in September and December 2016. In total, 235 dominant trees were surveyed, and the species, DBH (to the nearest 0.1 cm), and tree height were recorded (Figure 1). Each tree was tagged with a permanent label. The geographical position of each tree was determined in December 2016 with a Global Navigation Satellite System (GNSS) device (Trimble Geo7x, USA), and the locations were post-processed using data recorded simultaneously at the local base stations. The location accuracy of 99% of the trees was less than 1 meter after post-processing. Several photographs of each tree were taken for manual individual tree detection. The 184 tallest trees were used to assess the accuracy of tree species classification.
2.3 Airborne Laser Data and True-Color Images
ALS data were collected on 4 November 2012 using a Trimble Harrier 68i system (Leica Geosystems AG, Heerbrugg, Switzerland). The system was configured to record up to three echoes per pulse, i.e., the first or only, intermediate, and last.
The laser scanner used a wavelength of 1,550 nm. In this study, the point cloud data were acquired at a flight altitude of 500 m above ground level and at a speed of 90 km/h. The scanner was operated at a pulse rate of 200 kHz (i.e., 200,000
points per second), with a field of view (FOV) of 60° and a beam divergence of 0.5 mrad. The point density ranged from 30 to 208 points per m2 (over the forested area). In addition, true-color (red, green, blue; RGB) images with three bands (red, green, and blue) and a resolution of 50 cm were acquired at the same time as the laser data from a TAC P65 sensor using color mode.
Figure 1. Field measurement results
2.4 Data Analyses
The research flow chart in Figure 2 provides an overview of the methods.
Figure 2. Research flow chart
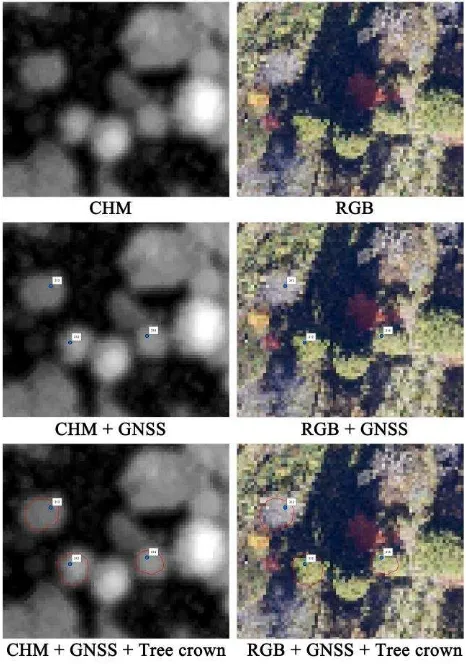
2.4.1 Delineation of tree crowns: Tree crowns were detected manually using the GNSS position data, field photos, orthoimages (RGB), canopy height model (CHM), and three-dimensional (3D) point clouds (Figure 3).
Figure 3. Manual individual tree detection
2.4.2 Feature extraction: Sixty-nine features were extracted from the RGB orthoimages and ALS data for tree species classification, including 27 image-based (Table 1) and 42 point-based (Table 2) features. Based on the algorithm presented in Holmgren and Persson (2004), an approach was developed to detect tree crown points automatically (Figure 4).
Features Description
R_mean The mean value of the red band within each tree crown
R_stdev The standard deviation of the red band within each tree crown
G_mean The mean value of the green band within each tree crown
G_stdev The standard deviation of the green band within each tree crown
B_mean The mean value of the blue band within each tree crown
B_stdev The standard deviation of the blue band within each tree crown
NG_mean
The mean Normalized Difference Vegetation Index (NDVI) derived from the green and red bands within each tree crown
NG_stdev
The standard deviation of the NDVI derived from the green and red bands within each tree crown
NB_mean The mean NDVI derived from the blue and red bands within each tree crown
NB_stdev The standard deviation of the NDVI derived from the blue and red bands within each tree
crown
RG_mean
The mean Ratio Vegetation Index (RVI) derived from the green and red bands within each tree crown
RG_stdev
The standard deviation of the RVI derived from the green and red bands within each tree crown
RB_mean The mean RVI derived from the blue and red bands within each tree crown
RB_stdev
The standard deviation of the RVI derived from the blue and red bands within each tree crown
I_mean The mean laser intensity within each tree crown
I_stdev The standard deviation of the laser intensity within each tree crown
NI_mean The mean NDVI derived from the laser intensity and red band within each tree crown
NI_stdev
The standard deviation of the NDVI derived from the laser intensity and red band within each tree crown
RI_mean The mean RVI derived from the laser intensity and red band within each tree crown
RI_stdev
The standard deviation of the RVI derived from the laser intensity and red band within each tree crown
SL_mean The mean slope value of the CHM within each tree crown
SL_stdev The standard deviation of the slope value within each tree crown
CV_mean The mean curvature value of the CHM within each tree crown
CV_stdev The standard deviation of the curvature value within each tree crown
SA_mean The mean surface area of the CHM within each tree crown
SA_stdev The standard deviation of the surface area within each tree crown
Shape Index
The ratio of the area to the perimeter of each tree crown
Table 1. Definitions of the 27 image-based features
Features Description
RHmean Relative mean height of all points to tree height
RHstdev Relative standard deviation of all points to tree height
RH10-90 Relative height of 10-90% points at 10% intervals to tree height
PP10-90 Percentage of points below 10-90% of total height with a 10% increment
RMD Relative mean distance of first and last returns to tree height
PF Proportion of first returns PI Proportion of intermediate returns PL Proportion of last returns PG Proportion of ground returns IA_max Max intensity of all returns IA_mean Mean intensity of all returns
IA_stdev The standard deviation of the intensity of all returns
IF_max Max intensity of first returns IF_mean Mean intensity of first returns
IF_stdev The standard deviation of the intensity of first returns
II_max Max intensity of intermediate returns II_mean Mean intensity of intermediate returns
II_stdev The standard deviation of the intensity of intermediate returns
IL_max Max intensity of last returns IL_mean Mean intensity of last returns
IL_stdev The standard deviation of the intensity of last returns
PC Proportion of crown returns
RCR Ratio of crown returns in 2013 to 2012 RCL Relative crown length to tree height
CPV The volume of the crown point clouds within each tree
CPD The point density of the crown points within each tree
Table 2. Definitions of the 42 point-based features
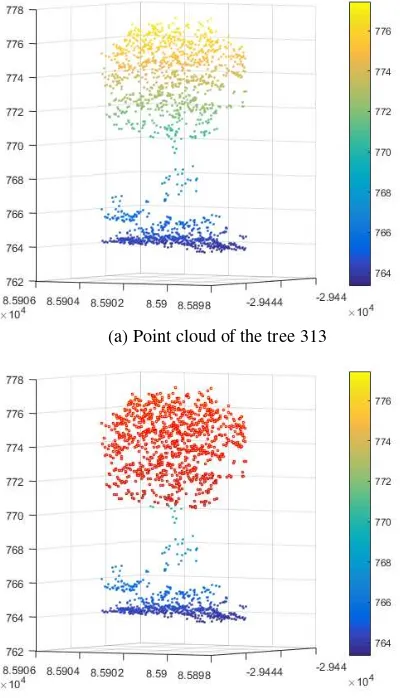
(a) Point cloud of the tree 313
(b) Tree crown points are highlighted in red Figure 4. Example of tree crown point extraction
2.4.3 Identification of the best combination of features for species classification: In this study, the best combination of features for tree species classification was identified using the neighborhood component analysis (NCA) algorithm presented in Yang et al. (2012). The NCA is a non-parametric, embedded method for selecting features with the goal of maximizing the prediction accuracy of classification algorithms. It performs feature selection with regularization to learn feature weights to minimize an objective function that measures the average leave-one-out classification loss over the training data.
2.4.4 Tree species classification: The manually detected tree crowns were classified into two classes at the first level [coniferous and broadleaved trees], four classes at the second level [Pinus densiflora (Pd), Larix kaempferi (Lk), Cryptomeria japonica (Cr), and broadleaved trees], and 13
classes at the third level [three coniferous species and ten broadleaved species] using the 27 image-based features, 42 point-based features, all 69 features, and the best combination of features identified using the NCA algorithm. A support vector machines (SVM) classifier that we previously identified a powerful classifier (Deng et al., 2016) was used for tree species classification. The predictive power of the models using different features was verified by five-fold cross-validations.
3. RESULTS
3.1 Tree Species Classifications Using Different Features
Figure 5 shows the results of the tree species classification at the three levels described in Section 2.4.3 using the 27
image-based (IB) and 42 point-image-based (PB) features, all 69 features (ALL), and the best combination of features (BC) that was identified using the NCA method. The four datasets were transformed using a principal component analysis (PCA), which explained 99% of the variance. Then, they were also used for tree species classification at the three levels, respectively. The classification accuracy using different features reached 90% at the first and second levels. However, the accuracy was less than 52% at the third level (13 species were classified). The classifications using all of the features had greater accuracy than those using the image-based and point-based features. The classification using the best combination of features had the greatest accuracy within the four datasets. However, the classifications using a PCA transformation had lower accuracy than those using the original features.
Figure 5. Tree species classifications using different features with principal component analysis transformation
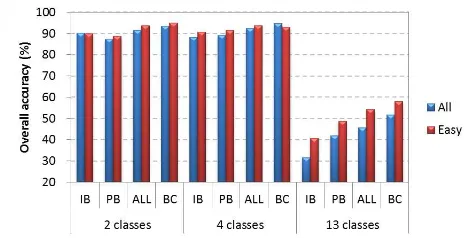
We also assessed the effect of neighboring trees on the classification. A total of 140 trees that were easily separated from the neighboring trees were classified at the three levels for a comparison with the classifications of all trees (184). The results showed that the classification of the easily detected trees had greater accuracy than those of all trees at the three levels (Figure 6). The accuracy was improved markedly at the third level, at which 13 tree species were classified. The results included in Figures 5 and 6 indicate that the NCA is an effective method for feature selection in tree species classification.
Figure 6. Comparison of the tree species classifications of all trees with easily detected trees
3.2 Identification of the Best Combination of Features for Tree Species Classification
In the NCA, the feature weights in different combinations were calculated by iteration, and the features that contributed little to the classification had very small weights. In this study, the features were selected if their weights exceeded 0.02 if the maximum weight within the combination was less than 1, or 0.02 multiplied by the maximum weight if the maximum weight was greater than 1. Based on the above conditions, 19, 17, and 29 features were identified in the classifications of all 184 field trees at the three levels, respectively. For the easily detected trees, there were 14, 16, and 32 features that contributed to tree species classification at the three levels, respectively. Table 3 lists the selected features sorted by their weights in descending order.
Classifications Selected features sorted by weight in descending order
All trees at the first level
IF_mean, SL_mean, NI_stdev, IL_stdev, RMD, IA_stdev, R_stdev, G_mean, PP80, RCR, I_stdev, PF, PI, SL_stdev, PG, B_mean, II_mean, Table 3. Results of feature selection
The results indicate that three image-based features (B_mean, R_stdev, and SL_mean) and six point-based features (IA_stdev, IF_mean, IL_stdev, PF, PI, and RCR) contributed to the classifications of all field trees at the three levels. In addition, I_stdev, NI_stdev, IA_max, PP80, and RMD contributed to the classification of all field trees at the first and second levels, and the other features identified in the classifications at the first and second levels also contributed to the classification at the third level. In comparison, the classifications of the easily detected trees identified five image-based features (G_mean, R_stdev, NB_stdev, SL_mean, and SL_stdev) and four point-based features (IF_mean, IL_stdev, PG, and RMD) at the three levels classifications. I_stdev and NI_stdev both contributed to the classifications at the first and second levels. Although other features identified in the classification at the second level contributed to the classification at the third level, PP70, PP80, and Shape Index, which were selected out in the classification at the first level, made no contribution to the classification at the third level. In addition, 25 common features were identified in the classifications of all field trees and easily detected trees at the third level.
4. CONCLUSIONS
This study classified three coniferous and ten broadleaved tree species at different levels using a support vector machine classifier by combining ALS data and multispectral images. The best combination of features for tree species classification was identified using the NCA algorithm. The predictive power of the models using different features was verified by five-fold cross-validation using the field data. The overall classification accuracy reached 93.5% and 94.6% at the first and second levels, respectively, using the best combination of features identified by the NCA method, but less than 58% at the third level, at which 13 tree species were classified. The classifications using the best combinations of features were more accurate than those using the image-based and point-based features and the combination of all 69 features, indicating that the NCA is an effective method for feature selection in tree species classification. The classifications using PCA transformations were less accurate than those using the original features. Consequently, PCA transformation is not
recommended. To improve classification at the third level, a WorldView-2 image with eight bands acquired in October 2014 will be used for tree species classification in our next study.
ACKNOWLEDGMENTS
This study was supported by the innovative project: Development of sustainable smart precision forestry using laser scanning technology from the National Agriculture and Food Research Organization (Grant Number 16822347) and a Grant-in-Aid for Scientific Research from the Japan Society for the Promotion of Science (JSPS KAKENHI Grant Number JP16K18716). We gratefully acknowledge several students at Shinshu University for their support in the field surveys.
REFERENCES
Deng, S., Katoh, M., Yu, X., Hyyppä, J., Gao, T., 2016. Comparison of tree species classifications at the individual tree level by combining ALS data and RGB images using different algorithms. Remote Sens., 8(1034), pp. 1-22.
Heinzel, J., Koch, B., 2011. Exploring full-waveform LiDAR parameters for tree species classification. Int. J. Appl. Earth Obs. Geoinf., 13(1), pp. 152-160.
Holmgren, J., Persson, Å., 2004. Identifying species of individual trees using airborne laser scanner. Remote Sens. Environ., 90(4), pp. 415-423.
Katoh, M., Gougeon, F.A., Leckie, D.G., 2009. Application of high-resolution airborne data using individual tree crown in Japanese conifer plantations. J. For. Res., 14(1), pp. 10-19.
Learning Museum of the Forest and Forestry, 2017. Japanese Forests. Available online: http://www.shinrin-ringyou.com/ forest_japan/menseki_tikuseki.php (31 July 2017).
Li, J., Hu, B., Noland, T.L., 2013. Classification of tree species based on structural features derived from high density LiDAR data. Agric. For. Meteorol., 171-172, pp. 104-114.
Lin, Y., Hyyppä, J., 2016. A comprehensive but efficient framework of proposing and validating feature parameters from airborne LiDAR data for tree species classification. Int. J. Appl. Earth Obs. Geoinf., 46, pp. 45-55.
NARO, 2016. Technological system that enables labor-saving and cost reduction of forestry. http://www.naro.affrc.go.jp/ aggressive/subject09.html (31 July 2017).
Ørka, H.O., Næsset, E., Bollandsås, O.M., 2009. Classifying species of individual trees by intensity and structure features derived from airborne laser scanner data. Remote Sens. Environ., 113(6), pp. 1163-1174.
Vaughn, N.R., Moskal, L.M., Turnblom, E.C., 2012. Tree species detection accuracies using discrete point lidar and airborne waveform lidar. Remote Sens.,4(2), pp. 377-403.
Yang, W., Wang, K., Zuo, W., 2012. Neighborhood component feature selection for high-dimensional data. J. Comput., 7(1),
pp. 161-168.
Yu, X., Litkey, P., Hyyppä, J., Holopainen, M., Vastaranta, M., 2014. Assessment of low density full-waveform airborne laser scanning for individual tree detection and tree species classification. Forests, 5(5), pp. 1011-1031.