Variability in Morpho-physiology, Tuber Yield and Starch Content
of Several Arrowroot Populations in Garut District
Asep Rohandi1*), Budiadi2), Suryo Hardiwinoto2), Eni Harmayani3) and Dede J. Sudrajat4)
1) Agroforestry Technology Research and Development Institute, Ciamis, West Java 2) Faculty of Forestry, Gajah Mada University, Bulaksumur, Yogyakarta 3) Faculty of Agriculture Technology, Gajah Mada University, Bulaksumur, Yogyakarta
4) Forest Trees Seed Technology Research and Development Institute *) Corresponding author E-mail: [email protected]
Received: July 1, 2016 /Accepted: May 10, 2017 ABSTRACT
Arrowroot (Maranta arundinacea L.) is an important starchy plant which has potential utilization for food, industry and medicine. The study was undertaken to assess the variability in morpho-physiological characters, tuber yield and starch content of 23 arrowroot populations in Garut District, West Java.
The result showed some signiicant differences in
morpho-physiological characteristics, tuber yield and starch content. Growth characteristics revealed that Cilawu population recorded the highest values for some characters: high, leaf number, above-growth biomass and tuber biomass. Cikajang population showed the highest tuber yield (210.6 g per plant) followed by Cilawu population (134 g per plant). Cikajang and Cilawu populations also provided the highest tuber biomass, 46.6 g and 60.0 g respectively. Cilawu population was a second population producing the highest starch content (26.1 %) after Cibatu population (27 %). The higher heritability coupled with genetic advance revealed for fresh tuber yield indicated that selection on basis of the character may be helpful to improve arrowroot yield. Most of the growth characteristics
had not signiicant correlation indicating that the
characteristics are not good indicator for selection. Cilawu, Cikajang and Cibatu populations have good potential to produce the high quality and quantity of tuber for arrowroot cultivation in Garut District.
Keywords: cultivation; genetic; growth; heritability; Maranta arundinacea
INTRODUCTION
Arrowroot (Maranta arundinacea L.) is a perennial plant, harvested for its edible tubers, distributed on almost the whole tropical regions. The plant is a straight perennial herb with 1.0-1.5 m in
high, supericial rooted with rhizomes growing into
the soil. The best plant growth is in well drained on loamy or sandy soil and light shaded areas (Sujatha & Renuga, 2013). Some regions such as in the Caribbean islands, Southeast Asia, South America, and India, arrowroot was planted for food sources (Erdman, M. D. & Erdman, B. A., 1984; Odeku, 2013). The species also spread out on most of islands in Indonesia that is often found in community gardens as reserve of food for time of scarcity before main food harvest (Heyne, 1987). The cylindrical rhizomes (tubers) of arrowroot has high starch contents (Valencia, Moraes, Lourenço, Habitante, & do Amaral Sobra, 2014), well known as important medicinal plant used against diarrhea, urinary related diseases. The arrowroot starch also has a similar characteristic with cassava, potato, banana and achira starch (Valencia, Moraes, Lourenço, Habitante, & do Amaral Sobra, 2014; Shintu, Radhakrishnan, & Mohanan, 2015). At the present, arrowroot is a potential shading tolerant tuber crop for food, feed and medicinal herbs (Damat, 2012; Nishaa, Vishnupriya, Sasikumar, Christabel, & Gopalakrishnan, 2012; Shintu, Radhakrishnan, & Mohanan, 2015), which can be incorporated into the forest stand in the agro-forestry patterns, without disturbing forest as global facility to reduce CO2 emission and other glass house gases.
In tuber crops, the number of roots which eventually form tubers as well as earliness of tuber bulking and maturity may depend on the genotype, assimilate supply, photoperiod and temperature. The process of tuber formation and maturity may also depend on soil water supply, soil fertility and soil temperature (Ikpi, Gebremeskel, Ezumah, & Ekpere, 1986). Variation study on the arrowroot from 4 populations (Kerala, Bihar, Madhya Pradesh & Shillong) in India showed that the populations
were no signiicant difference tuber production,
morphological and biochemical traits (Sujatha & Renuga, 2013). In other study, Hermansyah, AGRIVITA Journal of Agricultural Science. 2017. 39(3): 311-323
Cite this as: Rohandi, A., Budiadi, Hardiwinoto, S., Harmayani, E., & Sudrajat, D. J. (2017). Variability in
morpho-physiology, tuber yield and starch content of several arrowroot populations in Garut district. AGRIVITA Journal of Agricultural Science, 39(3), 311–323. http://doi.org/10.17503/agrivita.v39i3.1002
Murniyanto, & Badami (2009), Djaafar, Sarjiman, & Pustaka (2010), and Suhartini & Hadiatmi (2011) reported that environmental factors such as soil fertility (nitrogen content) and annual rainfall affected tuber yield of arrowroot.
On the other hand, tuber yield and starch content have multi component characters greatly
inluenced by some agro-climate conditions
(Sastra, 2003) and also affected by genetic systems. Distribution of genotype and morpho-physiological characteristics of arrowroot are not well documented, whereas the characteristics contribute to tuber yield and starch content. Genetic diversity within and among popu lations is important
for improving the speciic potential characters and
reveals a substantial factor of adaptive abilities of popula tions; also, it is best indicated for the knowl-edge of extent of variation available within the species (Subramanian et al., 1992). Information of the variations is required for collection of planting materials to develop the high productivity of arrowroot. Identifying the component variations (heritable and non-heritable), genetic association and relationships among characters (Singh & Chaudhary, 1985; Kahrizi & Mohammadi, 2009; Maniee, Kahrizi, & Mohammadi, 2009) and also can
help the breeder to ind the superior arrowroot plant.
The purpose of the study was to assess the variation of morpho-physiological characteristics, tuber yield and starch content and association among morpho-physiological characteristics and among agro-climate variables of arrowroot in Garut District. According to Sukesi (2013), Garut District is a suitable region for tuber crops cultivations in West Java and also this is related to the history of Garut District and local name of arrowroot, known as garut, so arrowroot could be a potential and superior tuber crop in Garut District (Garut District Goverment, 2012). Although arrowroot is grown to a very large limited extent in Garut District, very little information has been gathered concerning this crop’s morphological traits, tuber yield and starch content.
MATERIALS AND METHODS Samples Collection
Arrowroot exploration activities were conducted in Garut District, West Java Province from January – September 2014. Snowball samplings through direct survey and observation based on information obtained from local people were carried
out to ind the arrowroot populations. The exploration
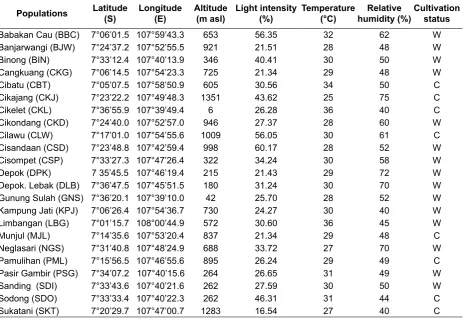
activity was inventoried and documented 23 populations of arrowroot. Site, habitat information, and cultivation status were recorded including its latitude-longitude, light intensity, temperature, and air humidity. Descriptions of the 23 sites are presented in Table 1. The samples of soil were dug up from 20 cm depth taken from each plant sample. The soil samples were bulked for each population to obtain the composite soil sample. Soil texture, pH, nutrients content, base saturation and cation exchange capacity were analyzed at Soil Laboratory, Faculty of Agriculture, Jenderal Sudirman University.
Morpho-physiological Data
The data of 5 plants were recorded for morphological and physiological characteristics including total height, leaf number, leaf area, stomatal density, stomatal width, stomatal length, chlorophyll A, chlorophyll B, total chlorophyll, tuber production per plant, tuber length, tuber diameter, tuber biomass, harvest index and starch content, recorded at the end of 8 months. Stomatal density was observed by a nail polish impression of the abaxial surface of the
irst fully developed leaf harvested at the end of the
treatments and measured under a light microscope
in three random ields per leaf at ×40 magniication.
The concentrations of chlorophyll were measured from a leaf at the second pair from the apices (Lichtenthaler, 1987) using a spectrophotometer (UV-1201, Shimadzu Corporation, Japan). For biomass measurements, all plants were harvested and divided into roots, stems, leaves and tuber. Roots, stems, leaves and tuber were dried separately in a drying oven at 70 °C for 48 h and weighed to ±0.0001 g. Leaves and stems were aggregated and are subsequently referred to as above-ground biomass. Total biomass was obtained from counting up of above-ground, root, and tuber biomass.
Tuber Yield and Starch Content
Statistical Analysis
A complete rand omized design using SPSS (version 21) was used for analysis of variance and Duncan multiple range test to determine the differences of morpho-physiological characteristics, tuber yield and starch content among populations. Simple correlations (Pearson) at 5 % level
of signiicance were calculated for
morpho-physiological characteristics, tuber yield and starch content with agro-climate fac tors (altitude, temperature, relative humidity, plant spacing, cultivation status, and soil fertility).
Genotypic (GV), phenotypic (PV), environmental variances (EV), phenotypic (PVC), genotypic (GVC)
and environmental coeficients of variation (ECV) were
calculated using the following equations according to Burton (1951).
GV = (Mt–Me)/r; PV = GV + Me; EV = Me
PCV% = √PV/x ×100; GCV% = √GV/x ×100; ECV% = √EV/x ×100
where: Mt = mean square for treatments, Me = mean error variance, and r = number of replicates, x = population mean for each trait.
Heritability in broad sense (H2B) is the ratio of genetic variance to the total phenotypic variance (Allard, 1999). Genetic advance (GA) is the expected increase in the magnitude of a particular character when a selection pressure of chosen intensity (i) is applied.
GA = GV/ PV × i × √PV
where: i = selection intensity (2.06)
Genetic gain (GG) was calculated in percentage of mean using the formula according to Johnson, Robinson, & Comstock (1955). Bi-plot analysis was used to identify the performance and to cluster the arrowroot populations based on plant height, fresh tuber yield, tuber biomass, and starch content using SPSS (v21) for categorical principle component analysis.
Populations Latitude
(S)
Longitude (E)
Altitude (m asl)
Light intensity (%)
Temperature (°C)
Relative humidity (%)
Cultivation status Babakan Cau (BBC) 7°06’01.5 107°59’43.3 653 56.35 32 62 W Banjarwangi (BJW) 7°24’37.2 107°52’55.5 921 21.51 28 48 W
Binong (BIN) 7°33’12.4 107°40’13.9 346 40.41 30 50 W
Cangkuang (CKG) 7°06’14.5 107°54’23.3 725 21.34 29 48 W
Cibatu (CBT) 7°05’07.5 107°58’50.9 605 30.56 34 50 C
Cikajang (CKJ) 7°23’22.2 107°49’48.3 1351 43.62 25 75 C
Cikelet (CKL) 7°36’55.9 107°39’49.4 6 26.28 36 40 C
Cikondang (CKD) 7°24’40.0 107°52’57.0 946 27.37 28 60 W
Cilawu (CLW) 7°17’01.0 107°54’55.6 1009 56.05 30 61 C
Cisandaan (CSD) 7°23’48.8 107°42’59.4 998 60.17 28 52 W
Cisompet (CSP) 7°33’27.3 107°47’26.4 322 34.24 30 58 W
Depok (DPK) 7 35’45.5 107°46’19.4 215 21.43 29 72 W
Depok. Lebak (DLB) 7°36’47.5 107°45’51.5 180 31.24 30 70 W Gunung Sulah (GNS) 7°36’20.1 107°39’10.0 42 25.70 28 52 W Kampung Jati (KPJ) 7°06’26.4 107°54’36.7 730 24.27 30 40 W
Limbangan (LBG) 7°01’15.7 108°00’44.9 572 30.60 36 45 W
Munjul (MJL) 7°14’35.6 107°53’20.4 837 21.34 29 48 C
Neglasari (NGS) 7°31’40.8 107°48’24.9 688 33.72 27 70 W
Pamulihan (PML) 7°15’56.5 107°46’55.6 895 26.24 29 49 C
Pasir Gambir (PSG) 7°34’07.2 107°40’15.6 264 26.65 31 49 W
Sanding (SDI) 7°33’43.6 107°40’21.6 262 27.59 30 50 W
Sodong (SDO) 7°33’33.4 107°40’22.3 262 46.31 31 44 C
Sukatani (SKT) 7°20’29.7 107°47’00.7 1283 16.54 27 40 C
Table 1. Background information of the 23 populations
Remarks: W = wild population, C = cultivated population
RESULTS AND DISCUSSION
Morpho-physiological Traits, Tuber Yield and Starch Content
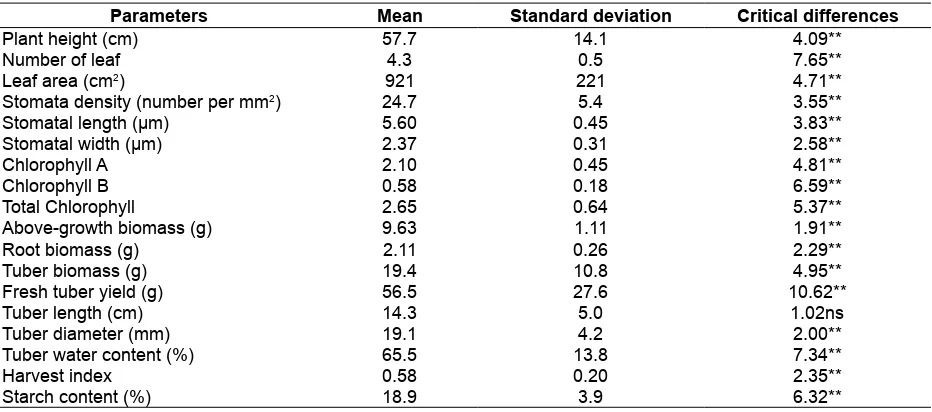
Analysis of variance showed presence of considerable variability among all arrowroot
populations which was highly signiicant, except for tuber length (Table 2). The signiicant differences for
most of the morpho-physiological characteristics, tuber yield and starch content indicated the existence of genetic variability among populations. Growth parameters indicated that the Cilawu population showed highest values for seven characters: high growth, number of leaf, above growth biomass (leaf and stem biomass), and tuber biomass. On the other hand, Babakan Cau population showed the lowest growth performance for seven characteristics: high growth, chlorophyll A, chlorophyll B, total chlorophyll, above growth biomass, root biomass and tuber biomass.
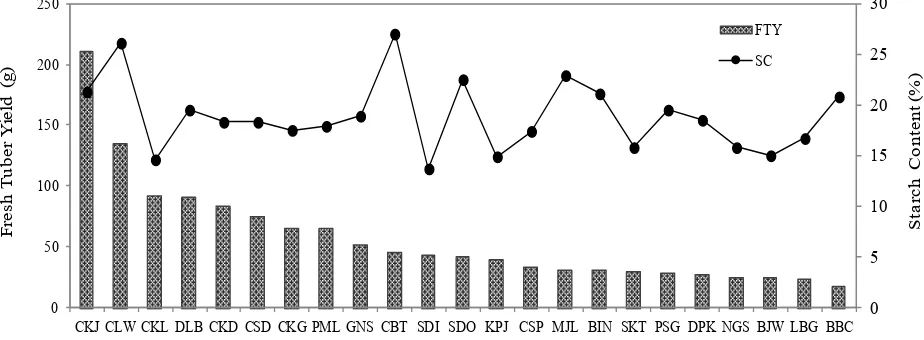
Variability studies for fresh tuber yield revealed that Cikajang population (210.6 g per plant) recorded high values followed by Cilawu population (134 g per plant). Cilawu population was a second population producing the highest starch content (26.1 %) after Cibatu population (27 %). On the other hand, Babakan Cau population followed by Limbangan, Banjarwangi, Neglasari, and Depok
populations, exhibited lowest for tuber yield, while for starch content, Sanding population has the lowest content (Fig. 1). Other research reported the arrowroot starch content such as Sujatha & Renuga (2013) in Kanyakumari district of Tamil Nadu, India (17.20-18.86 %), Valencia, Moraes, Lourenço, Habitante, & do Amaral Sobra (2014) in Palmira, Colombia (17.2-18.9 %), and Faridah, Fardiaz, Andarwulan, & Sunarti (2014) in Bogor, Indonesia (15.69-20.96 %). Some populations in this research showed higher starch content than above references with the starch content of more than 25 %, such as Cibatu and Cilawu populations.
Morpho-physiological, tuber yield and starch content characters are interdependent, and all parameters are controlled by genetic and environmental factors. This suggests a combined control of genotype and environmental, such us climate and soil. Environmental factors may cause variation in plant characteristics. Plants required optimum environmental conditions to grow and produce maximum tuber yields viz. soil type and contents, water availability, altitude, climate, air temperature, humidity, light intensity, etc. (Sitompul & Guritno, 1995). Same plant species will show various morphology if environmental factor is more dominant in affecting plant than of the genetic factors and vice versa (Suranto, 1991).
Table 2. Variability estimates for morpho-physiological characteristics, tuber yield and starch content
Parameters Mean Standard deviation Critical differences
Plant height (cm) 57.7 14.1 4.09**
Number of leaf 4.3 0.5 7.65**
Leaf area (cm2) 921 221 4.71**
Stomata density (number per mm2) 24.7 5.4 3.55**
Stomatal length (µm) 5.60 0.45 3.83**
Stomatal width (µm) 2.37 0.31 2.58**
Chlorophyll A 2.10 0.45 4.81**
Chlorophyll B 0.58 0.18 6.59**
Total Chlorophyll 2.65 0.64 5.37**
Above-growth biomass (g) 9.63 1.11 1.91**
Root biomass (g) 2.11 0.26 2.29**
Tuber biomass (g) 19.4 10.8 4.95**
Fresh tuber yield (g) 56.5 27.6 10.62**
Tuber length (cm) 14.3 5.0 1.02ns
Tuber diameter (mm) 19.1 4.2 2.00**
Tuber water content (%) 65.5 13.8 7.34**
Harvest index 0.58 0.20 2.35**
Starch content (%) 18.9 3.9 6.32**
Remarks: **= very signiicant at 99 % conident level, ns= not signiicant at 95 % conident level
Variance, Coeficient of Variability
In present investigation, phenotypic and
genotypic coeficient of variations are the highest
for fresh tuber production (12.89 and 13.54, respectively) and tuber biomass (12.10 and 13.54, respectively), while the maximum environmental
coeficient of variation was associated with
aboveground biomass (8.65). The lowest
phenotypic and genotypic coeficient of variations was identiied on tuber length, and the highest environmental coeficient of variation was recorded for stomatal length. Genotypic coeficient of variation
for all morpho-physiological characteristics, tuber yield and starch content were found higher than
environmental coeficient of variations and only
two characters (tuber length and root biomass)
were more inluenced by environmental variations
(Table 3). Similar trend was obtained in growth, physiological and biochemical parameters of Pinus wallichiana (Rawat & Bakshi, 2011) and Anthocephalus cadamba (Sudrajat, 2016). In this study, the most phenotypic and genotypic
coeficients of variations was close to each other
indicating that the genotypic components had higher contributor to the total variance than environment factors. Although the research location range was relatively narrow, the magnitude variation was observed almost in all characters. This indicates that variation in characteristics of arrowroot also
occures in a narrow range and speciies the good
scope in improvement on this species.
Higher heritability was reported for fresh tuber production per plant (FTP, 0.90) followed by tuber water content (TWC, 0.86), number of leaf (NL, 0.86), chlorophyll B (CLB, 0.84), and starch content (SC, 0.84) while the lower heritability was revealed by root biomass (0.47) followed by tuber length (0.02). Genetic gain ranged between 0.18 % (for tuber length) and 25.27 % (for fresh tuber yield). Some parameters such as number of leaf, chlorophyll B, total chlorophyll, tuber water content, and starch content revealed the high heritability values (>0.80). Heritability estimation can be used as a gross indicator for selection of one or more characteristics (Namkoong, Synder, & Stonecypher, 1966; Sudrajat, 2016). Although the parameters had good values of heritability, but for genotypic
coeficient variation and genetic gain, the parameters
had the lower values (Table 3). The lower values
of genotypic coeficient variation and genetic gain
indicated that the existence of non-additive genetic effects is higher than additive genetic effects. The total phenotypic variance (Vp) of each characteristic separated into a heritable (Vg) can be used to select for superior characters.
Heritability values along with genetic gain which is more essential than the heritability along to measure the resultant effect for selecting the best genotype. High heritability values associated with high genetic gain were revealed by fresh tuber yield. Conversely, high heritability values associated with low genetic gain were showed by number of leaf,
0
CKJ CLW CKL DLB CKD CSD CKG PML GNS CBT SDI SDO KPJ CSP MJL BIN SKT PSG DPK NGS BJW LBG BBC
S
Fig. 1. Fresh tuber yield and starch content of 23 populations of arrowroot
chlorophyll B, total chlorophyll, tuber water content and starch content. This result indicated that non-additive genetic was more affected than non-additive components. Higher heritability, genetic gain and
signiicant correlation indicated that selection on
basis of these morpho-physiological characters may be helpful to improve arrowroot yield (Ali et al., 2014).
Correlation Matrix and Population Grouping
Simple correlation coeficient is a useful
method to study the interrelationships among growth, tuber yield and starch content characters. Correlation matrix among morphological characteristics (Table
4) showed signiicant correla tion among growth
characteristics with other important characters like plant height which is correlated with above-ground biomass (0.79) and root biomass (0.63). Number of leaf is positively correlated with leaf area (0.65) and root biomass (0.63). A negative correlation of
leaf area also occurred with tuber diameter (-0.48).
Signiicant correlation of stomatal density occurred
with tuber water content (0.73). A strong correlation was observed among chlorophyll and among tuber morphological characteristics reveal ing thus that these traits were independent and genetically controlled (Rawat & Bakshi, 2011). Other positive correlations were showed by fresh tuber yield per plant with tuber diameter (0.68) and tuber biomass (0.79); harvest index with tuber diameter (0.57) and tuber biomass (0.64); and root biomass with starch content (0.48). In some studies, tuber yield and starch content were complex characters associated with some growth traits (Zemba, Wuyep, Adebayo, & Jahknwa, 2013), but this research result showed that most of the growth traits had no
signiicant correlation. This result indicated that the
growth characteristics were not a good indicator for selecting the higher tuber production and starch content.
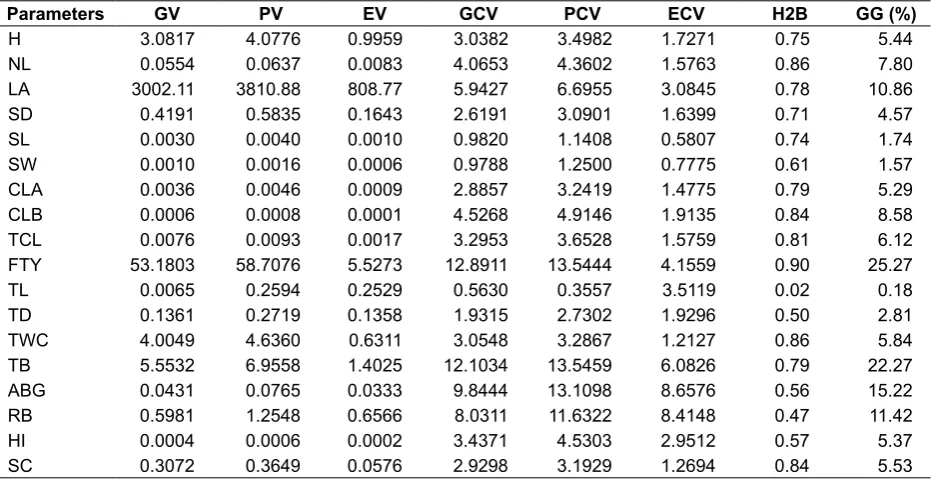
Table 3. Genotypic variance (GV), phenotypic variance (PV), environment variance (EC), genotypic
coeficient of variability (GCV), phenotypic coeficient of variability (PCV), environment coeficient
of variability (ECV), heritability (H2B) and genetic advance in percentage of mean (GG) for different characters of 23 populations of arrowroot
Parameters GV PV EV GCV PCV ECV H2B GG (%)
H 3.0817 4.0776 0.9959 3.0382 3.4982 1.7271 0.75 5.44
NL 0.0554 0.0637 0.0083 4.0653 4.3602 1.5763 0.86 7.80
LA 3002.11 3810.88 808.77 5.9427 6.6955 3.0845 0.78 10.86
SD 0.4191 0.5835 0.1643 2.6191 3.0901 1.6399 0.71 4.57
SL 0.0030 0.0040 0.0010 0.9820 1.1408 0.5807 0.74 1.74
SW 0.0010 0.0016 0.0006 0.9788 1.2500 0.7775 0.61 1.57
CLA 0.0036 0.0046 0.0009 2.8857 3.2419 1.4775 0.79 5.29
CLB 0.0006 0.0008 0.0001 4.5268 4.9146 1.9135 0.84 8.58
TCL 0.0076 0.0093 0.0017 3.2953 3.6528 1.5759 0.81 6.12
FTY 53.1803 58.7076 5.5273 12.8911 13.5444 4.1559 0.90 25.27
TL 0.0065 0.2594 0.2529 0.5630 0.3557 3.5119 0.02 0.18
TD 0.1361 0.2719 0.1358 1.9315 2.7302 1.9296 0.50 2.81
TWC 4.0049 4.6360 0.6311 3.0548 3.2867 1.2127 0.86 5.84
TB 5.5532 6.9558 1.4025 12.1034 13.5459 6.0826 0.79 22.27
ABG 0.0431 0.0765 0.0333 9.8444 13.1098 8.6576 0.56 15.22
RB 0.5981 1.2548 0.6566 8.0311 11.6322 8.4148 0.47 11.42
HI 0.0004 0.0006 0.0002 3.4371 4.5303 2.9512 0.57 5.37
SC 0.3072 0.3649 0.0576 2.9298 3.1929 1.2694 0.84 5.53
Remarks: H = plant height, NL = number of leaf, LA = leaf area, SD = stomatal density, SL = stomatal length, SW = stomatal width, CLA = chlorophyll A, CLB = chlorophyll B, TCL = total chlorophyll, AGB = above growth biomass, RB = root biomass, TB = tuber biomass, FTY = fresh tuber yield per plant, TL = tuber length, TD = tuber diameter, TWC = tuber water content, HI = harvest index, SC = starch content
H NL LA SD SL SW CLA CLB TCL FTP TL TD TWC TB AGB RB HI
NL 0.38
LA 0.12 0.65**
SD -0.23 -0.38 0.01
SL -0.04 -0.06 0.17 0.36
SW -0.04 -0.19 -0.07 0.41 -0.01
CLA -0.03 0.01 -0.24 -0.31 -0.33 -0.08
CLB 0.01 0.01 -0.18 -0.26 -0.36 -0.09 0.98**
TCL -0.02 -0.14 -0.38 -0.25 -0.30 -0.14 0.96** 0.95**
FTP 0.31 0.10 -0.14 0.28 -0.09 -0.06 0.28 0.28 0.32
TL -0.19 0.18 0.30 0.31 0.17 -0.20 -0.08 -0.03 -0.07 0.38
TD -0.17 -0.21 -0.48* 0.31 0.16 0.04 0.19 0.10 0.28 0.68** 0.46
TWC -0.28 -0.36 -0.01 0.73** 0.11 0.39 0.17 0.22 0.15 0.16 0.18 0.12
TB 0.42 0.35 -0.07 -0.15 -0.13 -0.25 0.10 0.08 0.15 0.79** 0.26 0.54* -0.44
AGB 0.79** 0.35 0.20 0.15 -0.13 -0.15 -0.10 0.01 -0.10 0.33 0.17 -0.02 0.16 0.26
RB 0.63** 0.63** 0.45 -0.22 0.01 0.04 0.19 0.21 0.06 0.29 0.06 -0.18 -0.09 0.28 -0.46
HI -0.26 -0.07 -0.23 -0.11 -0.03 -0.39 0.09 0.01 0.19 0.41 0.23 0.57* -0.46 0.64** 0.24 -0.33
SC 0.40 0.44 0.38 -0.24 -0.17 -0.39 -0.01 0.05 0.01 0.23 0.27 -0.23 -0.36 0.40 0.44 0.48* 0.13
Remarks: See Table 3 for parameter information
et al.:
Arrowroot Morphophysiological
V
ariability
...
...
Table 5. Simple correlation coeficients between seed characteristics and geographic variation
H NL LA SD SL SW CLA CLB TCL AGB RB TB FTY TL TD TWC HI SC
Alt 0.35 0.12 -0.33 -0.22 -0.36 -0.12 0.43 0.43 0.48* 0.22 0.28 0.30 0.43 -0.18 0.16 0.07 -0.03 0.20
Tem -0.35 -0.19 -0.10 -0.29 0.01 0.00 0.01 -0.03 0.01 -0.33 -0.32 -0.03 -0.29 0.08 0.06 -0.35 0.29 -0.15
RH 0.16 0.39 0.48* 0.23 -0.20 0.16 0.07 0.08 -0.04 0.36 0.18 0.26 0.43 -0.04 -0.11 0.25 -0.00 0.23
LI 0.42 0.22 0.32 -0.12 0.08 -0.14 0.09 0.11 0.16 0.37 0.17 0.52* 0.35 0.03 -0.06 -0.32 0.30 0.65**
PS 0.25 0.42 0.26 0.03 -0.03 0.03 -0.31 -0.29 -0.26 0.14 0.43 0.70** 0.43 0.29 0.25 -0.38 0.38 0.45
CS 0.24 0.12 -0.25 -0.36 -0.30 -0.20 0.52* 0.51* 0.57* 0.34 0.02 0.41 0.47* 0.32 0.33 -0.22 0.27 0.40
Sand 0.11 -0.36 -0.36 0.09 -0.20 0.17 -0.14 -0.15 -0.06 0.09 0.03 0.14 0.27 0.20 0.35 0.02 0.08 0.13
Dust 0.19 -0.01 0.15 0.19 0.32 0.25 0.12 0.14 0.05 0.19 -0.01 -0.45 -0.27 -0.32 -0.34 0.34 -0.50* -0.36
Clay -0.25 0.43 0.30 -0.23 0.01 -0.36 0.08 0.08 0.04 -0.24 -0.02 0.16 -0.12 -0.01 -0.16 -0.27 0.26 0.09
pH -0.03 -0.35 -0.36 -0.12 -0.08 -0.00 -0.22 -0.26 -0.17 -.052 -0.20 0.07 0.01 -0.08 0.09 -0.22 0.14 0.24
C 0.43 0.04 -0.31 -0.42 -0.43 -0.29 0.40 0.47 0.37 0.26 -0.07 0.40 0.37 -0.34 0.06 -0.28 0.30 0.26
N 0.55* 0.05 -0.36 -0.31 -0.43 -0.15 0.36 0.35 0.43 0.32 0.16 0.34 0.38 -0.34 0.10 -0.17 0.08 0.15
CN -0.51* -0.02 0.20 -0.05 0.32 -0.06 0.12 0.07 0.05 -0.21 -0.57 -0.12 -0.25 0.22 0.02 -0.08 0.29 -0.12
P 0.42 -0.20 0.15 0.18 0.24 0.15 -0.47 -0.41 -0.42 0.10 0.38 -0.18 -0.16 0.00 -0.29 0.08 -0.43 -0.08
Ca -0.02 -0.46 -0.35 0.18 -0.17 0.43 -0.19 -0.18 -0.13 -0.15 0.16 -0.16 -0.05 -0.28 0.06 0.16 -0.20 -0.15
Mg -0.10 -0.25 -0.29 0.09 -0.20 0.23 -0.09 -0.10 -0.05 -0.16 0.16 0.01 0.12 -0.20 0.21 0.10 -0.01 -0.15
K -0.18 -0.37 -0.05 0.37 0.09 0.59* -0.29 -0.26 -0.23 -0.27 0.08 -0.11 -0.13 0.09 0.16 0.11 -0.01 -0.26
Na 0.05 0.26 0.40 -0.04 0.25 0.01 -0.08 -0.03 -0.11 0.00 0.13 -0.06 -0.28 0.03 -0.31 -0.11 -0.13 0.03
CEC -0.09 0.49* -0.22 0.40 -0.08 0.42 0.08 0.19 0.16 -0.23 0.38 -0.42 -0.15 -0.01 -0.04 0.36 -0.49* -0.26
BS -0.02 -0.24 -0.35 -0.05 -0.28 0.15 -0.17 -0.21 -0.13 -0.12 0.04 0.16 0.14 -0.19 0.22 -0.13 0.14 -0.01
Remarks: Alt = altitude, Tem = temperature, RH = relative humidity, LI = light intensity, PS = plant spacing, CS = cultivation status, Sand = soil texture, Dust = soil texture, Clay = soil texture, pH = soil acidity, C = carbon, N = nitrogen, CN = ratio of carbon nitrogen, P = phosphor, Ca = calcium, Mg = magnesium, K = potassium, Na = natrium, CEC = capacity of cation exchange, BS = base saturation. See Table 3 for plant parameter information
Asep Rohandi
et al.:
Arrowroot Morphophysiological
V
ariability
...
...
Morpho-physiological characterization data availability in the relation with different agro-climate of arrowroot is still very limited. A positive correlation between altitude and total chlorophyll (0.48) suggested that total chlorophyll increased
within higher altitude. Signiicant correla tion was also
found between relative humidity and leaf area (0.48) depicted that sites which had a relatively higher humidity tended to show greater leaf area. Light intensity was correlated with tuber biomass (0.52) and starch content (0.65) (Table 5). In the tree stand shaded condition, active sun light for photosynthesis process (wave length 400-700 nm) decreases
inluencing tuber development such as biomass
and starch content. Similar result reported by Djukri (2006) that stated tuber biomass had a correlation with shading condition or light intensity. Plant spacing
was also signiicantly correlated with tuber biomass
(0.70) (Table 5). This revealed the larger space among arrowroot plant, the higher biomass in the tuber. Cultivation status (cultivated or wild crop) was correlated with chlorophyll content and fresh tuber yield. Chlorophyll was utilized as the light‐trapping and energy transferring chromophore in photosynthetic plants (Anjum et al., 2011). Cultivated plants tended to have higher chlorophyll content and tuber yield than wild plants. The decrease of chlorophyll contents
in hard shaded plant is considered a main cause of decrease of photosynthesis (Lambers, Stuart Chapin III, & Pons, 1998). Low chlorophyll concentrations directly affected to limit the photosynthetic potential and hence primary growth and production in storage tissue such as tuber (Zamski & Schaffer, 1996) caused a decrease of fresh tuber yield (Sastra, 2002).
Most of soil texture variables, except dust
content did not show any signiicant correlation with
morphological, tuber yield and starch content of arrowroot. Dust content showed positive correlation (0.422) with harvest index while other pa rameters
revealed a non-signiicant correlation. Plant height
was positive correlated with plant height (0.55) and negative correlated with ratio carbon-nitrogen (-0.51). Nitrogen (N) is typically the most limiting
factor for plant growth and crop yield. Deiciency of
nitrogen will decrease tuber yield by affecting the tuber production (Vaezzadeh & Naderidarbaghshahi,
2012). Signiicant correlation was also observed
between potassium (K) and stomatal width (0.59). Potassium was recognized as a role in the opening of stomata aperture pores (Talbott & Zeiger, 1996).
Other signiicant correlation was observed between
cation exchange capacity and number of leaf, tuber water content and harvest index.
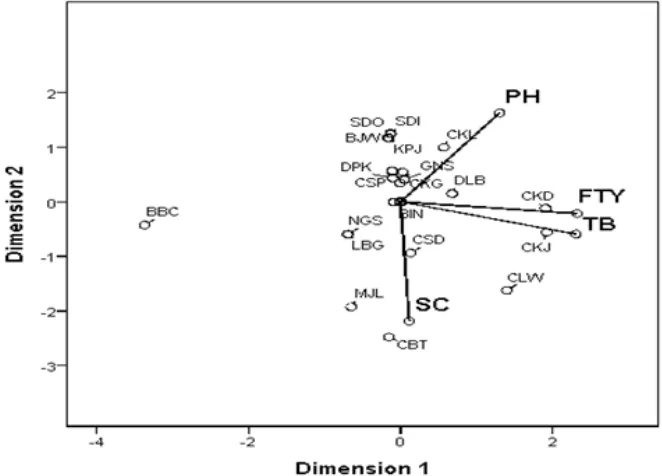
Fig. 2. Biplot of 23 arrowroot populations based on plant height (PH), fresh tuber yield (FTY), tuber biomass (TB), and starch content (SC)
Tuber yield, starch content and tuber biomass are the prominent characters in the crop improvement program to maximize the cultivation output (Mariscal, Bergantin, & Troyo, 2002). The arrowroot plant produced the high yield tuber with high starch content for use in the starch industries is a purpose of the improvement program. Fresh tuber yield (FTY) and tuber biomass (TB) formed a sharp angle, indicated that the pair of parameters has a positive correlation. (Fig 2.). In other words, a higher tuber yield results higher tuber biomass. A negative correlation is shown by the pair of plant height (PH) and starch content (SC) which forms an obtuse angle. Bi-plot analysis separated the arrowroot
populations in Garut District into ive groups. BBC population formed the irst group laid far away from
the parameters of plant height, fresh tuber yield, tuber biomass, and starch content, indicated that these populations did not have the superiority on those parameters. Several populations, such as Sanding, Sodong, Banjarwangi, Cikelet, Kampung Jati, Gunung Sulah, Cisompet, Depok Lama, Cangkuang, Binong, Neglasari, Limbangan, and Cisandaan populations form the second group. They are laid around the coordinate center, indicating that these populations have the value of parameters in the vicinity of the average.
Cibatu and Munjul populations are the third group associated with starch content parameter, indicating that these populations have the higher value of starch content. Some populations are superior in fresh tuber yield and tuber biomass, i.e. Cikondang and Cikajang populations formed the fourth group. The last group is Cilawu population revealed the superior population for production of higher starch content and tuber biomass. Thus in general these three populations (Cilawu, Cikajang, and Cibatu) exhibit better characteristic than the others. In other words, these populations produce tuber of high quality and quantity.
CONCLUSION
Arrowroot populations in Garut District showed the diversity in morpho-physiological characteristics, tuber yield and starch content revealed that transfer of plant material still occurs in local sites and the cultivation is not well developed. Growth parameters of arrowroot from Cilawu population had the highest values for seven characters, i.e. high growth, number of leaf, above growth biomass (leaf and stem biomass), and tuber
biomass. Cikajang population recorded highest tuber yield followed by Cilawu population. Cibatu population produces the highest starch content followed by Cilawu population. The high heritability in a broad sense associated with high genetic advance was observed on fresh tuber yield indicated that selection on basis of these characters may be helpful to improve arrowroot tuber yield. Most
of the growth traits had no signiicant correlation
and indicated that the growth characteristics were not a good indicator for selecting the higher tuber production and starch content. Three populations (Cilawu, Cikajang, and Cibatu) have better tuber yield characteristics than the others to produce of high quality and quantity of arrowroot tuber.
ACKNOWLEDGEMENT
The authors would like to gratefully acknowledge Agroforestry Research and Development Institute of Ciamis for funding this study. Sincere thanks are also dedicated to Budi Rahmawan, Gunawan and Kurniawan as members of arrowroot exploration team.
REFERENCES
Ali, Q., Ali, A., Waseem, M., Muzaffar, A., Ahmed, S., Ali, S., .... Husnain, T. (2014). Correlation analysis for morpho-physiological traits of maize (Zea mays L.). Life Science Journal, 11(12), 9-13. Retrieved from https://www. researchgate.net/publication/281085434_ Correlation_analysis_for_ morpho-physiolo gical traits_of_maize_Zea_mays_L
Allard, R. W. (1999). History of plant population genetics. Annual Review of Genetics, 33(1), 1–27. http://doi.org/10.1146/annurev. genet.33.1.1
Anjum, S. A., Xie, X.-Y., Wang, L.-C., Saleem, M. F., Man, C., & Lei, W. (2011). Morphological, physiological and biochemical responses of plants to drought stress. African Journal of Agricultural Research, 6(9), 2026–2032. http://doi.org/10.5897/AJAR10.027
Burton, G. W. (1951). Quantitative Inheritance in pearl millet (Pennisetum glaucum). Agronomy Journal, 43, 409-417. Retrieved
from http://www.garield.library.upenn.edu/
classics986/A1986 AZA3700001.pdf
1007-1012. Retrieved from http://www. ejournalofscience.org/archive/vol2no10/vol 2no10_17.pdf
Djaafar, T. F., Sarjiman, & Pustaka, A. B. (2010). Pengembangan budi daya tanaman garut dan teknologi pengolahannya untuk mendukung ketahanan pangan [Development of arrow root and its processing technology to support food security]. Jurnal Litbang Pertanian, 29(1), 25-33. Retrieved from http:// jateng.litbang.pertanian.go.id/ind/images/ artikel/publikasipenelitipenyuluh/artikel/ titikbudidayagarut.pdf?secure=true
Djukri. (2006). Karakter tanaman dan produksi umbi talas sebagai tanaman sela di bawah tegakan karet [The plant characters and corm production of taro as catch crop under the young rubber stands]. Biodiversitas Journal of Biological Diversity, 7(3), 256-259. http://doi.org/10.13057/biodiv/d070312 Erdman, M. D., & Erdman, B. A. (1984). Arrowroot
(Maranta arundinacea), food, feed, fuel,
and iber resource. Economic Botany, 38(3), 332–341. http://doi.org/10.1007/BF0 2859011
Faridah, D. N., Fardiaz, D., Andarwulan, N., & Sunarti,
T. C. (2014). Karakteristik sifat isikokimia
pati garut (Maranta arundinaceae) [Physicochemical Characterisation of arrowroot (Maranta arundinaceae) starch]. Agritech, 34(1), 14-21. Retrieved from https:// jurnal.ugm.ac.id/agritech/article/view /9517 Garut District Goverment. (2012). Sejarah singkat
Kabupaten Garut [Brief history of Garut District]. Retrieved from http://www. garutkab.go.id/pub/static_menu/detail/seki las_sejarah
Hermansyah, Murniyanto, E., & Badami, K. (2009). Karakteristik agroekologi garut (Marantha arundinaceae L.) pulau Madura [Agro-ecological Characteristics of arrowroot (Marantha arundinaceae L.) in Madura island]. Agrovigor, 2(2), 59-66. Retrieved from http://journal.trunojoyo.ac.id/ agrovigor /article/view/244
Heyne, K. (1987). Tumbuhan berguna Indonesia [Indonesia useful plants]. Jakarta, ID: Badan Libang Kehutanan.
Ikpi, A. E., Gebremeskel, T. H., Ezumah, N. D., & Ekpere, J. A. (1986). Cassava - a crop for household food security: A 1986 situation analysis for Oyo local government area – Nigeria. Ibadan, Nigeria: International Institute of Tropical Agriculture.
Johnson, H. W., Robinson, H. F., & Comstock, R. E. (1955). Estimates of genetic and environmental variability in soybeans. Agronomy Journal, 47(7), 314–318. http:// doi.org/10.2134/agronj1955.00021962004 700070009x
Kahrizi, D., & Mohammadi, R. (2009). Study of androgenesis and spontaneous chromosome doubling in barley (Hordeum vulgare L.) genotypes using isolated microspore culture. Acta Agronomica Hungarica, 57(2), 155–164. http://doi.org/1 0.1556/AAgr.57.2009.2.7
Lambers, H., Stuart Chapin III, F., & Pons, T. L. (1998). Plant physiological ecology. New York: Springer-Verlag. http://doi.org/10.100 7/978-1-4757-2855-2
Lichtenthaler, H. K. (1987). Chlorophylls and carotenoids: Pigments of photosynthetic biomembranes. Methods in Enzymology, 148, 350–382. http://doi.org/10.1016/0076-6879(87)48036-1
Maniee, M., Kahrizi, D., & Mohammadi, R. (2009). Genetic variability of some morpho-physiological traits in durum wheat (Triticum turgidum var. Durum). Journal of Applied Sciences, 9(7), 1383-1387. http://doi.org/1 0.3923/jas.2009.1383.1387
Mariscal, A. M., Bergantin, R. V., & Troyo, A. D. (2002). Cassava breeding and varietal release in the philippines. In R. H. Howeler (Ed.), Cassava research and development in Asia: Exploring new opportunities for an ancient crop (pp. 108-117). Paper presented at Proceedings of the Seventh Regional Workshop Held in Bangkok, Thailand, October 28-November 1. Retrieved from http://ciat-library.ciat.cgiar.org/articulos_ciat/ asia/proceedings_workshop_02/108.pdf Namkoong, G., Synder, E. B., & Stonecypher, R. W.
Nishaa, S., Vishnupriya, M., Sasikumar, J. M., Christabel, H. P., & Gopalakrishnan, V. K. (2012). Antioxidant activity of ethanolic extract of Maranta arundinacea L. tuberous rhizomes. Asian Journal of Pharmaceutical and Clinical Research, 5(4), 85–88. Retrieved from http://www.ajpcr.com/Vol5Is sue4/1256.pdf
Odeku, O. A. (2013). Potentials of tropical starches as pharmaceutical excipients: A review. Starch, 65(1–2), 89–106. http://doi.org/10. 1002/star.201200076
Rawat, K., & Bakshi, M. (2011). Provenance variation in cone, seed and seedling characteristics in natural populations of Pinus wallichiana A.B. Jacks (Blue Pine) in India. Annals of Forest Research, 54(1), 39-55. Retrieved from https://www.afrjournal.org/index.php/ afr/article/download/96/142
Sastra, D. R. (2002). Analisis keragaman genetik dan tanggap tanaman garut (Maranfa amndinacea L.) terhadap intensitas cahaya matahari [Genetic diversity analysis of arrowroot accessions (Maranta anrndinacea L.) and respons to sunlight intensity] (Doctoral dissertation). Retrieved from http://repository. ipb.ac.id/jspui/bitstream/123456789/573/7/ Cover%202002drs.pdfIPB
Sastra, D. R. (2003). Analisis keragaman genetik Maranta arundinacea L. berdasarkan penanda molekuler RAPD (Random
Ampliied Polymorphic DNA) [Analysis of
genetic variation of Maranta arundinacea
L. based on RAPD (Random Ampliied
Polymorphic DNA) molecular Marker]. Jurnal Sains dan Teknologi Indonesia, 5(5), 209-218.
Shintu, P. V., Radhakrishnan, V. V., & Mohanan, K. V. (2015). Pharmacognostic standardisation of Maranta arundinacea L. - An important ethnomedicine. Journal of Pharmacognosy and Phytochemistry, 4(3), 242–246. Retrieved from http://www.phytojournal.com/ archives/2015/vol4issue3/PartD/4-3-3 6.pdf Singh, R. K., & Chaudhary, B. D. (1985). Biometrical
methods in quantitative genetics analysis. New Delhi, India: Kalyani Publishers. Sitompul, S. M., & Guritno, B. (1995). Analisis
pertumbuhan tanaman [Analysis of plant
growth]. Yogyakarta, ID: Gadjah Mada University.
Subramanian, K. N., Bedell, P. E., Gurumurti, K., Geroge, M., Mandal, A. K., Pillai, S. R. M., & Singh, B. G. (1992). Casuarinas: trees of multiple utility. Dehradun, India: Indian Council of Forestry Research and Education. Sudarmadji, S., Haryono, B., & Suhardi. (1997).
Prosedur analisa untuk bahan makanan dan pertanian [Analysis procedure for food and agriculture products] (4th ed.). Yogyakarta, ID: Yogyakarta Liberty.
Sudrajat, D. J. (2016). Genetic variation of fruit, seed, and seedling characteristics among 11 populations of white jabon in Indonesia. Forest Science and Technology, 12(1), 9–15. http://doi.org/10.1080/21580103.201 5.1007896
Suhartini, T., & Hadiatmi. (2011). Keragaman karakter morfologis garut (Marantha arundinaceae L.) [Morphological characteristics variability of arrowroot (Marantha arundinaceae L.)]. Buletin Plasma Nuftah, 17(1), 12-18. http:// dx.doi.org/10.21082/blpn.v17n1.2011.p12-18 Sujatha, S., & Renuga, F. B. (2013). Medicinal and
edible tubers from fourty two settlements of Tribals from Pechiparai Social forest in Kanyakumari District, India. Scholars Academic Journal of Biosciences, 1(5), 213-216. Retrieved from http://saspublisher. com/wp-content/uploads/2013/10/SAJB-15213-216.pdf
Sukesi, H. (2013). Kajian rantai pasokan dan penganekaragaman konsumsi pangan berbasis produk umbi-umbian: Studi kasus Jawa Barat [Assessment of supply and diversity of food consumption based on tuber products]. Retrieved from http://
www.kemendag.go.id/iles/pdf/2013/04/25/-1366875381.pdf
Suranto. (1991). Studies of population variations in species of Ranunculus (Unpublished master theses). University of Tasmania. Talbott, L. D., & Zeiger, E. (1996). Central roles
for potassium and sucrose in guard-cell osmoregulation. Plant Physiology, 111(4), 1051–1057. Retrieved from https://www. ncbi.nlm.nih.gov/pmc/articles/ PMC160980/ pdf/1111051.pdf
Vaezzadeh, M., & Naderidarbaghshahi, M. (2012). The effect of various nitrogen fertilizer amounts on yield and nitrate accumulation in tubers of two potato cultivars in cold regions of Isfahan (Iran). International Journal of Agriculture and Crop Sciences, 4(22), 1688-1691. Retrieved from http://ijagcs.com/wp-content/uploads/2012/12/1688-1691.pdf Valencia, G. A., Moraes, I. C. F., Lourenço, R. V.,
Habitante, A. M. Q. B., & do Amaral Sobra, P. J. (2014). Maranta (Maranta arundinacea L) starch properties. Paper presented at Proceedings of the 2014 International Conference on Food Properties (ICFP2014) Kuala Lumpur, Malaysia, 24-26 January (pp. 1-6). Retrieved from https://www. researchgate.net/profile/German_Ayala_ Valencia/publication/269100485_Maranta_
Maranta_arundinacea_L_starch_properties/ links/5480526f0cf25b80dd70d6e3/Maranta-Maranta-arundinacea-L-starch-properties.pdf Zamski, E., & Schaffer, A. A. (1996). Photoassimilate
distribution in plants and crops: Source-sink relationships. New York, USA: Marcel Dekker, Inc.
Zemba, A. A., Wuyep, S. Z., Adebayo, A. A., & Jahknwa, C. J. (2013). Growth and yield response of irish potato (Solanum Tuberosum) to climate in Jos-South, Plateau State, Nigeria. Global Journal of Human Social Science Geography, Geo-Sciences, Environmental Disaster Management, 13(5) 1-6. Retrieved from https://globaljournals. org/GJHSS_Volume13/2-Growth-and-Yield-Response-of-Irish-Potato.pdf