C RC P R E S S
Boca Raton London New York Washington, D.C.
Stan ley T. Omaye
Food and
This book contains information obtained from authentic and highly regarded sources. Reprinted material is quoted with permission, and sources are indicated. A wide variety of references are listed. Reasonable efforts have been made to publish reliable data and information, but the author and the publisher cannot assume responsibility for the validity of all materials or for the consequences of their use.
Neither this book nor any part may be reproduced or transmitted in any form or by any means, electronic or mechanical, including photocopying, microfilming, and recording, or by any information storage or retrieval system, without prior permission in writing from the publisher.
The consent of CRC Press LLC does not extend to copying for general distribution, for promotion, for creating new works, or for resale. Specific permission must be obtained in writing from CRC Press LLC for such copying.
Direct all inquiries to CRC Press LLC, 2000 N.W. Corporate Blvd., Boca Raton, Florida 33431.
Trademark Notice: Product or corporate names may be trademarks or registered trademarks, and are used only for identification and explanation, without intent to infringe.
Visit the CRC Press Web site at www.crcpress.com © 2004 by CRC Press LLC
No claim to original U.S. Government works International Standard Book Number 1-58716-071-4
Library of Congress Card Number 2003065211 Printed in the United States of America 1 2 3 4 5 6 7 8 9 0
Printed on acid-free paper
Library of Congress Cataloging-in-Publication Data
Omaye, Stanley T.
Food and nutritional toxicology / Stanley T. Omaye. p. ; cm.
Includes bibliographical references and index. ISBN 1-58716-071-4
1. Food—Toxicology. I. Title.
[DNLM: 1. Food—adverse effects. 2. Food Additives—adverse effects. 3. Food Analysis—methods. 4. Food Contamination. 5. Food Hypersensitivity. 6. Food Poisoning. WA 701 O54f 2004]
RA1258.O46 2004
Preface
Food can be defined as the nutritive material taken into an organism for growth, work, or repair and for maintaining the vital processes. Food sustains life, and, as such, many individuals view food as an uncomplicated, pure source of nutrition. Therefore, such individuals are often bewildered to learn that food is comprised of an array of natural chemicals, and not all the chemicals are nutrients or enhance nutritive value, but in fact may decrease nutritional value or, worse still, are toxic (e.g., naturally occurring toxicants). Also, chemicals can be added to food, either intentionally or unintentionally, during production and processing. Cooking, storing, and preparing food in our kitchens create new components and different chemical compounds, which may have a toxic effect, an improvement or enhancement effect, or no effect at all on the meal quality.
Food and nutritional toxicology is the field devoted to studying the complexity of the chemicals in food, particularly those that have the potential of producing adverse health effects. One begins to appreciate the complexity of the field when one recognizes that food chemicals can interact with body fluids and other compo-nents of the diet and that such interactions may have a multitude of effects, beneficial or harmful. For example, the endogenous secretions of the stomach have the ability to inactivate or break down many chemicals; however, chemicals such as nitrate can be reduced to nitrite, which has the potential of reacting with proteins in the stomach to produce carcinogenic nitrosamines. This may be inconsequential if vitamin C or E is present in the stomach, because of its capacity to inhibit the nitrosation process. Thus, interactions between food components and other chemicals are complicated but have dire implications as regards health and adverse effects.
Overall, because of the diversity of the field, food and nutritional toxicology spans a number of disciplines, such as nutrition, toxicology, epidemiology, food science, environmental health, biochemistry, and physiology. The field includes studies of human health impacts of food containing environmental contaminants or natural toxicants. The field includes investigations of food additives, migration of chemicals from packaging materials into foods, and persistence of feed and food contaminants in food products. Also, the field covers examining the impact of contaminants on nutrient utilization, adverse effects of nutrient excesses, metabolism of food toxicants, and the relationship of the body’s biological defense mechanisms to such toxicants. Finally, because the study of food and nutritional toxicology has obvious societal implication, one must examine the risk determination process, how food is regulated to ensure safety, and the current status of regulatory processes.
in foods by (1) providing the general principles of toxicology, including methods for food safety assessment and biochemical and physiological mechanisms of action of food toxicants; (2) developing an understanding of foodborne intoxications and infections and of diseases linked to foods; (3) applying the principles to the preven-tion of foodborne disease; and (4) providing a background about the regulapreven-tion of food safety.
For nearly a decade, I have been working with students, in and out of the classroom, on many facets of this evolving area of toxicology. This textbook has evolved from my experiences while conducting a course on food and nutritional toxicology and is designed to be a teaching tool.
Acknowledgments
Contents
SECTION I
Fundamental Concepts
Chapter 1 An Overview of Food and Nutritional Toxicology Defining the Terms and Scope of Food and Nutritional Toxicology
Toxicology
Food and Nutritional Toxicology
Toxicants in Foods and Their Effects on Nutrition Nutrients
Naturally Occurring Toxicants Food Additives and Contaminants Impact of Diet on the Effects of Toxicants Study Questions and Exercises
Recommended Readings
Chapter 2 General Principles of Toxicology Phases of Toxicological Effects
Exposure Phase Toxicokinetic Phase Toxicodynamic Phase Dose–Response Relationship
Frequency Response Potency and Toxicity Categories of Toxicity
Reversibility of Toxicity Response Hypersensitivity vs. Hyposensitivity Study Questions and Exercises
Recommended Readings
Chapter 3 Factors That Influence Toxicity Diet and Biotransformation
Effect of Macronutrient Changes Protein
Lipids Carbohydrates
Minerals Gender and Age Species
Study Questions and Exercises Recommended Readings
Chapter 4 Food Safety Assessment Methods in the Laboratory: Toxicological Testing Methods
Analysis of Toxicants in Foods Oral Ingestion Studies
Acute Toxicity Testing Toxicology Screen
Dose-Range-Finding and Dose–Response Curve for Lethality Subchronic Toxicity Testing
Chronic Toxicity Testing Genetic Toxicity
Ames Tests
Host-Mediated Assays Eukaryotic Cells, In Vitro
DNA Damage and Repair
Forward Mutations in Chinese Hamster Cells Mouse Lymphoma Cell Assay
Sister Chromatid Exchanges Eukaryotic Cells, In Vivo
Drosophila melanogaster
Micronucleus Test Specialized Oral Ingestion Studies
Developmental Toxicity — Teratogenesis Reproductive
Metabolic — Toxicokinetics Study Questions and Exercises Recommended Readings
Chapter 5 Food Safety Assessment: Compliance with Regulations Good Laboratory Practices (GLPs)
General Provisions: Subpart A Section 58.1 — Scope
Organization and Personnel: Subpart B Personnel
Testing Facility Management Study Director
Quality Assurance Unit Facility: Subpart C
Equipment: Subpart D Equipment Design
Maintenance and Calibration of Equipment Testing Facilities Operation: Subpart E
Standard Operating Procedures Reagents and Solutions
Animal Care
Test and Control Articles: Subpart F
Test and Control Article Characterization Test and Control Article Handling Mixtures of Articles with Carriers
Protocol for and Conduct of a Nonclinical Laboratory Study: Subpart G
Protocol — Section 58.120
Conduct of a Nonclinical Laboratory Study — Section 58.130 Records and Reports: Subpart J
Reporting of Nonclinical Laboratory Study Results — Section 58.185
Storage and Retrieval of Records and Data — Section 58.190 Retention of Records — Section 58.195
Good Manufacturing Practices Regulatory Agencies
The Food and Drug Administration Centers for Disease Control and Prevention U.S. Department of Agriculture
U.S. Environmental Protection Agency
Occupational Safety and Health Administration The National Marine Fisheries Service
Local and State Agencies International Agencies U.S. Food Laws
Study Questions and Exercises Recommended Readings
Chapter 6 Risk Risk–Benefit
Hazard Identification, Dose–Response, and Exposure Assessment Dose–Response Assessment
Exposure Assessment Risk Characterization
Chapter 7 Epidemiology in Food and Nutritional Toxicology Descriptive Strategies
Ecological Studies Case Reports Analytical Strategies
Cross-Sectional Studies Prospective Studies Retrospective Studies Meta-Analysis Molecular Epidemiology
Exposure–Dose Studies Physiological Studies
Gene–Environment Interactions Foodborne Diseases and Epidemiology Study Questions and Exercises Recommended Readings
Chapter 8 GI Tract Physiology and Biochemistry Anatomy and Digestive Functions
Gut Absorption and Enterocyte Metabolism Passive Diffusion
Carrier Mediated
Endocytosis and Exocytosis
Movement of Substances across Cellular Membranes Lipid-to-Water Partition Coefficient
Ionization and Dissociation Constants Transport into the Circulation
Delivery of Toxicant from the Systemic Circulation to Tissues Storage Sites
Plasma Proteins Liver and Kidney Bone
Lipid Depots
Physiologic Barriers to Toxicants Fluid Balance and Diarrhea
Treatment
Study Questions and Exercises Recommended Readings
Chapter 9 Metabolism and Excretion of Toxicants Metabolism of Toxicants
Conversion with Intent to Excrete Biotransformation Enzymology
Reduction Reactions Hydrolysis
Phase II or Type II Reactions Oxidative Stress
Cellular Reductants and Antioxidants Enzymatic Antioxidant Systems Targets of Oxidative Stress Products Excretion
Urinary Excretion
Biliary and Fecal Excretion Pulmonary Gases
Other Routes of Excretion Milk
Sweat and Saliva Principles of Toxicokinetics
Design of a TK Study One-Compartment TK
Volume of Distribution Multicompartment Models Study Questions and Exercises Recommended Readings
Chapter 10 Food Intolerance and Allergy Allergy and Types of Hypersensitivity
Primary Food Sensitivity
Nonimmunological Primary Food Sensitivities Secondary Food Sensitivity
Symptoms and Diagnosis Treatment
Study Questions and Exercises Recommended Readings
SECTION II
Toxicants Found in Foods
Chapter 11 Bacterial Toxins Intoxications
Bacillus cereus
Mode of Action Clinical Symptoms
Clostridium botulinum
Staphylococci
Mode of Action Clinical Symptoms Infections
Salmonella
Clinical Symptoms
Campylobacter jejuni
Clinical Symptoms
Clostridium perfringens
Clinical Symptoms
Escherichia coli
Enteropathogenic Escherichia coli (EPEC) Enteroinvasive Escherichia coli (EIEC) Enterotoxigenic Escherichia coli (ETEC)
Escherichia coli O157:H7 (Enterohemorrhagic E. coli or EHEC)
Listeria monocytogens
Clinical Symptoms
Shigella
Clinical Symptoms
Vibrio
Clinical Symptoms
Yersinia enterocolitica
Clinical Symptoms Study Questions and Exercises Recommended Readings
Chapter 12 Animal Toxins and Plant Toxicants Marine Animals
Scombroid Poisoning Mode of Action Clinical Symptoms Saxitoxin
Mode of Action Clinical Symptoms Pyropheophorbide-A
Mode of Action Clinical Symptoms Tetrodotoxin
Mode of Action Clinical Symptoms Ciguatoxin
Plants
Goitrogens
Cyanogenic Glycosides Phenolic Substances Cholinesterase Inhibitors
Clinical Symptoms Biogenic Amines
Clinical Symptoms Study Questions and Exercises Recommended Readings
Chapter 13 Fungal Mycotoxins Ergot Alkaloids and Ergotism
Mode of Action and Clinical Symptoms Aflatoxin
Trichothecenes Penicillia Mycotoxins
Rubratoxin Patulin
Yellow Rice Toxins Other Mycotoxins
Study Questions and Exercises Recommended Readings
Chapter 14 Toxicity of Nutrients Macronutrients
Carbohydrates Lipids Protein Micronutrients
Vitamins
Fat-Soluble Vitamins Water-Soluble Vitamins Minerals and Trace Elements
Magnesium Iron Zinc Copper Manganese Selenium Antinutrients
Study Questions and Exercises Recommended Readings
Chapter 15 Parasites, Viruses, and Prions Protozoa
E. histolytica Giardia lamblia Toxoplasma gondii
Worms
Roundworms
Trichinella spiralis Ascaris lumbricoides Anisakids
Tapeworms Viruses
Prions (Proteinaceous Infectious Particles) Diagnosing for BSE
Study Questions and Exercises Recommended Readings
SECTION III
Food Contamination and Safety
Chapter 16 Residues in Foods Insecticides
DDT (1,1'-(2,2,2-Trichloroethylidene)bis(4-Chlorobenzene) Organophosphates
Carbamates
Cyclodiene Insecticides Herbicides
Chlorophenoxy Acid Esters (Phenoxyalipatic Acids) Bipyridyliums
Fungicides
Industrial and Environmental Contaminants Halogenated Hydrocarbons
Polychlorinated Biphenyls Dioxins
Heavy Metals Mercury Lead Cadmium Arsenic
Chapter 17 Food Additives, Colors, and Flavors Preservatives
Benzoic Acid and Sodium Benzoate (Figure 17.1) Sorbate (Figure 17.2)
Hydrogen Peroxide (Figure 17.3) Nitrite and Nitrate
Antioxidants Ascorbic Acid Tocopherol Propyl Gallate BHT and BHA Sweeteners
Saccharin
Sodium Cyclamate Aspartame
Acesulfame Sugar Alcohols Alitame D-Tagatose Sucralose Coloring Agents
Red No. 2 (Amaranth) Red No. 3
Yellow No. 4 (Tartrazine) Methyl Anthranilate Safrole
Monosodium Glutamate (MSG) Study Questions and Exercises Recommended Readings
Chapter 18 Food Irradiation History of Food Irradiation Types of Irradiation Effectiveness of Irradiation By-Products of Irradiation Misconceptions
Regulations
Study Questions and Exercises Recommended Readings
Chapter 19 Polycyclic Aromatic Hydrocarbons and Other Processing Products
Nitrates, Nitrites, and Nitrosamines Products of the Maillard Reaction Study Questions and Exercises Recommended Readings
Chapter 20 Emerging Food Safety Issues in a Modern World HACCP
Developing an HACCP Plan Assemble the HACCP Team
Describe the Food and Its Distribution
Describe the Intended Use and Consumers of the Food Develop a Flow Diagram Describing the Process Verify the Flow Diagram
Principle 1: Hazard Analysis
Principle 2: Determine Critical Control Points (CCPs) Principle 3: Establish Critical Limits for Preventive Measures Principle 4: Establish Procedures to Monitor CCPs
Principle 5: Corrective Action When a Critical Limit Is Exceeded Principle 6: Effective Record-Keeping Systems
Principle 7: Verify That the HAACP System Is Working Antibiotic Resistance
Scope of the Problem GMOs
Pest Resistance Herbicide Tolerance Disease Resistance Cold Tolerance
Drought Tolerance and Salinity Tolerance Nutrition
Pharmaceuticals Phytoremediation Environmental Hazards
Unintended Harm to Other Organisms Reduced Effectiveness of Pesticides Gene Transfer to Nontarget Species Human Health Risks
Allergenicity
Unknown Effects on Human Health Economic Concerns
GMO Foods and Labeling Conclusion
Section I
1
An Overview of Food and
Nutritional Toxicology
DEFINING THE TERMS AND SCOPE OF FOOD AND NUTRITIONAL TOXICOLOGY
TOXICOLOGY
In essence, toxicology is the science of poisons, toxicants, or toxins. A poison, toxicant, or toxin is a substance capable of causing harm when administered to an organism. Harm can be defined as seriously injuring or, ultimately, causing the death of an organism. This is a rather simplistic definition, because virtually every known chemical or substance has the potential for causing harm. The term toxicant can be a synonym for poison, or the term poison might be more appropriate for the most potent substances, i.e., substances that induce adverse effects at exposure levels of a few milligrams per kilogram of body weight (see later discussion). The term toxin
usually refers to a poison derived from a protein or conjugated protein produced by some higher plant, animal, or pathogenic bacteria that is highly poisonous for other living organisms, e.g., botulinum toxins. Toxicologists study the noxious or adverse effects of substances on living organisms or on in vitro surrogate models, such as cell and tissue cultures. The substances toxicologists study are usually chemical compounds but may be elemental or complex materials. Radioactive elements, heavy metals (e.g., mercury or lead), or the packing materials used in food processing are examples of such substances. Food toxicology deals with substances found in food that might be harmful to those who consume sufficient quantities of the food con-taining such substances. On rare occasions, common foods are contaminated with unacceptably high levels of toxicants. Such substances can be inherent toxicants, substances naturally found in foods, or contaminants, which are substances that find their way into food either during the preparation or processing of such foods.
Nutritional toxicology is the study of the nutritional aspects of toxicology. Nutritional toxicology is related to and might even overlap but is not synonymous with food toxicology. Food toxicology emphasizes toxicants or toxins found in foods, whereas nutritional toxicology targets the interrelations that toxicants or toxins have with nutrients in the diet, which affect nutritional status. Nutritional toxicology can refer to the means by which the diet or components of the diet prevent against the adverse effects of toxicants or toxins.
starting when humans first realized that they had to be cautious with food selection or suffer dire consequences. Our ancestors probably learned from trial and error and by observation about which food sources satisfied hunger and which led to illness or death. As illustrated in the cartoon in Figure 1.1, early humans were quick to either learn or suffer the consequences of deciding whether to eat a plant where dead animals lay. Thus, our ancestors developed dietary habits that allowed for the survival, growth, and reproduction of the species.
Hemlock and various other poisons were known and studied by the ancient Greeks. The fundamental concept of toxicology — the dose determines the poison — was conceived by Paracelsus (1493 to 1541) and based on his commentary that all substances are poisons; there is none which is not a poison and the right dose determines the poison from a cure. Therefore, the premise that anything has the potential to be a poison if taken in a large enough dose dictates the scope of toxicology, which is to quantitate and interpret the toxicity of substances. Most toxicologists deal with exogenous compounds, or those compounds that are not part of the normal metabolism of organisms, i.e., xenobiotic or foreign compounds. Food and nutritional toxicologists deal with toxicants in food, the health effects of high nutrient intakes, and the interactions between toxicants and nutrients.
FOOD AND NUTRITIONAL TOXICOLOGY
trained in other disciplines and subsequently were rich in diversity. Food and nutri-tional toxicology can be considered an emerging subdiscipline of toxicology. The area of food and nutritional toxicology bridges traditional sciences and can be regarded as a branch of either nutrition, food science, or toxicology. In addition, there are significant contributions from other sciences, both new and emerging, to food and nutritional toxicology, e.g., behavior sciences, epidemiology, molecular biology, environmental sciences, public health, immunology, and microbiology. In the following chapters we will discuss some current research that deals with the effects, both good and bad, of food components on the modulation of the immune response or alterations of behavior.
Food safety is another area that can be encompassed within food and nutritional toxicology. Within the food safety arena we deal with the regulatory and consumer or economic implications of toxicity issues related to our food supply. Our concerns about food safety are not new. Around the time of the Civil War, W.O. Atwater warned in Harper’s Weekly that city people were in constant danger of buying unwholesome meat and finding meat coated with glycerine to give it the appearance of freshness. It was common at that time to find milk diluted with water, coffee adulterated with charcoal, or cocoa mixed with sawdust. Upton Sinclair’s The Jungle
was a startling wake-up call and prompted the start of governmental controls on the food industry. Even at present, it seems that there are reports almost daily of a food or food constituent whose safety has come under scrutiny. So sometimes it is hard not to succumb to the belief that a food safety crisis exists; however, when these concerns and claims are put into perspective, one can understand why the U.S. still has the safest, cheapest, and most varied food in the world.
TOXICANTS IN FOODS AND THEIR EFFECTS ON NUTRITION
Potential sources of toxicants in food include nutrients, natural food toxicants, con-taminants, and chemicals or substances intentionally added to food (food additives).
NUTRIENTS
With the exception of vitamin D, vitamin A, and some minerals, the intake of nutrients from natural food sources will not pose any significant health problems. However, one can argue that the health problems associated with high intakes of protein, fats, or energy are really manifestations of nutrient toxicity, i.e., cardiovas-cular diseases, cancers, and eye diseases such as macardiovas-cular degeneration and other chronic diseases. The other potential means whereby nutrient intakes can present health problems is the abuse of nutrient supplementation. A nonfood source of a nutrient can produce pharmacological actions at concentrations well above normal dietary amounts.
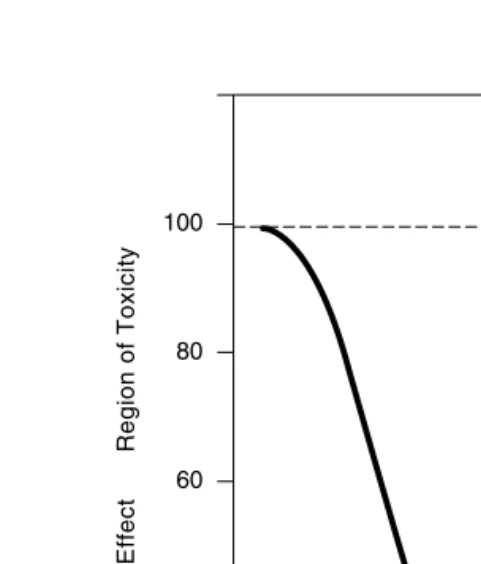
Over the last few years, dietary reference intakes (DRIs) have been developed by the Food and Nutrition Board of the National Academy of Sciences. The premise for developing DRIs is that such values reflect the current knowledge of nutrients, particularly with respect to their role in diet and chronic diseases. Similar to rec-ommended dietary allowances (RDAs), DRIs are reference values for nutrient intakes to be used in assessing and planning diets for healthy people. A vital component involved in the development of DRIs is the value for tolerable upper level (UL). UL may be defined as the point beyond which a higher intake of a nutrient could be harmful. UL is the highest level of daily nutrient intake that is likely to pose no risk of adverse health effects in almost all individuals in a specified life stage group. The FIGURE 1.2 Concentration (dose) effect of nutrients (solid line) compared with a typical dose–response curve (dashed line).
Region of No Effect
Region of Toxicity
0 20 40 60 80 100
0 5 10 15 20 25 30 35 40 45 50 55
interest in developing ULs is partly in response to the growing interest in dietary supplements that contain large amounts of essential nutrients; the other concern is the increased fortification of foods with nutrients. For example, for vitamin C and selenium, the UL refers to total intake from food, fortified food, and nutrient sup-plements, whereas for vitamin E it might refer only to intakes from supsup-plements, pharmacological agents, or their combination. Often, ULs apply to nutrient intake from supplements because it would be extremely unusual to obtain such large quantities of a specific nutrient in food form.
A risk assessment model was used to derive specific ULs, which included a systematic series of scientific considerations and judgements. The ULs were not intended to be recommended levels of intake because there are little established benefits for healthy individuals if they consume a nutrient in amounts greater than the RDA. Also, the safety of routine long-term intakes above the UL is not well established. The objective of ULs is to indicate the need to exercise caution in consuming amounts greater than the recommended intakes. It does not mean that high intakes pose no risk of adverse effects.
NATURALLY OCCURRING TOXICANTS
The notion that potentially toxic substances can be commonly found in conventional foods is difficult for the layperson and some well-educated people to accept. On an emotional level, food is regarded as that which sustains life, should be pure, unadul-terated, and sometimes has a spiritual aura. Thus, many individuals are astonished to find that plants and some animals that are sources of food can produce an array of chemicals that can be harmful. There are some notable examples. A well-acknowl-edged naturally occurring toxicant is the toxin produced by the puffer fish, Fugu rubripes, which is popular in Japanese cuisine. Another example is the poisonous mushroom Amanita muscaria. The production of toxicants is more common than one might first realize. Plants produce both primary and secondary metabolic prod-ucts. In the plant kingdom, many phytochemicals are produced as secondary metab-olites, e.g., metabolic by-products of metabolism, excretion, and elimination. Through evolution, some of these secondary metabolites have become important defense chemicals used by the plant against insects and other organisms. The plant’s weapons are not as technological as the one shown in the cartoon in Figure 1.3, but many are quite sophisticated biochemically. Primary metabolites are chemicals that have key roles in important physiological plant processes such as photosynthesis, lipid-energy and nucleic acid metabolism, and synthesis. It is likely that secondary metabolites evolved in response to and interaction with organisms of the animal and plant kingdoms or certain herbivores and pathogens. Recent advances in genetically modified foods have used such knowledge for developing plants with the ability to better defend themselves against disease and predators.
FOOD ADDITIVES AND CONTAMINANTS
additives include chemical preservatives such as butylated hydroxytoluene (BHT) and nitrite and microbial retardants such as calcium propionate. The food industry adds chemicals as texturing agents and flavors. Various chemicals may enter the food chain at different stages of processing, such as residues from fertilizers, pesti-cides, veterinary pharmaceuticals and drugs, and environmental chemicals such as lead or polychlorinated biphenyl (PCB). Some additives are generally recognized as safe (GRAS) items and require no testing for safety. Others require a battery of tests to ensure their safety for use in consumer foods.
Food additives can provide many benefits for the consumer and the food pro-ducer. Longer shelf life is advantageous not only to the producer but also to the consumer, for whom a longer shelf life means lower prices, reduced spoilage and waste, and fewer trips to the grocery store to stock up. However, some may argue whether such convenience is a benefit or a ploy by the industry to use more of their products. There are a multitude of reasons for using additives, some less meritorious than others (green catsup, anyone?). The bottom line is whether the product is safer with the additive present. Does the product have nutritional negatives, i.e., is it less nutrient dense or higher in saturated fats?
IMPACT OF DIET ON THE EFFECTS OF TOXICANTS
Several nutrients have been recognized for their roles in protecting against the toxic effects of noxious chemicals such as alcohol and free radicals. Recent research has directed our attention to studying other chemicals in the diets, studying phytochem-icals, and reexamining how macro- and micronutrients may modulate our response to various toxicants. Specific phytochemicals have been found to act as anticancer agents and antioxidants, and to have other potential health benefits.
However, with these exciting advances in nutrition and health will arise con-cerns about safety and efficacy that must be addressed. Thus, with such advances, we can expect to see the field of food and nutritional toxicology at the forefront, addressing issues of mechanisms of action, risk, and safety and what is appropriate for optimal health.
STUDY QUESTIONS AND EXERCISES
1. Define toxicology, food toxicology and nutritional toxicology, phytochem-ical, and toxin.
2. Describe how toxicants might affect nutrition and health.
3. How might an organism’s diet impact on the effects of a toxicant?
RECOMMENDED READINGS
Hatchcock, J.N., Nutritional Toxicology, Academic Press, New York, 1982.
Institute of Medicine, Food and Nutrition Board, Dietary Reference Intake, National Academy Press, Washington, D.C., 1997, 1998, 2000, 2001, and 2002.
Jones, J.M., Food Safety, Egan Press, St. Paul, MN, 1992.
Ottoboni, M.A., The Dose Makes the Poison, 2nd ed., John Wiley & Sons, New York, 1997. Shibamoto, T. and Bjeldanes, L.F., Introduction to Food Toxicology, Academic Press, San
2
General Principles
of Toxicology
PHASES OF TOXICOLOGICAL EFFECTS
The genesis of toxicological effects, or biological effects, is an inordinately complex process involving many parts or steps. It is useful to categorize toxicological effects into three phases (Figure 2.1): (1) the exposure phase, which covers those factors that are responsible for determining the concentration of a toxic substance that effectively comes in contact with an organism; (2) the toxicokinetic phase, which includes the physiological processes that influence the concentration of the toxic substance or its active metabolite at the active site or receptors in the organism; and (3) the toxicodynamic phase, which includes interactions of the toxic substance with its molecular site of action and the biochemical or biophysical events that finally lead to the toxic effects observed. The details of each phase are discussed in this chapter.
EXPOSURE PHASE
For absorption, a toxic substance must be present in a molecular form that can be dispensed and be relatively lipophilic to penetrate biological membranes. The degree of ionization of the substance and the pH at the site of absorption are critical factors that affect the bioavailability and absorption of a toxic substance. Bioavailability is a measure of the degree to which a substance becomes available to the body after ingestion and is therefore available to the tissues. Many interactions between the toxic substance and various components in food influence the absorption of com-pounds. Therefore, various factors contribute to the exposure profile of a toxic substance’s ability to be available to the organism.
In many situations, the uptake and elimination of a toxicant is mostly by passive diffusion processes, and a bioaccumulation factor, Kb, can represent a partition
coefficient for the toxicant substance between the organism and its environment, i.e., a reversible partition between the two compartments of oil (representing the membrane) and water (representing the aqueous or cytosol). For example, an octanol–water model system can be used as an index of the relevant lipophilicity of a toxic substance. Therefore, if Co is the aqueous concentration and Ci is the
The influx can be described as:
where k1 and k2 are first-order rate constants. Therefore, at equilibrium:
If Co is virtually zero, then:
For Ci1 and Ci2 and t1 and t2, respectively, the following is true:
For the half-life (t1/2) of the toxicant, the following is derived:
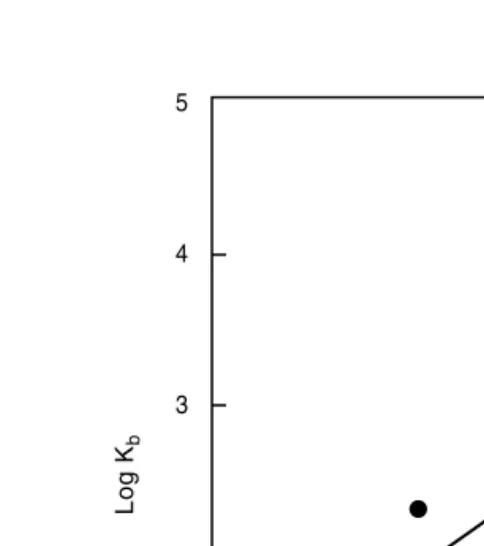
The partition coefficient of agents in an octanol–water system, as a rule, can be used as an index of the relevant lipophilicity of the substance. If the lipophilicity (logP) is plotted against the bioaccumulation factor (logKb) for a number of compounds
FIGURE 2.1 The three phases of toxicological effects.
with varying lipophilicities, a linear relationship, as expected, is obtained. Figure 2.2 shows an example of this linear relationship taken from the literature.
TOXICOKINETIC PHASE
All of the physiological processes and factors involved in absorption, distribution, biotransformation, and excretion of a toxicant comprise the toxicokinetic phase. For the concentration of toxicant that is ingested by an organism, a fraction of the dose reaches the general circulation or becomes available systemically. The remaining dose is eliminated as waste in the feces. If the toxicant is ingested only once, availability will depend on the dose, rate of absorption, and rate of elimination. In a chronic exposure, the plasma concentration eventually reaches a steady-state level, i.e., the quantity absorbed is equal to the quantity eliminated per unit of time. Usually, elimination increases as plasma concentration increases. The amount of toxicant that reaches the target or receptor sites is designated as toxicologically available or bioavailable. However, the situation is complicated by the fact that toxicants may be converted to other products or metabolites that results in bioactivation or biotox-ification. Bioactivation occurs when the metabolite is bioactive and biotoxification occurs when the metabolite is biologically inactive.
FIGURE 2.2 The linear relationship between lipophilicity (logP) and bioaccumulation factor (logKb).
Log P
Log K
b
5
4
3
2
1
0
TOXICODYNAMIC PHASE
The processes involved in the interaction between the toxicant and its molecular sites of action constitute the toxicodynamic phase. Molecular sites of action include receptors for reversibly acting substances or sites that are responsible for the induc-tion of chemical lesions for nonreversibly acting toxicants. The origin of toxicody-namics is pharmacodytoxicody-namics, the beginning of which can be traced back to the early 1800s. Students in pharmacology were taught that the mode of action of drugs should be investigated by scientific means in order to introduce a more rational basis for therapy (a revolutionary approach for the time). The study of metabolism and statistical methods raised pharmacology to the level of an exact discipline equal in status to that of chemistry and physiology.
DOSE–RESPONSE RELATIONSHIP
No chemical agent is entirely safe and no chemical agent should be considered entirely harmful. The single most important factor determining the potential harm-fulness or safeness of a compound is the relationship between the concentration of the chemical and the effect produced on the biological mechanism. A chemical can be permitted to come in contact with a biological mechanism without producing an effect on the mechanism, provided the concentration of the chemical agent is below a minimal effective level.
If one considers that the ultimate effect is manifested as an all-or-none response, or a quantal response such as death, and that a minimal concentration produces no effect, then there must be a range of concentrationsof the chemical that will give a graded effect somewhere between the two extremes. The experimental determination of this range of doses is the basis of the dose–response relationship.
some substances (e.g., amphetamines) are metabolized along different routes in humans and dogs. Thus, a toxicant may not reproduce in humans the effects recorded in the animal species, and when assessing the potentiality of a new food substance care has to be taken to not assume too close a parallelism between the reactions of the two species.
Toxicity testing, no matter how carefully performed, cannot be expected to reveal all the potential adverse effects. Apart from the difficulty of predicting the responses of humans from the results of animal experiments, some toxic effects appear in only a minority of subjects. For example, antibiotics are among the safest of drugs; however, rarely, penicillin administration initiates a fatal anaphylactic reaction. The purpose of toxicity tests is to make a realistic assessment of the potential hazards in relation to the benefits likely to follow after use of the compound. In the final analysis, it is impossible to make this assessment with any assurance until the substance has been in actual use for many years.
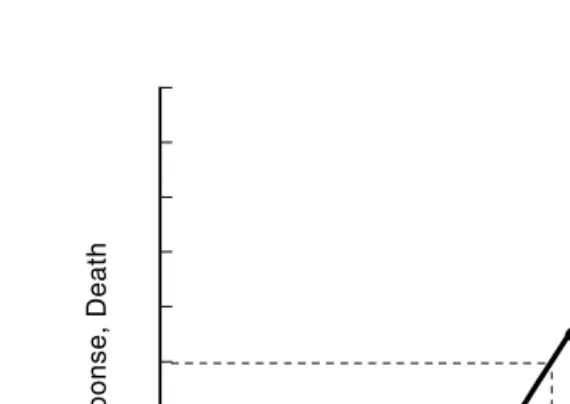
Dose–response refers to the relationship between the exposure dose of a sub-stance and the response of the organism ingesting the subsub-stance. A dose–response relationship is determined by experiments, usually done with laboratory animals, in which groups of individuals are dosed with the substance over a range of concen-tration. The animals are observed for symptoms for an endpoint, which must be measurable and quantifiable. The endpoint can be a physiological response, a bio-chemical change, or a behavior response. It is important to keep in mind that, when measuring the toxicity of a substance, the endpoint selected is relevant to organisms of the same species as well as among different species. Endpoints often selected for toxicity studies include, among others, the effective dose (ED) and the lethal dose (LD). ED endpoints are usually therapeutic efficacies, such as the dose to produce anesthesia or analgesia. For acute toxicity studies, a measure of LD50 is often used. The calculated LD50 is the statistically estimated dose that when administered to a population will result in the death of 50% of the population. Figure 2.3 graphically represents this concept. The relationship between dose and response is typically sigmoid in shape. Some individuals within a population show an intense response whereas others show a minimal response to the same dose of the toxicant. For a lethal compound at a particular dose, some animals will succumb to the dose whereas others will not. There are variations among a homogeneous population, be it animals or cells, and there are a range of responses depending on the endpoint measured. Basically, the dose–response curve will be the familiar Gaussian curve (bell-shaped, see later) describing a normal distribution in biological systems. The deviation of response around an otherwise uniform population is a function of biological variation in the population itself. Thus, it is difficult to predict beforehand what effect a compound under study will have on an individual within a population. Some animals respond at low doses whereas others do at high doses, with the majority responding at around the median dose.
FREQUENCY RESPONSE
seldom obvious but become evident when a biological mechanism is challenged, such as by exposure to a chemical agent.
If a chemical is capable of producing a response (such as death), and the response is quantitated, not all members of the group will respond to the same dose in an identical manner. What was considered as an all-or-none response applies only to a single member of the test group and is actually found to be a graded response when viewed with respect to the entire group. Such deviations in the response of apparently uniform populations to a given concentration of the chemical are generally ascribed to result from biological variation.
In response to a toxicant, biological variation within members of a species is usually low compared with variation between species. The species population dif-ferences reflect metabolic or biochemical variations within the species itself. Testing a toxicant’s effect on a homogeneous animal population eliminates the potential causes of high variation that might occur in a heterogeneous population, if gender and age are controlled. Homogeneity of test subjects allows for valid comparisons between members of a population, and they share common characteristics. Thus, toxicity studies often use inbred strains of rodents or organisms.
Figure 2.4 illustrates the response of any given population to a range of doses. The criteria of an experiment for toxicity testing are that the response is quantitated and that each animal in a series of supposedly uniform members of a species may be given an adequate dose of the chemical to produce an identical response. Such data can be plotted in the form of a distribution or frequency–response curve, which typically follows a bell-shaped or Gaussian distribution. The frequency–response curve plots identical response vs. dose (quantal response curve) and represents the range of doses required to produce a quantitatively identical response in a large population of test subjects. In a large population, a large percentage of the animals FIGURE 2.3 A typical sigmoidal dose–response curve and derivation of LD50.
Response, Death
Dose
that receive a certain dose will respond in a quantitatively identical manner, such as a particular response, e.g., death. If the dose is varied between low and high, some animals will exhibit the same response to a low dose whereas others will require a higher dose. The curve indicates that a large percentage of the animals receiving a given dose will respond in a quantitatively identical manner. As the dose varies in either direction from the x-axis, some animals will show the same response to a lower or higher dose.
In practical applications, the frequency distribution is skewed toward the low-or high-dose side when the data is applied to methods seeking the best-fitting curve. In a Gaussian distribution, one typically finds that 66% of the responses are within one standard deviation of the mean dose. Eighty-six percent of the individuals will respond to a dose within two standard deviations of the mean and 95% within three standard deviations. Thus, toxicological data may be analyzed in a manner that allows one to use acceptable statistical methods in evaluating the results. In practice, the toxicologist usually analyzes the data from an experiment by first transforming the results into cumulative distribution. Frequency response curves are not commonly used. The convention is to plot the data in the form of a curve relating the dose of the chemical to cumulative percentage of animals showing the response (death). Defining the dose–response curves involves doing an experiment by using groups of homogenous species given a substance at different doses. The dose to give to each group is found experimentally and should be at a level that does not kill all the animals in a group. The initial dose may be very low so as not to kill most of the animals. The intermediate doses can be multiples (logarithmic basis). Plotting the data in the form of a curve relating the dose of the toxicant to a cumulative percentage of animals demonstrating the response gives the sigmoid dose–response curve shown in Figure 2.3.
FIGURE 2.4 A typical bell-shaped frequency response for mortality, comparing death with dose.
Mortality Frequency
The plot can be divided into several important areas. First there is a linear area, where the incidence of the quantal response is directly related to the concentration of the compound. It is also apparent that the compound may be considered as harmful or safe, depending on the dose given. The LD50 is a statistically obtained visual value, which is the best estimation of the dose required to produce death in 50% of the population. This value is always accompanied by an estimate of the error of the value. The LD50 can be derived graphically by drawing a horizontal line from 50% and dropping a vertical from intersection. The LD84, LD16, etc., values can be similarly determined. In practice, a normal distribution is more likely to occur if the scale of the abscissa is logarithmic rather than linear. If a plot of the actual doses against the response gives a normal distribution, a similar distribution will emerge if the logarithms of the doses are used in the graph. There is no disadvantage in basing calculations on the logarithms of doses even in situations in which the doses themselves could have been used.
Because quantal dose–response phenomena are usually normally distributed, one can convert the percent response to units of deviations from the mean, the so-called normal equivalent deviations (NEDs), or convert to probit units. The NED is defined for any value of the log (dose) as (x – )/d; it represents the distance, in multiples of the standard deviation, of the point x from the mean . For values of
x less than , the normal equivalent deviation is a negative quantity and for arith-metical convenience the negative values of the deviation are eliminated by adding 5 to the normal equivalent deviation. This gives the probit (a contraction of proba-bility unit). The quantity 5 is chosen because it brings the zero of the probit scale to a point located five standard deviations below the mean. For example, the normal equivalent unit for a 50% response is zero, which equals a probit unit of 5. Table 2.1 lists other conversions.
Note that probits are related to mortality in the same way as the doses themselves. Thus, the relationship between probits and doses is a straight line.
In an NED or probit transformation, an adjustment of quantal data to an assumed normal population distribution is accomplished, which results in a straight line. The LD50 is obtained by drawing a horizontal line from the NED of zero or a probit of 5, which is the 50% mortality point, to the dose–effect line. At the point of inter-section, a vertical line is drawn and at its intersection of the x-axis is the LD50 point.
TABLE 2.1
Percent Response, NEDs, and Probits
Such transformations of the data can be useful to determine lethal doses for 90% or for 10% of the animals. In addition, the slope of the dose–response curve can be obtained, which can be useful for comparisons.
Tables are available that enable percentages to be converted directly into probits. Alternatively, it is possible to use a special graph paper (probit paper) in which the ordinates are ruled on a probit scale and the abscissa on a logarithmic scale.
POTENCYAND TOXICITY
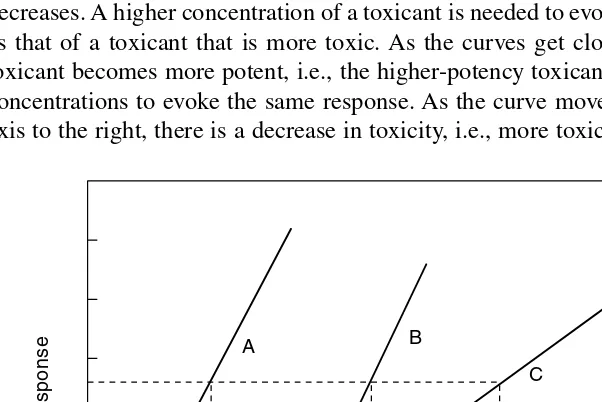
As Figure 2.5 illustrates, the relative toxicities of two compounds can be compared provided the slopes of the dose–response curves are roughly parallel. If the LD50 for B is greater than that of A, B is less potent than A. An example is comparing the relative toxicities of two compounds in relation to the doses required to produce an equal effect — death. However, the LD50 for one may be in micrograms and for the other in grams. Two or more compounds having approximately the same slopes suggest similar mechanisms of toxic action. Compound C in Figure 2.5 is likely not to have the same mechanism of action as compounds A and B. Note that the LD50 of C is more than the LD50 of A and B, but the reverse is true for LD5s of compounds C and B. Compound C is less toxic than A or B at LD95.
The relative toxicity of similarly shaped curves shifts to the right as toxicity decreases. A higher concentration of a toxicant is needed to evoke the same response as that of a toxicant that is more toxic. As the curves get closer to the y-axis, the toxicant becomes more potent, i.e., the higher-potency toxicant is required at lower concentrations to evoke the same response. As the curve moves farther from the y -axis to the right, there is a decrease in toxicity, i.e., more toxicant is required to get
FIGURE 2.5 Dose–response curves: different slopes for different mechanisms of action. Compound A has the same slope as compound B, but the slopes of both compounds A and B are different from that of compound C.
A B
C
Response
an equal response. Therefore, potency of a compound is related to its toxicity. A more potent toxicant elicits a toxic response at lower concentrations, and vice versa. As shown in Figure 2.5, for two compounds, a variety of slopes are possible when the dose–response data for different compounds are plotted. Every compound has an identifiable slope for its dose–response relationship.
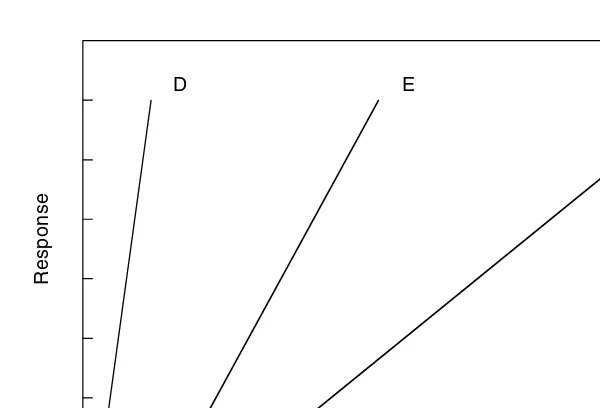
The slope of a curve can be used as an index of the “margin of safety,” which is defined as the magnitude of the range of doses involved in progressing from a noneffective dose to a lethal one. The dosages range between the dose producing a lethal effect and the dose not producing a lethal or desired effect. In Figure 2.6, compound F has a higher margin of safety than compound E. If the slopes are parallel, the margin of safety might not be different.
Death is the ultimate extreme in toxicity; however, other effects are possible, from desirable through just undesirable to harmful. Examples can be found with drugs, because drugs have side effects. As a rule, a chemical is a drug if undesirable actions are not significant in comparison with desirable actions. Morphine produces analgesia but also respiratory depression, and antihistamines or penicillin may ini-tiate undesirable immunological actions. Undesirable effects are dose-related too. Thus, in the board view, any adverse effect or potentially undesirable side effect can be used to determine a dose–response curve.
CATEGORIES OF TOXICITY
When classifying compounds as toxic, extremely toxic, or nontoxic, a practical and useful consideration is where to draw the line in toxicity classification. It is apparent that toxicity is relative and must be described as a relative dose–effect relationship between compounds. However, it is also clear that the concept of toxicity as a relative FIGURE 2.6 Slopes of dose–response curves influence the margin of safety.
Dose
D E F
phenomenon is true only if the slopes of the curves of the dose–response relationship for the compounds are essentially identical.
Table 2.2 is a useful guide that categorizes toxicity on the basis of amounts of a substance necessary to produce harm, i.e., a lethal dose, based on metric or U.S. standard weights. This information helps classify substances based on weights.
Another way to categorize lethal doses is by comparing compound ratios of minimal toxic level to the minimal adequate level, as might be done for nutrients. For example, when comparing biotin (toxic dose of 50 mg) and vitamin A (a toxic dose of 5 mg), it is observed that it takes 10 times more of the toxic oral dose of biotin to produce an adverse effect. Toxicity is relative and must be described as a relative dose–effect relation among compounds.
REVERSIBILITY OF TOXICITY RESPONSE
Any consideration of the relative safety of a chemical must also take into account the degree to which the response to the toxicant is reversible. In other words, as the concentration of the substance decreases in the tissues and it is eliminated from the body, will the effects of the toxicant be reversed? It is known that after a single exposure (a one-time ingestion of a toxicant), the body will in time eliminate the substance. But will the biological (adverse) effects diminish over time? Reversal of adverse effects depends on the type of effect. The reversibility of a toxicity response can be categorized as readily reversible, not readily reversible, or nonreversible. Most chemical-induced effects short of death are reversible in time if the chemical subsides over time. However, once an effect is produced, it may outlast the presence of the original chemical. An example is the compound organophosphate and its target site choline esterase. Organophosphate toxicity results in an inactivated esterase, meaning that the effects are essentially irreversible (not readily reversible), at least till the time it takes to synthesize more esterase. The body must synthesize new esterase, which might take as long as a few weeks.
In reversible toxicological effects, once the chemical has been removed, the deranged system will return to its normal functional state either immediately or later, after some regeneration has occurred. Specific toxicological effects that are
irrevers-TABLE 2.2
Categories of Toxicity
Dose Metric Concentration (Per kg of Body Weight)
U.S. Standard Weight (Per 150 lb) (oz.)
ible (nonreversible), particularly when they are life threatening, include teratogen-esis, mutagenteratogen-esis, and carcinogenesis. Because of the consequences, exposure to such xenobiotics must be limited. However, many substances do not clearly fall under or out of these categories; thus, toxicologists rely on a battery of in vivo and
in vitro tests to determine whether a compound produces toxicity.
HYPERSENSITIVITYVS. HYPOSENSITIVITY
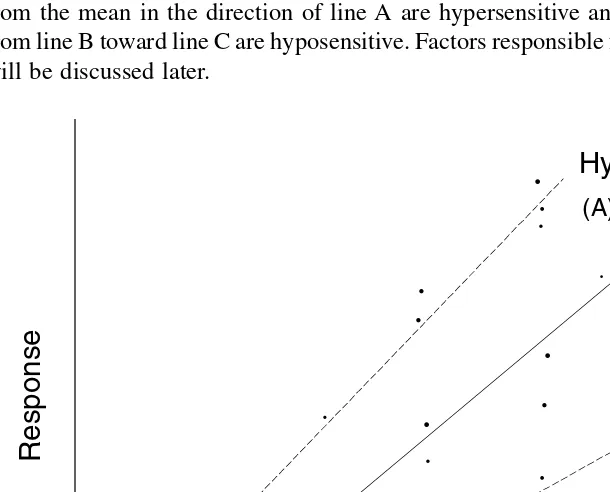
In some situations, no fixed dose can be relied on to produce a given response in a population. Therefore, a distribution curve can show a normal response, a hypersen-sitive response, and a hyposenhypersen-sitive response.
Figure 2.7 is a plot of a theoretical compound in which each point represents one item of contributing data. The mean dose–response relation exists, shown by line B. Lines A and C are extreme responses to the toxicant. Subjects who deviate from the mean in the direction of line A are hypersensitive and those that deviate from line B toward line C are hyposensitive. Factors responsible for such sensitivities will be discussed later.
FIGURE 2.7 Mean-dose relationships illustrating hypersensitivity and hyposensitivity.
STUDY QUESTIONS AND EXERCISES
1. Can there be a dose–response curve that is completely vertical or parallels the abscissa?
2. What factors might contribute to species differences seen in the results of toxicity testing?
3. Describe the key points of a dose–response curve and the significance of broad and narrow plateaus or valleys in such curves.
4. Discuss how one can assess whether two toxicants act on a species by a similar biologic mechanism, and provide a rationale for your assessment.
RECOMMENDED READINGS
Klaasen, C.D., Amdur, M.O., and Casarett, L.J., Casarett and Doull’s Toxicology: The Basic Science of Poisons, 6th ed., McGraw Hill, New York, 2001.
Loomis, T.A. and Hayes, A.W., Loomis’s Essentials of Toxicology, 4th ed., Academic Press, New York, 1996.
Omaye, S.T., Safety facet of antioxidant supplements, Top. Clin. Nutr. 14, 26-41, 1998. Ottoboni, M.A., The Dose Makes the Poison: A Plain Language Guide, John Wiley & Sons,
New York, 1997.
3
Factors That Influence
Toxicity
DIET AND BIOTRANSFORMATION
The biotransformation of a toxic compound usually, but not always, results in detoxification. It can, however, lead to the metabolic activation of foreign com-pounds. The effect of dietary constituents on the metabolism of foreign compounds has been the subject of intensive study for many years. More than two decades ago, the term toxicodietetics was coined for the study of dietary factors in the alterations of toxicity — a term that was perhaps ahead of its time.
There are a multitude of dietary factors that can affect toxicity. Dietary factors can be associated with the exposure situation, ranging from factors such as palat-ability of the food to the physical volume or rate of food ingestion. Dietary factors can be responsible for producing changes in the body composition, physiological and biochemical functions, and nutritional status of subjects. These factors, and others, can have marked influences on the toxicity of substances. For example, it is customary to fast laboratory animals for toxicity studies, usually 2 h before killing them at the end of the study. Fasting the animals has been shown to increase catabolic effects and decrease liver glycogen stores. Laboratory animals are fasted to decrease their liver glycogen, which interferes with the preparation of microsomal enzyme fractions. Also, fasting is done because the presence of food in the stomach impedes gastric absorption. Fasting is a traditional procedure practiced by physicians on their surgical patients to prevent regurgitation of fluids into the airways. Fasting animals and patients is, for most purposes, considered normal. However, there is ample evidence that fasting affects mechanisms of drug metabolism, toxicokinetics, and toxicity. Fasting for as long as 8 h has been shown to reduce blood glucose and produce changes in the activity of several toxicant-metabolizing enzymes. In addi-tion, fasting induces the activity of cytochrome P450 in the liver and kidneys of rats, and results in glutathione depletion and generation of reactive oxygen species (ROS), oxidative stress, lipid peroxidation, decreased glucuronide conjugation, and overall decreased detoxification.
low-protein diets are likely due to a decrease in microsomal enzyme systems, i.e., depressed protein availability for enzyme synthesis in protein-deficient animals.
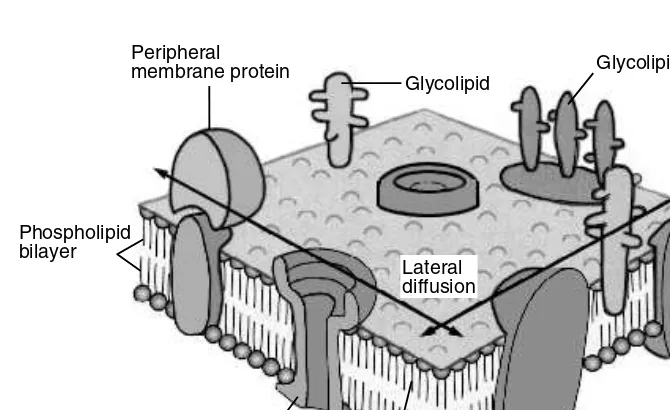
Diet can affect enzymatic mechanisms of detoxification in several ways. Dietary deficiencies of essential macro- or micronutrients that are required by metabolizing systems can lead to decreased activities of such enzyme systems. Enzyme systems can be localized in the membrane or the soluble fractions of cells. As illustrated in Figure 3.1, the importance of dietary factors in toxicant metabolisms is evident by the diverse composition nature of membranes that harbor such detoxification enzyme systems.
EFFECT OF MACRONUTRIENT CHANGES
Protein
Essential amino acids are the building blocks for proteins. For mammalian organ-isms, amino acids are the only dietary source of nitrogen for protein synthesis. Malnutrition due to protein-calorie insufficiency is one of the major nutritional problems worldwide. In young children, protein-calorie malnutrition is the world’s most important and devastating nutrition problem. Included are diseases such as kwashiorkor, which is caused by a deficiency of protein or certain amino acids, and marasmus, which is essentially a lack of calories but also affects protein. Protein intakes vary widely in various parts of the world. The wide range in total protein intakes is probably because of differing consumptions of meat protein, which is linked to the economy of different regions in the world. In addition to individuals suffering from a lack of protein, or those who may have variations in intakes of FIGURE 3.1 Biomembrane structure is influenced by a variety of nutrients.
Peripheral membrane protein
Phospholipid
bilayer Phospholipidbilayer
Oligosaccharide side chain
Transmembrane channel protein
Glycolipid
Glycolipid
Lateral diffusion
Membrane protein Membrane protein
dietary protein either because of choice or due to physiological impairment or disease, protein deficiencies may be seen in chronic alcoholics with abnormal diets, those who abuse drugs, those with various behavior abnormalities, or those dealing with food fads.
Protein deficiencies affect many aspects of metabolism. Foreign substances, together with endogenous compounds, e.g., steroid hormones, all may be metabo-lized in vivo. Subsequently, hormonal balance, pharmacological activity of sub-stances, acute toxicity, and carcinogenesis all may affect the metabolism of toxicants. Lack of protein affects enzymes, including enzymes responsible for toxicant metab-olisms. The reactions that these enzymes catalyze are affected, because of the amino acids quality or quantity required for protein synthesis that goes into the production of metabolizing enzymes. Lack of protein may lead to changes in amino acid composition of enzymes, which, in turn, may affect substrate binding or interaction with the enzyme. Cytochrome P450-dependent mixed-function oxidase, primarily located in the liver, is generally considered to be the predominant enzyme involved in detoxification. Also important are various conjugation enzymes, which help form products that are more water soluble and excretable.
Protein deficiency can lead to a reduction of NADPH cytochrome P450 reductase and certain cytochrome P450 isoenzymes. Uridine diphosphate glucuronic acid (UDPGA)-glycuronyl transferases, glutathione (GSH) S-transferases, and numerous enzymes of the antioxidant defense can be compromised by a lack of protein in the diet. UDPGA-glycuronyl transferases are involved in the conjugation of drugs with UDPGA. Dietary protein is crucial for the biosynthesis of glutathione, which is an intracellular reductant and has a vital role in protecting cells against the toxic effects of ROS. The amino acids glycine, glutamine, cysteine, and taurine also are involved in the conjugation of foreign substances. A reduction in enzyme quantity often, but not always, results in a lower ability to detoxify certain toxicants. The activity of mixed-function oxidase enzymes is inversely correlated with barbiturate sleeping times in several animal models. In rats, the decrease of serum pentobarbital is directly related to dietary protein concentration ranging from 0 to 50%. On the other hand, protein deficiency decreases the toxicities of substances such as heptachlor, because such substances are metabolized to more toxic products by mixed-function oxidases. Thus, low-protein diets depress cytochrome P450, and the outcome may be either more or less toxicity of the toxicant, depending on whether the products are less or more toxic.
Protein intakes are variable in different parts of the world. Industrial nations consume twice the recommended levels. The answer to the question of whether such consumption is detrimental to health is still being debated. Some stress concern that high-protein diets may increase renal stress and subsequently impair function. Bone demineralization, increased colon cancer because of changes in lower gut bacteria, and obesity are other concerns that may be related to high-protein diets. Also, there is the fear that amino acid supplements may result in amino acid imbalances.
7,12-dimethyl-benz(alpha)anthracene-induced incidences of breast cancer, and a high-protein diet markedly decreases the incidence of gastric cancer induced by the direct-acting carcinogen N-methyl-N¢-nitro-N-nitrosoguanidine (MNNG).
Lipids
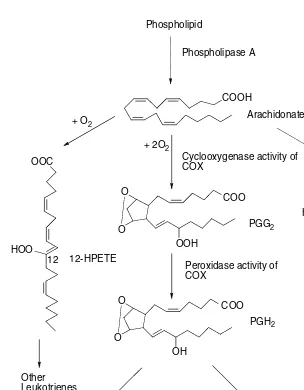
Dietary fats serve various needs. They are sources of concentrated energy. Fats provide the building units for biological membranes. Fats or lipids are sources of essential unsaturated lipid and lipid-soluble vitamins. Animals cannot synthesize fatty acids containing double bonds in either the omega-3 3) or the omega-6 (n-6) position. Both linoleic acid (derived from omega-6, 18:2) and linolenic acid (derived from omega-3, 18:3) are usually consumed with plant products. Linoleic acid is converted by animals to arachidonic acid (20:4, n-6) and linolenic acid to eicosapentaenoic acid (EPA, 20:5, n-3). EPA and arachidonic acid can eventually be converted by various tissue lipoxygenases and cyclooxygenases (COX) to a family compound identified as eicosanoids, e.g., prostaglandins, prostacyclins, thrombox-anes, and leukotrienes. Eicosanoids have profound physiological effects (hormone-like) at extremely low concentrations as well as pharmacological effects at higher concentrations. There appears to be a Yin–Yang relationship between eicosanoids produced from EPA vs. those derived from arachidonic acid. Thus, as shown in Figure 3.2, the oxygenation products of essential fatty acids serve as important communication mediators between cells of the organism. About 30 to 55% of the dry weight of the hepatic endoplasmic reticulum is lipid, comprising cholesterol esters, free fatty acids, triglycerides, cholesterol, and phospholipids. Phosphatidyl-choline content is important because enzymatic degradation of such components with phospholipase C decreases the metabolism of drugs and depresses binding of substrates of mixed-function oxidases. Phosphatidylcholine probably has a role in maintaining membrane integrity, and it is suggested that lack of this substance causes changes in the membrane integrity. Lipid substances, such as steroids and fatty acids, may occupy cytochrome P450–binding sites, thereby displacing exogenous sub-strates and interfering with their metabolism. Feeding diet deficient in linoleic fatty acids depresses the activities of certain toxicant-metabolizing enzymes, and therefore lipid quality is an important factor.
High-fat diets promote the spontaneous incidence of cancer. This may be due, in part, to a low dietary intake of lipotropes. Choline, methionine, glycine, folate, vitamin B12, pyridoxal, polyunsaturated fatty acids, and phosphate make up the dietary lipotropes, which are required for the synthesis of phospholipids and bio-logical membranes. This synthesis is crucial for components of the microsomal mixed-function oxidase system. Dietary deficiencies in the lipotropes choline and methionine lead to a decrease in some cytochrome P450 isomers and to enhanced tumorigenic effects of chemical carcinogens.
Carbohydrates
likely. The effects of dietary carbohydrate manipulation are likely because of gen-eralized effects on intermediary metabolism, such as caloric effects and hormonal alteration effects. Animals use glucose as the principal carbohydrate and the level of blood glucose and amounts available to the animal’s organs are closely regulated. It is well known that when carbohydrate intakes are high, any excess glucose is first converted to glycogen for storage, and when those stores are filled, it is converted to fat, in which form the storage is probably unlimited. When energy is required, glycogen stores are utilized, followed by gluconeogenesis concomitant with mobi-lization of fat stores.
FIGURE 3.2 Oxygenation products of fatty acids.
Phospholipid
Phospholipase A COOH
Arachidonate + 2O2
+ O2
+ O2 OOC
O O
OOH
Cyclooxygenase activity of COX
COO
COO
OOC HOO PGG2
PGH2
5
5-HPETE
Leukotriene A4
Leukotriene C4 Leukotriene D4
Peroxidase activity of COX
O O
OH
Thrombaxanes Prostaglandins
Other Leukotrienes HOO
High intakes of sugars, such as glucose, sucrose, or fructose, increase the duration of phenobarbital-induced sleep in rodents, and the longer sleeping times are corre-lated with a decreased metabolism of the barbiturate. Other studies have found that high-sucrose diets as compared with starch potentiate the lethal reaction to benzyl-penicillin because of lower rates of conversion of its toxic products. Also, rats fed high sucrose or glucose plus fructose have lower levels of biphenyl 4-hydroxylase activity, which is correlated with lower levels of cytochrome P450.
Carbohydrates affect genes because the structure of the genetic material, deox-yribose (DNA) and ribose (RNA), is derived from carbohydrates. Portions of specific biological membranes contain carbohydrate components, such as part of the structure of some receptor sites. Finally, glucose as the precursor of glucuronic acid plays a role in Phase II detoxification reactions, which are crucial to the detoxification process (see later).
In addition, diets contain other carbohydrates such as celluloses and other polysaccharides derived from plant walls. Fiber plays an important role in maintain-ing gastrointestinal tract function and health. Dietary fiber plays a role in the metab-olism and deposition of lipids, and dietary fat and fiber affect chemical-induced colon cancer. Usually, fat has little effect when dietary fiber is high but increases tumor incidences when fiber is low.
Rodents and other animals fed a calorie-restricted diet have a much lower incidence of spontaneous and chemically induced tumors than ad libitum fed animals. For example, 7,12-dimethylbenz(alpha)anthracene failed to induce mam-mary tumors in calorie-restricted rats, even when such diets were high in fat content. Some drug-metabolizing enzymes, such as 4-nitrophenol hydroxylase, are markedly increased (110%) by diet restriction compared with ad libitum fed ani-mals. In addition, calorie restriction increases several phase II enzymes, such as UDP-glucuronyltransferases, glutathione S-transferases, and N-acetyltransferase, which are speculated to be responsible for the decreased incidence of chemical carcinogenesis.
Calorie restriction also has been found to exhibit lower oxygen consumption, increased insulin binding, and alter energy metabolism through changes in enzymes of glycolysis, gluconeogenesis, and lipid metabolism. The combined effect of met-abolic effects and lowered oxidative stress has led to the speculation that calorie restriction may decrease age-associated enzyme degradation. Dietary studies have shown that unrestricted feeding decreases hepatic cytochrome P450, increases afla-toxin B1 activation, increases aflaafla-toxin binding to DNA, and decreases in vivo
detoxification of this carcinogen.
EFFECT OF MICRONUTRIENT CHANGES
Vitamins
Ascorbic Acid
Depressed microsomal oxygenation of many xenobiotics is an essential function of vitamin C. In addition, vitamin C facilitates the elimination of Phase I products by UDPGA-mediated conjugation to glucuronides. Vitamin C deficiency reduces toxicant metabolisms in guinea pigs. Ascorbic acid deficiency affects the liver contents of cytochrome P450 isoforms, CYP1A and CYP2E, which are pivotal in the activation of food carcinogens, aflatoxin B1, and heterocyclic amines. Ascorbic acid decreases covalent binding of reactive intermediates, eliminates free-radical metabolites, and inhibits the formation of nitrosamines from the nitrosation of secondary amines.
Other physiological effects of vitamin C deficiency include poor wound healing and capillary integrity, probably related to the vitamin’s role in collagen formation; decreased immunity; skeletal muscle atrophy; and nervous disorders.
In contrast, there is little information available on the effects of excess ascorbic acid on toxicant metabolism. There is considerable controversy over the efficacy of megadoses beyond the requirement or dietary reference intake (DRI) of ascorbic acid for the prevention and treatment of diseases.
Riboflavin (Vitamin B2)
Because riboflavin is an essential component (prosthetic group) of NADPH–cyto-chrome P450 reductases, such as the cofactors FAD and FMN, a deficiency will adversely affect toxicant metabolism. Also, a lack in riboflavin can result in uncoupling of electron transport and subsequent ROS generation. Deficiencies of riboflavin are associated with symptoms such as dermatitis (alopecia, seborrheic inflammation, epidermal hyperkeratosis, and atrophy of sebaceous glands), ocular problems (cataracts, conjunctivitis, blepharitis), and myelin degeneration (asso-ciated with paralysis).
Folate
Folate is required in toxicant metabolism and chemical detoxification, particularly during induction of oxidases (protein synthesis). Folate deficiency leads to loss of drug metabolism, loss of enzyme induction, hyperchromic anemia, and teratogenic effects in offspring. Birth defects (neural tube) associated with folate deficiency have led to the increased recommendation of the vitamin by the medical community for women of childbearing age. In rats, folate is required for increased turnover of toxicant-metabolizing enzymes during chronic drug administration.
Thiamin (Vitamin B1)