FOOD CONSUMPTION AND NUTRITIONAL STATUS OF BRESTFEEDING MOTHERS AND INFANTS
(Konsumsi Pangan dan St at us Gi zi Ibu Menyusui dan Bayi nya)
Eddy S. Mudjajanto1 and Dadang Sukandar1
ABST RAK konsumsi dan f r ekuensi konsumsi bayi di per ol eh mel al ui wawancar a dengan menggunakan kuesi oner . Dat a ant r opomet r i bayi di per ol eh mel al ui pengukur an yang di l akukan sel ama
Nation building is basically a governmen-tal effort together with its people to improve national welfare. A successful development of a nation is determined by the available human resources. High-quality of human resources are characterized by a strong physical body, resil-ient mind, good health and mastery of science and technology. One indicator to measure the quality of human resources is human develop-ment index (HDI). Three determinant major factors of HDI are education, health and econ-omy. The three factors are closely related to the nutritional status of a community. Malnu-trition leads to a reduced quality of human resources. A lack of nutrition will cause a slow-down of physical growth, mental devel-opment, intelligence, decreased productivity, increased diseases and deaths (Azwar, 2004).
1
Lecturer on Department of Community Nutrition, Faculty of Human Ecology, Bogor Agricultural
Every individual has right to have an ac-ces to adequate, safe and nutritious food so that they are free from hunger. Sufficient food consumption in household will have impact on the nutritional status of the household. Good nutritional status must be supported by ade-quate food consumption. Maxwell and Frankenberger (1992) stated that the nutri-tional status was affected by food consump-tion.
The nutritional status of babies influ-enced by theirs mother. Food consumption of babies depend so much on breastfeeding and supplemental feeding. The breast milk is im-portant for nutrients for babies. Breast milk not only sufficient nutrition for babies but also other factors such as hormone, antibody and growt factors (Walker, 1988).
Goals and Obj ectives
METHODS
Design
This study was a cross-sectional design and conducted in Cianjur Regency at 2006-2007.
Sampling
The populations studied in this research were breastfeeding mothers and 100 breast-feeding mothers were taken. Samples were taken through stratified random sampling. Cianjur District was selected since there were variations in nutrition program implemented and variations in achieving the program objec-tives (Personal Communication with Staff of Health Services, Cianjur, February 10, 2006). The two subdistricts were chosen to increase heterogeneity of samples, so that the per-formance of nutrition program was truly repre-sented by the selected samples.
Data collection
Data collection consisted of food con-sumption, food frequency, and nutritional status. The data was collected through ques-tionnaires, the food consumption was meas-ured using a recall methode of 1 x 24 hour.
Data Analysis and Management
Processing was include editing question-naires, coding, arrangement of file structure, data entry, editing files, raising variables, combining and separating files. Data process-ing and analysis used Excel and Statistical Analysis System.
The estimations of means, standard deviation, minimum and maximum values made for all quantitative variables. The esti-mation of proportion has been conducted for all categorized qualitative and quantitative variables. The predicted results have been presented in the forms of tables and diagrams.
RESULTS
Food Consumption of Breastfeeding Mothers
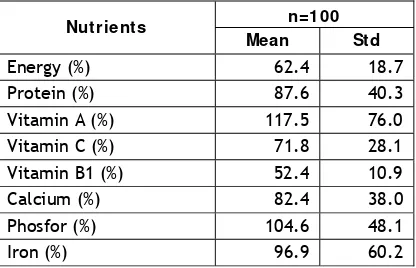
Consumpt ion and Nut rit ion Adequacy Energy. Energy consumption and nutri-tional adequacy level are presented at Tables 1 and 2. It can seen from Table 1 that the average energy consumption of breastfeeding mothers is 1744 kcal/day; however, this only fulfills 60 % of the recommended dietary
al-lowances (RDA) (Table 2). As it occurs among the pregnant women, this low energy con-sumption of breastfeeding mothers is found in various researches on breastfeeding mothers. According to Arisman (2004), if the energy in-take by the women is less than 2700 kcal/day, it indicates that they lack calcium, magne-sium, zinc, vitamin B6 and pholate.
Table 1. Statistics of Nutrients Consumption of Breastfeeding Mothers
Table 2. Statistics of Nutritional Adequacy of Breastfeeding Mothers
Protein. Proteins as the developing sub-stances of new tissues play an important role in all life aspects starting from babies, under-five-year-old children, teenagers, women who are pregnant and breastfeeding to people who are in recovery period (Susmaji, 2004). Con-sumption and protein adequacy level are pre-sented at Tables 1 and 2. From Table 1, it can be seen that the average protein consumption of breastfeeding Mothers is 52.8 g/day. As a whole, this only fulfills 80 % of the recom-mended protein level. This protein usually comes from salty fish.
con-tained in the mothers’ milk is more easily ab-sorbed by babies compared to other food sub-stances so that their calcium need can be sup-plied by the calcium from the breast milk. An-chovies are frequently consumed by women to obtain their calcium possibly because they are available in the markets and more affordable than other animal protein sources.
Phosphor. The average consumption of phosphor is 741 mg/day (Table 1), which al-ready fulfills 105 % of the recommended phos-phor level (Table 2). This consumption varies among the women as shown by the standard deviation of 347 mg/day.
Iron. From Table 1, it can be seen that the average iron consumption is 26.3 mg/day. With the assumption of 10 % iron absorption, the average adequacy level already reaches 97 %.
Vitamin A. The average consumption of vitamin A for the women is 977 ugRE, fulfilling 117 % of the recommended level. This con-sumption varies among the women as shown by standard deviation of 640 mg/day.
Vitamin C. The average consumption of vitamin C for the women is 57 mg/day fulfill-ing 70 % of the recommended level. This con-sumption is relatively the same among the women as shown by standard deviation of 22 mg/day. This low consumption may be caused by a less intake of vegetables and fruits con-taining a lot of vitamin C.
Vitamin B1. The average consumption of vitamin B1 among women is 0.6 mg fulfilling only 52 % of the recommended level. This con-sumption is also relatively the same among the women as shown by standard deviation of 0.14 mg/day. This vitamin is frequently found in cereal products such as rice, bread, noodle, etc. (Arisman, 2004).
Food Consumpt ion Frequency
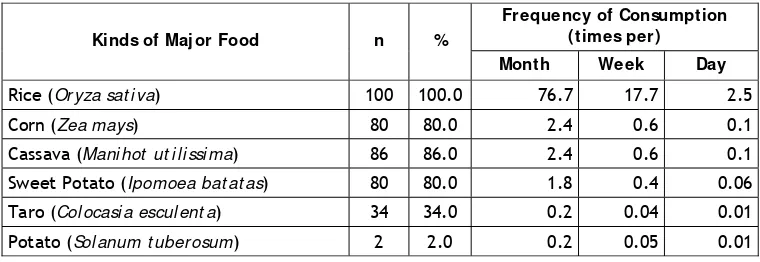
Frequency of Staple Food. This fre-quency is presented to see the women’s eating habits or patterns in the research area. Table 1 shows that one type of cereals and secon-dary food crops that they frequently consume every day or 2 times a day is rice. Rice has been the staple food for Indonesian popula-tion. Corn, cassava, taro, sweet potato and potato are rarely consumed by the women.
Consuming rice is the common eating pattern among Indonesian communities. They have consumed rice since the ancient period, and this habit lasts until now. There are vari-ous factors influencing the communities in consuming rice such as the flavor, socio cul-ture, nutritional value, availability and af-fordability (Ariani, 1998).
Rice is mostly purchased, only a few grow rice and obtain it from their neighbors. Cassava and sweet potato are mostly given by other people.
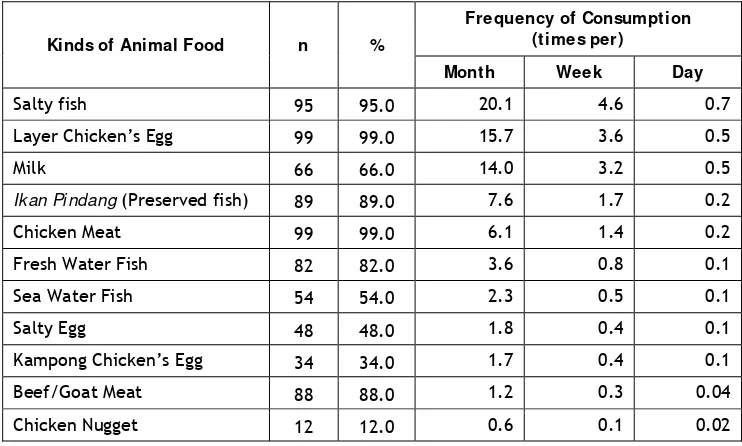
Frequency of Animal Food. The types of foods as animal protein sources such as meat, fish and egg, which are consumed almost every day with the frequency of 0.6 times per day or 3 to 4 times per week by the 90 % breastfeed-ing mothers, include salty fish, eggs, and milk (Table 4). This might be due to their availabil-ity, especially salty fish, eggs of layer chicken, and milk are easier to obtain than other ani-mal protein sources.
The reasons for the higher consumption of eggs of layer chicken than that of eggs of kampong chicken are that they are cheaper and more easily available (Erwidodo, Ariani, Purwoto, 1997). Chicken meat and pi ndang (preserved fish) fish are usually consumed once a week. Other types of animal protein sources are rarely consumed. These kinds of foods are mostly purchased, and only a few of them such as beef/lamb meat and fresh water fish are given by other people.
Table 3. Statistics of Staple Food Consumption Frequency of Breastfeeding Mothers
Table 4. Statistics of Animal Food Consumption Frequency of Breastfeeding Mothers
Kinds of Animal Food n %
Frequency of Consumption (times per)
Month Week Day
Salty fish 95 95.0 20.1 4.6 0.7
Layer Chicken’s Egg 99 99.0 15.7 3.6 0.5
Milk 66 66.0 14.0 3.2 0.5
Ikan Pi ndang (Preserved fish) 89 89.0 7.6 1.7 0.2
Chicken Meat 99 99.0 6.1 1.4 0.2
Fresh Water Fish 82 82.0 3.6 0.8 0.1
Sea Water Fish 54 54.0 2.3 0.5 0.1
Salty Egg 48 48.0 1.8 0.4 0.1
Kampong Chicken’s Egg 34 34.0 1.7 0.4 0.1
Beef/Goat Meat 88 88.0 1.2 0.3 0.04
Chicken Nugget 12 12.0 0.6 0.1 0.02
Frequency of Legumes. Nuts are vege-table protein sources; nevertheless, they are not consumed every day by the breastfeeding mothers (Table 5). Tofu and fermented soy-bean (t empeh) are consumed 3 to 4 times a week by 90% breastfeeding mothers because they are easily obtained and cheap. Most tofu and soybean products are processed by frying them or mixing them with vegetables, or cooking with soybean ketchup. Oncom (tradi-tional Indonesian fermented food), peanut and mung-bean are consumed once a week. Other types of legumes are rarely consumed. These types of foods are 100 % purchased. Almost no women grow the legumes or obtain them from other people.
Frequency of Leaf Vegetable. Vegeta-bles are mineral and vitamin sources beneficial
for the growth and development of their breastfed babies. They provide tasty flavor and satisfaction because of their interesting color, flavor and texture (Muchtadi, 2000).
Breastfeeding mothers rarely consume leaf vegetables (Table 6). Spinach and kang-kung are consumed twice a week whereas sawi, carrot, cabbage and cassava leaf are consumed once a week. According to Rejeki (2000), types of vegetables frequently con-sumed by the households in Indonesia include spinach, cassava leaf, kangkung and genj er.
Spinach, kangkung, sawi, carrot, cab-bage, long bean and mel i nj o leaf are mostly purchased. Cassava and papaya leaves are sometimes purchased or taken from their gar-dens or given by their neighbors.
Table 5. Statistics of Legumes Consumption Frequency of Breastfeeding Mothers
Kinds of Nuts n %
Frequency of Consumption (times per)
Month Week Day
Tofu 98 98.0 16.3 3.7 0.5
Tempeh 97 97.0 14.9 3.5 0.5
Oncom (Traditional Indonesian Fermented Food) 76 76.0 4.1 0.9 0.1
Peanut (Ar achis hypogaea) 76 76.0 3.9 0.9 0.1
Mung-bean (Phaseol us vul gar i s) 81 81.0 4.3 1.0 0.1
Table 6. Statistics of Leaf Vegetables Consumption Frequency of Breastfeeding Mothers
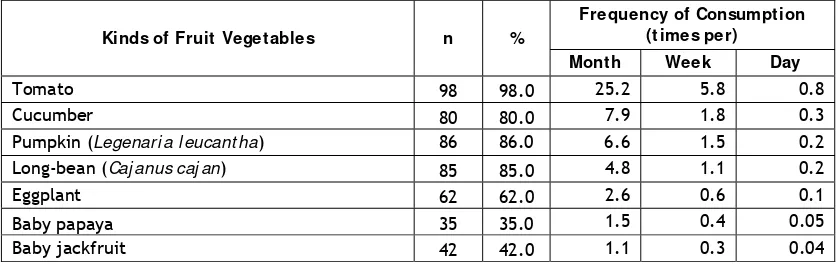
Frequency of Fruit Vegetable. Vegeta-bles are dietary fiber sources and contain a number of antioxidants which have an impor-tant role in maintaining body health (Muchtadi, 2000). These vegetables are rarely consumed (Table 7). Tomato is consumed 5 to 6 times a week or almost every day. Those consumed once a week include cucumber, pumpkin and long bean. In general, the darker the color of the vegetables, the greater the contents of iron and vitamin A will be (Harper, Deaton, & Driskel, 1985). Iron and vitamin A are required by the breastfeeding mothers and their babies to obtain body immunity and eye health.
Fruit vegetables especially pumpkin, tomato, cucumber, eggplant and baby jack-fruit and papaya are mostly purchased by the women (see Appendix 3). There are 5 to 10 % respondents stating that baby jackfruit and papaya are given by other people.
Frequency of Fruit. Fruits are also sources of vitamins and minerals; however, they are not consumed every day by the breastfeeding mothers (Table 8). Fruits con-sumed 2 to 3 times per week include orange
and banana because they are abundantly available (not seasonal fruits) and their prices are affordable. Papaya and guava are con-sumed only once a week
Fruits can be obtained by purchasing or by taking them from their own gardens or get-ting them from other people. Jackfruit and guava are mostly obtained from other people.
Table 8. Statistics of Fruits Consumption Fre- quency of Breastfeeding Mothers
Table 7. Statistics of Fruit Vegetables Consumption Frequency of Breastfeeding Mothers
Frequency of Snack Foods. The snack foods generally contain carbohydrates; how-ever, breastfeeding mothers do not consume them every day (Table 9). Fried snacks and fried banana are frequently consumed i.e. 3 to 4 times per week. Meatball and bakwan are consumed twice a week. Snack foods are gen-erally consumed only as supplementary foods and do not contain sufficient nutritional value. Such snacks as meatball, si omay, fried banana, chicken noodle, and other fried snacks are usually purchased from the small shops or from the traveling salesmen.
Frequency of Miscellaneous Foods. The miscellaneous foods consumed 5 to 7 times per week by the breastfeeding mothers include sugar, tea, and monosodium glutamate (MSG) (see Table 10). Coffee and crackers are con-sumed 4 times a week whereas soybean ketchup and sauce are consumed 1 to 3 times per week. As the snacks, these foods are usu-ally purchased by the women.
Consumpt ion and Nut rit ional Adequacy of Babies
Energy. The first and major food of ba-bies is their mothers’ breast milk containing complete nutrition as well as anti-infection substance for them. Nutrition consumption among babies in this research is exclusively from their mothers because they are only 0 to
11 months old. The consumption and energy adequacy level among babies are presented at Tables 11 and 12.
Table 11. Statistics of Nutrients Consumption of Breastfed Babies
Table 12. Statistics of Nutritional Adequacy of Breastfed Babies
Table 9. Statistics of Snack Foods Consumption Frequency of Breastfeeding Mothers
Kinds of Snacks n %
Table 10. Statistics of Miscellaneous Foods Consumption Frequency of Breastfeeding Mothers
10
The sufficient energy requirement of one year for babies varies according to their age and weight. In general, for their first six month of life, they require 115 -120 kcal/day; however, this requirement will be less, i.e. around 105 to 110 Kcal/day when they are over 6 months old (Arisman, 2004). The aver-age energy consumption is 667 Kcal/day where this has reached 100 % of the recommend en-ergy level (RDA) (Table 12).
Protein. The biological value of moth-ers’ breast milk is higher than other proteins. Based on weight, a baby’s requirement of pro-tein is 2.3 g/kg/day and 2 g/kg/day at the age of less than 6 months and over six months re-spectively (Arisman, 2004).
From Table 11 and 12, it can be seen that the average consumption of protein is 14.5 g/day, and this has fulfilled 106% of the recommended protein level.
Calcium. Calcium is very crucial for ba-bies’ growth especially for bone and tooth formation. The consumption is relatively suffi-cient, i.e. 388 mg/day, and this has met 113 % of the recommended calcium level (Table 12).
Phosphor. Phosphor is also crucial for the physical growth of babies. As a whole, the consumption of phosphor is 613 mg/day, and this has met 279 % of the recommended phos-phor level.
Iron. Consumption and iron (Fe) ade-quacy level of the infants are presented at Table 11 and 3.22. From Table 11, it can be seen that the average consumption of protein
is 4.9 g/day. With the assumption of 15 % iron absorption, the adequacy level of iron for ba-bies has exceeded the recommended level.
Vitamin A. In general, the average con-sumption of vitamin A is 496 ugRE or has reached 114 % of the recommended vitamin A level. The consumption relatively varies as shown by the standard deviation of 413 mg.
Vitamin C. In general, the average con-sumption of vitamin C is 38 mg and has ex-ceeded the recommended vitamin C level.
Vitamin B1. As a whole, the average vitamin B1 consumption of the infants is 0.20 mg or only fulfills 59% of the recommended vitamin B1 level. The consumption is relatively the same as shown by the standard deviation of 0.16 mg.
Nutritional Status of Breastfeeding Mothers and Infants
Nut rit ional St at us of Breast f eeding Mot hers
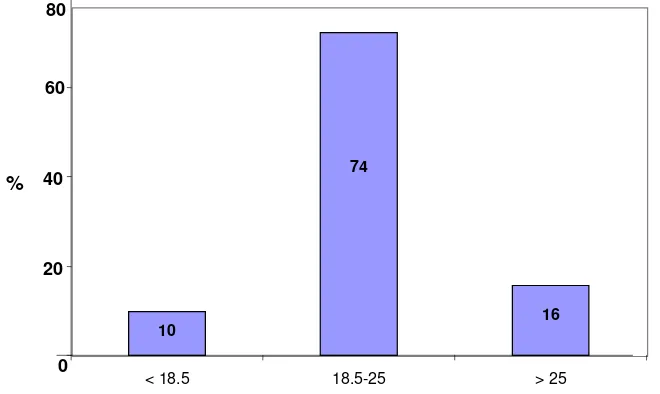
The nutritional status of breastfeeding mothers is determined by using the body mass index (BMI), which is then classified according to WHO categories (1995). Based on the data presented in Figure 1 and Table 13, the prevalence of breastfeeding mothers in the thin category is 10%. The low BMI is signifi-cantly related to the quantity and quality of breast milk and the problem of infant’s growth. The breastfeeding mothers also suffer from over nutrition. The prevalence of over-weight (BMI>25) breastfeeding mothers is 16%.
Table 13. Distribution of Breastfeeding Moth- ers based on IMT Category
IMT Category IMT
Value n %
Thin < 18.5 10 10.0
Normal 18.5-25 74 74.0
Overweight >25 16 16.0
Nut rit ional St at us of Infant s
Anthropometric Characteristics. These characteristics, consisting of age, body weight, and height, are presented in Table 14. The average age of infants in the research location on the whole is 5.83.1 months, with the low-est of 1 month and the highlow-est of 11 months. On the whole, the average bodyweight of in-fants is 6.81.5 kg, with the lowest weight of 3.5 kg and the highest weight of 10.0 kg. The average body length of infants as a whole is 62.27.0 cm, the lowest length of 45.5 cm and the highest of 80.0 cm.
Table 14. Statistics of Breastfed Infants’ An- thropometric
Characteristics Mean Std Min Max Age (month) 5.8 3.1 1.0 11.0 Weight (kg) 6.8 1.5 3.5 10.0 Height (cm) 62.2 7.0 45.5 80.0 Weight for Age (W/ A). The prevalence of malnutrition is determined based on the number of children whose anthropometric in-dex is below -2 SD (Jahari, 2002). The weight
for age (W/A) shows a generally hindered growth, but less specific for identifying a chronic and acute malnutrition problem. Based on the resulted calculation of Z-score of W/A for infants with the threshold point of - 2SD for underweight, the underweight preva-lence is found to be 8.5% (Table 15), including the prevalence of sever e under wei ght (Z-score <- 3 SD), i.e. 4.1%. The prevalence of over-weight infants is very low, i.e. 1.1 %.
Table 15. Distribution of Breastfed Infants according to W/A Z-score
W/ A Z-score n %
Z<-2 8 8.5
Normal 85 90.4
Z>+2 1 1.1
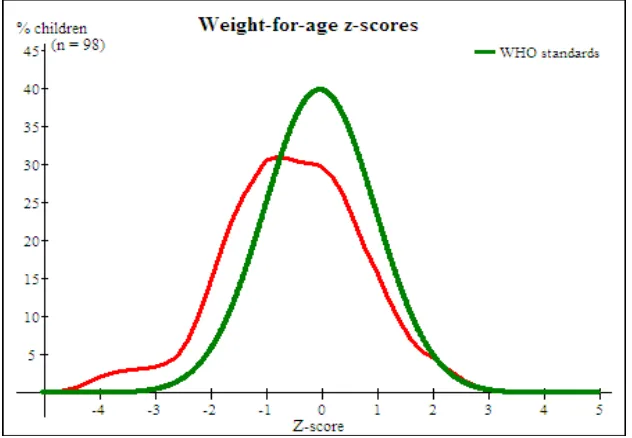
From Figure 2 it is clearly seen that the median Z-score of W/A for the children in the research location is further away to the left than the WHO standard of 2005. The median Z-score for the children in this area is ap-proaching the standard deviation of -0.5.
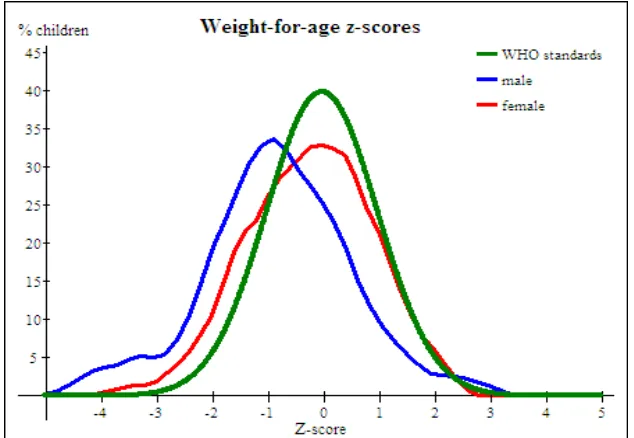
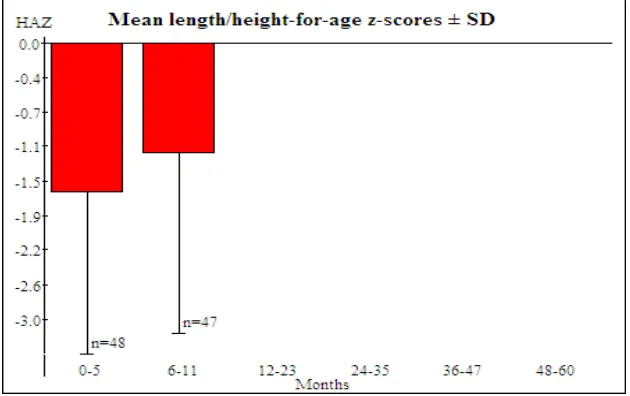
The gender-based analysis shows the curve of the Z-score for male infants is worse than that for female infants (see Figure 3). The underweight prevalence among male in-fants is 10.9 %, which is much higher than that among female infants (5.8 %). In terms of age groups from Figure 6.4 it can be seen that the Z-score of W/A is almost the same between the age groups of 0-5 months and of 6-11 months.
Figure 3. Distribution of Breastfed Infants based on W/A Z-score and Sex
Figure 4. W/A Z-score Value of Breastfed Infants based on Age Group
Height for Age (H/ A). In the first year of living, the height of infants increase by 50%, but it does not double as age increases until the age of 4 years. The stunted prevalence as a whole is 45.7%. This prevalence is ap-proaching the stunted prevalence in Indonesia 5-6 years ago.
The prevalence of sever e st unt ed (with the criteria -3 SD) among infants is 21.1%. From Figure 5, it is clearly seen that the me-dian Z-score of H/A among children in the re-search location is much further to the left than NCHS/WHO standards. The median
Z-score of H/A for children in this area has ex-ceeded the standard deviation of -2 or st unt -i ng.
Table 16. Distribution of Breastfed Infants according to H/A Z-score
H/ A Z-score n %
Z<-2 43 45.7
Normal 47 50.0
Figure 5. Distribution of Breastfed Infants based on H/A Z-score
Figure 6. Distribution of Breastfed Infants based on H/A Z-score and Sex
The gender-based analysis shows that the curve for the Z-score of H/A among the boys is worse than that among the girls (see Figure 6). Stunted prevalence among male in-fants (59.1 %) is higher than it is among female infants (33.3 %). From Figure 7 it can be seen that the Z-score of H/A is worse in the age group of 0-5 months than in the age group of 6-11 months.
Weight for Height (W/ H). This index shows the picture of an acute problem of nu-trition (Jahari, 2002). Based on the resulted calculation of the Z-score for W/H index with the criteria of wast ed < -2 SD, wasted preva-lence is found to be 9.6 % among infants (Ta-ble 17). The prevalence of sever e wast ed
(Z-score <-3 SD) in this research is quite low, i.e. 7.9 %.
Table 17. Distribution of Breastfed Infants according to W/H Z-score
W/ H Z-score Category n %
Z<-2 9 9.6
Normal 59 62.8
Z>+2 26 27.7
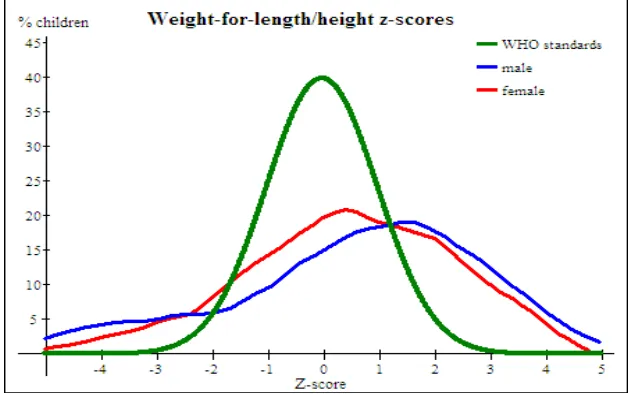
From Figure 8 it is clearly seen that the curve for Z-score of W/H among infants in the research location is wider than the WHO stan-dard of 2005. The median Z-score of W/H for infants in this location is getting closer to the standard deviation of 0.5.
Figure 8. Distribution of Breastfed Infants based on W/H Z-score
Figure 10. W/H Z-score Value of Breastfed Infants based on Age Group
The gender-based analysis indicates that the curve for the Z-score of W/H among fe-male infants is slightly worse than it is among male infants (see Figure 9). The wasted prevalence among male infants (12.8 %) is higher than that among female infants (8.0 %). Figure 10 shows that the Z-score of W/H for the age group of 0-5 months is better than that for the age group of 6-11 months.
CONCLUSION AND RECOMMENDATION
Conclusion
The energy and protein consumption of breastfeeding mothers reaches only 60 % and 87 % of the RDA, the average consumption of energy and protein among infants is 100 % and 106 % of the RDA respectively.
The prevalence of breastfeeding mothers in the thin category is 10%. The breastfeeding mothers also suffer from over nutrition. The prevalence of overweight (BMI>25) breast-feeding mothers is 16%. Based on the resulted calculation of Z-score of W/A for infants with the threshold point of - 2SD for underweight, the underweight prevalence is found to be 8.5%, including the prevalence of sever e under wei ght (Z-score <- 3 SD), i.e. 4.1%. The prevalence of overweight infants is very low, i.e. 1.1%. Based on the resulted calculation of the Z-score for H/A the height of infants in-crease by 50%. The stunted prevalence as a whole is 45.7%. The prevalence of sever e st unt ed (with the criteria -3 SD) among in-fants is 21.1 %. Based on the resulted calcula-tion of the Z-score for W/H index with the cri-teria of wast ed < -2 SD, wasted prevalence is
found to be 9.6 % among infants. The preva-lence of sever e wast ed (Z-score <-3 SD) in this research is quite low, i.e. 7.9%.
Recommendationn
1. The energy and protein consumption of
breastfeeding mothers must be increased to fulfill of the recommended dietary al-lowances.
2. Because the mother’s milk is very impor-tant for babies, so the breastfeeding mother must give a good breastfeeding practice for the period of six months fol-lowed by the introduction of other foods. This is important to improve/maintain good nutritional status of babies.
ACKNOWLEDGEMENT
Appreciation and gratitude to the Neys-van Hoogstraten Foundation (NHF), the Neth-erlands for supporting and funding this re-search. And thank you to other research team Ali Khomsan, Hadi Riyadi, and Faisal Anwar from Department of Community Nutrition, Faculty of Human Ecology, Bogor Agricultural University.
BIBLIOGRAPHY
Arisman. 2004. Nutrition in Life Cycles: Text Book of Nutrition Science. Medical Book Publisher EGC. Jakarta.
Azwar A. 2004. Aspects of Health and Nutrition in Food Security. Paper of National Workshop on Food and Nutrition 2004. LIPI (Indonesian Institute of Science). Jakarta.
Erwidodo, M Ariani & A Purwoto. 1997. Con-sumption Development and Project- ion of Rice Demand in Indonesia. Journal of Agro Economy, 16 (1 & 2), 60-67.
Harper IJ, BJ Deaton, & JA Driskel. 1986. Food, Nutrition, and Agriculture (Suhardjo, translator) (2nd Ed.). UI Press, Jakarta.
Jahari AB. 2002. Manual Book of Nutritional Status Evaluation Methods. Centre of Food and Nutrition Research – Research and Development Agency, Department of Health, Republic of Indonesia, Jakarta.
Maxwell S & TR Frankenberger. 1992. House-hold Food Security: Concepts, Indicators, easurements, A Technical Review. Rome: International Fund for Agricul-tural Development/United Nations Chil-dren’s Fund.
Muchtadi D. 2000. Vegetables as Sources of Fibre and Antioxidants: Preventing of Degenerative Diseases. Faculty of Agri- cultural Technology, Bogor Agricultural University (IPB), Bogor.
Rejeki AS. 2000. Food Habits of Vegetable Consumption on Girl Teenager in Urban Area. Undergraduate script (unpublish- ed). Department of Community Nutrition and Family Resources, Faculty of Agriculture, Bogor Agricultural University (IPB), Bogor.
Susmaji K. 2004. Energy Consumption, Protein, and Nutritional Status of 1st Grade Students of Elementary School in Poor and Non-Poor Village of Payakumbuh Sub-district, Lima Puluh Koto Regency, West Sumatera Province. Undergraduate script (unpublished). Department of Community Nutrition and Family Resources, Faculty of Agriculture, Bogor Agricultural University (IPB), Bogor.