Jejak Vol 11 (1) (2018): 189-206 DOI: https://doi.org/10.15294/jejak. v11i1.12385
JEJAK
Jurnal Ekonomi dan Kebijakan
http://journal.unnes.ac.id/nju/index.php/jejak
Effectiveness of Monetary Policy Transmission Mechanism in
Indonesia
Ripdian Nisa M. N1,Banatul Hayati2, Edy Yusuf A. G3
123Faculty of Economics and Business, Diponegoro University, Semarang
Permalink/DOI: https://doi.org/10.15294/jejak. v11i1.12385
Received: October 2017; Accepted: January 2017; Published: March 2018
Abstract
This research aimed to analyse monetary mechanism effectivity to manage inflation in Indonesia through interest rate channel, credit channel, and expectation inflation channel. The research used Vector Error Correction Model (VECM) to analyze effectiveness of monetary policy transmission mechanism in Indonesia. The most effective channel was measured by result of Impulse Response Function and Variance Decomposition. They are: (1). The fastest time lag needed since the shock of monetary instruments (rSBI) until the realization of final target of monetary policy (inflation). (2). How strong the variables in each channel response the shock of SBI interest rate and other variable. The data used in this research is quarterly time series dara from 2005Q1 until 2016Q4. The results of this research show that the most effective channel in managing inflation during 2005Q1 until 2016Q4 is inflation expectation channel.
Key words : Inflation Rate, Monetary Policy Transmission Mechanism
How to Cite: Mentari N, R., Hayati, B., & A G, E. (2018). Effectiveness of Monetary Policy Transmission Mechanism in Indonesia. JEJAK: Jurnal Ekonomi dan Kebijakan, 11(1), 189 -206. doi:https://doi.org/10.15294/jejak. v11i1.12385
© 2018 Semarang State University. All rights reserved Corresponding author :
Address: Jl. Prof. Soedarto SH Tembalang, Semarang E-mail: [email protected]
190 Ripdian Nisa M N, et al., The Most Effective Channel
INTRODUCTION
The impact of monetary policy implementation on inflation is not immediate, but there is time lag through the monetary policy transmission mechanism. The effectiveness of the path of monetary policy transmission mechanism is important. It is to find out how strong and the length of grace period of each transmission line works. The effectiveness of the Monetary Policy Transmission Mechanism (MTKM) is measured by two indicators: first, how fast it is (time lag), second, how strong the variable power in determining economic variable and which financial variables which are the strongest to be leading indicator of inflation movement and the operational target of monetary policy are (Warjiyo, 2004).
The changes in financial and banking sector also greatly affect the speed of monetary policy transmission. A substantial decrease of BI rate will be slowly responded by banks to avoid economic risks. When banks consolidate to improve their capital, the decline in lending rates may not necessarily be responded by increasing credit distribution which will lead to instability. Therefore, the control of inflation requires the active role of banking sector, the financial sector and the real sector in determining whether the monetary policy transmission process is in line with the central bank's target or not (Sir, 2012).
Bank Indonesia uses the BI rate instrument as the main target to achieve the ultimate goal of inflation. The mechanism of working the change in BI rate which affects inflation is called the monetary policy transmission mechanism (MTKM) (Yusuf,
2014). Based on the current phenomenon and trends which are characterized by the
increasing effectiveness of banking intermediation function, the increasing of bank credit in the business world, and a better formation of inflation expectation, it is necessary to analyze MTKM interest rate, credit line and inflation expectation path.
Then, several previous studies have shown different outcomes about which path is most effective in influencing inflation. Alfian (2011) concludes that the interest rate channel did not effectively reach the target between monetary policies in Indonesia during the period 2005: 07 - 2010: 06. While Natsir (2009a, 2009b) concludes that the channel rate channel path and inflation expectation path effectively reached the final target of monetary policy in 1990: 2 - 2007: 1. Again, Wulandari (2012) finds that the interest rate path is more effective for controlling inflation, while the credit line is more effective to influence economic growth. Regarding to previous researches above, the research gaps indicate that a research on which paths are most effective in MTKM is still relevant to do. Therefore, this study would like to re-examine which path is most effective among the interest rate, credit line and inflation expectations line in achieving the inflation target in Indonesia during the period 2005Q1 - 2016Q4.
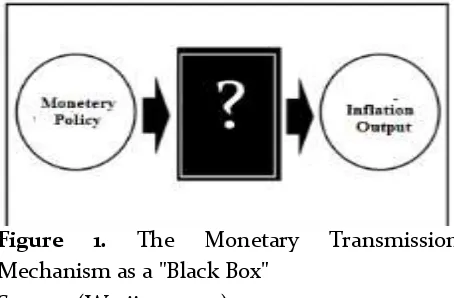
Figure 1. The Monetary Transmission
191 JEJAK Journal of Economics and Policy Vol 11 (1) (2018) : 189-206
As well as a roadmap, the Monetary Policy Transmission Mechanism (MTKM) demonstrates a process of how the monetary policy adopted by the central bank influences various economic and financial activities which are going to be achieved, namely price stability and economic growth (Warjiyo, 2004).
Figure 1 shows a black box which is a monetary policy transmission mechanism, the paths which monetary policy passes through to affect the ultimate goal of inflation. These lines include interest rate, credit, exchange rate, and asset price and inflation expectation path.
Furthermore, the interest rate applicable to each sale of SBI is determined by market mechanism based on the auction system. Since early July 2005, BI announced the target of its interest rate of SBI for auction at a certain period which is called ad BI rate. Then, it becomes the reference of market participants in following the auction. In February 2008, the operational targets of monetary policy (refinement of the Inflation Targeting Framework) were reflected in the development of the Overnight Interbank Money Market Rate (PUAB O/N). The movement of PUAB interest rate is expected to be followed by the development of deposit interest rate and then affect the interest rate of credit (Alfian, 2011).
The relationship between operational and the ultimate goals of monetary policy is indirect, complex and it requires a long time lag. Central bank monetary experts and practitioners designed simple rules to assist in the implementation of monetary policy by adding an indicator called intermediate objectives.
The target which is well known is the money offer or money supply which is measured by one of the monetary aggregates (Alfian, 2011). The ultimate goal of monetary policy in Indonesia refers to Article 7 paragraph (1) of Law Number 3 of 2004 which explicitly states that the ultimate goal of monetary policy is to achieve and maintain stability of Rupiah (monetary stability in the case of low and stable inflation and non volatile exchange rate ) (Warjiyo quoted by Alfian, 2011).
When BI raises the SBI rate, the increase will encourage the rise of interbank money market rate, deposit rate, bank credit, asset prices, exchange rates and inflation expectations in society. This development reflects the operation of monetary transmission lines which will subsequently affect consumption, investment, exports and imports which are components of external demand and aggregate. The operational framework of interest rate lines emphasizes that monetary policy is influenced by changes in interest rates. The main focus of this pathway is short-term interest rate changes that then in the long run affect investment and consumption, which will drive aggregate demand and be able to achieve the ultimate goal of inflation.
Meanwhile on the credit lines, the policies which are in order to influence aggregate demand are based on quantity or availability of credit. A monetary policy will encourage asset prices, so the value of collateral that backs up a guarantee will be affected and will eventually change the borrower's access to the bank. Futher, the investment activity increases as well as the output and there will be an increase in aggregate demand.
192 Ripdian Nisa M N, et al., The Most Effective Channel
influence the formation of inflation and economic expectations. It can then be a consumption and investment decision which in turn will drive changes in aggregate demand and inflation. The operational framework of the asset price path emphasizes changes in asset prices and public wealth and
will affect investment and
consumption.While the exchange rate emphasizes the importance of changes in the price of financial assets in the form of foreign exchange in various economic activities.
This study aims to analyze the effectiveness of MTKM through Interest Rate Line, Credit Line and Expectation Line Inflation. In the interest rate channel, expansionary monetary policy causes a decline in real interest rates. The expansive monetary policy by raising the SBI interest rate will be followed by an increase in the interbank money market rate which is then responded by decreasing output gap and inflation.
On credit lines, banks have a special role in the financial system because they are able to overcome asymmetric information problems in credit markets. The expansive monetary policy by raising the SBI interest rate will be followed by an increase in bank reserves which is then responded by increasing credit disbursement and output gap so that it will raise the inflation rate. On the inflation expectations line, monetary policy changes through monetary policy instrument shock (rSBI) may affect public inflation expectations toward inflation targets. Again the expansive monetary policy by raising the SBI interest rate will be responded by the strengthening of the exchange rate (appreciation), so that inflation rises.
The effectiveness of MTKM whish is measured by two indicators will respond to the shock of monetary policy instruments, namely the Interest Rate of Bank Indonesia Certificates (rSBI) and other variables until the ultimate goal of monetary policy is realized. Both indicators are obtained from Impulse Response Function (IRF) Test and Variance Decomposition (VD) Test
RESEARCH METHODS
This study used Vector Autoregression Model (VAR) which assumes that all equality models are endogenous, then it is estimated simultaneously (Gujarati, 2004). The estimation used unrestricted VARs if the data in the variable indicated stationary at a current level, or use VAR indifference if the data were arnon-stationary but not integrated on the same degree. If the data on all non-stationary variables but occured cointegration on the same degree then the model estimation used Vector Error Correction Model (VECM).
If the VAR model can be written as follows:
Z_t= ∑_(i=1)^kΠ_1 Z_(t-i)+u_t...(1)
Based on equation (1), the first-difference form for VECM estimates would be as follows:
〖ΔZ〗_t= Π_i Z_(t-i)+∑_(i=1)^(k-1)Γ_i 〖ΔZ〗
_(t-1)+u_t ...(2)
Notes:
〖ΔZ〗_(t-1) : First-difference vector matrix
Π : Cointegrating matrix vector x matrix coefficient
Γ_i : Coefficient matrix u_t : Vector error matrix
193 JEJAK Journal of Economics and Policy Vol 11 (1) (2018) : 189-206
introduced by Engle and Granger (1983). The objective of VECM is to correct short-term disequilibrium against the long-term. Furthermore, VECM will reset long-term behavioral relationships between variables in order to be convergent into cointegration relationships but still allow short-term changes.
This study used ten variables consisting of one dependent variable and nine independent variables with research period about 2005 quarter 1 to 2016 quarter 4. The data used comes from Indonesian Economic and Financial Statistics (SEKI), BI Annual Report, IMF Financial Statistics, and Indonesian Banking Statistics. The variables used in this research are:
Inflation (INF) which is based on the CPI measured in percent units. Interest rate of Bank Indonesia Certificates (rSBI) which is the interest rate imposed by BI on the
issuance of SBI’s measured in percentage
units. Interbank Money Market interest rate (rPUAB) which is the interest rate charged by the bank to another which do the loan measured in percent units.
Deposit interest rate (rDEPO) which is the interest given as a consideration for the customer who keeps the money in the bank as measured in percentage units.
The loan interest rate (rKRDT) which is the price to be paid by the borrower's customer to the bank which is measured in percentage units. Inflation expectations (SKDU) that is one of the indicators of inflation expectations that have information on the price level measured in percent units. Bank reserves (CB) which is part of the bank's assets in the form of a liquid instrument to face the possibility of customer
account withdrawal as measured in billion rupiah. Loans (KRDT) which are loans extended by commercial banks to various economic sectors (third parties or other banks) measured in billion rupiah.
The exchange rate (ER) that is the price of a foreign currency (US dollar) in the domestic currency as measured in thousands of rupiah. Output Gap (OG) that is the difference between actual GDP and potential GDP. Potential GDP is proxyed from actual GDP trends calculated by the Hodrick-Prescott Filter (HPF) method measured in billion rupiah.
The equation model of interest rate, credit line and inflation expectation path (Appendix A) in this study are estimated using Vector Error Correction Model (VECM) analysis tool which requires some tests such as: Stationarity Test (Root Unit Test), Granger Causality Test, Cointegration Test (Johansen Method), Lag Determination (Optimal Lag) and Model Stability Test. Furthermore, to test the effectiveness of MTKM, this study used Impulse Response Function (IRF) analysis and Variance Decomposition (VD) analysis..
RESULTS AND DISCUSSION
194 Ripdian Nisa M N, et al., The Most Effective Channel
The interest rate transmission process takes approximately 47 quarters to get back to the initial equilibrium point before the shock on the SBI rate (IRF test result). The variable that has the greatest influence in the interest rate channel is the PUAB interest rate (from 10.65% in the event of SBI rate shock to 19.79% in the fifty-fifth period). This result indicates that PUAB interest rate has a strong relationship with SBI interest rate, so that PUAB interest rate fulfills the requirement as operational target of monetary policy to reach the final target that is inflation.
These results are in line with Warjiyo's (2003) study which suggests that the monetary policy transmission mechanism through the interest rate channel emphasizes that monetary policy can affect aggregate demand through interest rate changes. Natsir's research (2009b), Maski (2005), Yusuf (2014), Dyahningrum (2016), and Judge (2001) prove that MTKM in Indonesia through effective interest rate and the role of interbank interest rate has a strong influence on long-term interest rate deposit rates and as operational targets.
In addition, the results of this study show the transmission mechanism on the credit line which can be explained as follows: the transmission begins from changes in the SBI rate responded by changes in deposit rates and bank reserves.
Changes in bank reserves affect the size of the loans granted by the bank. Meanwhile, the influence of deposit and lending rates has an impact on consumption and investment as deposit rates represent components of community income and lending rates as consumption financing. Loan interest rates are also a component of capital costs for the amount of investment.
The influence of interest rates on consumption and subsequent investments will have an impact on the amount of aggregate increases. If aggregate demand is not balanced with aggregate supply, an output gap will occur. Eventually, the output gap pressure will affect the inflation rate.
Moreover, the credit line transmission process takes approximately 36 quarters to get back to the initial equilibrium point before the shock on the SBI rate (IRF test result). The variable that has the greatest influence in the credit line is the deposit rate (from 0.038% in the event of the shock of the SBI interest rate to 45.82% in the next fifty quarters). These results indicate that the deposit rate has a strong relationship with the SBI rate so that the deposit rate meets the requirements as the operational target of monetary policy to reach the final target of inflation.
There are several other studies which focus on monetary policy transmission mechanisms through credit lines affecting the real sector, such as Oliner's (1996) research which finds that credit lines are more relevant for developing countries because they are based on premises, as well as the researches conducted by Azali (1999) with a case study in Malaysia, and Ramlogan (2007) in Trinidad and Tobago. For more, Nuryati (2004) and Wulandari (2012) studies with case studies in Indonesia note that credit lines play an important role in MTKM in maintaining inflation, while credit lines effectively affect economic growth.
195 JEJAK Journal of Economics and Policy Vol 11 (1) (2018) : 189-206
also become the nominal anchor for the perpetrators business activities in creating business planning. Changes in SBI interest rate policy instruments will also affect the stability of the domestic currency exchange rate. The higher the domestic interest rate will attract capital inflow so that the appreciation of the rupiah, and vice versa. Exchange rate changes will respond to changes in inflation expectations by economic actors. If inflation expectations do not match with the exchange rate, it will result the output gap. In addition, the change in output gap affects the ultimate goal of monetary policy (inflation).
The process of transmitting the inflation expectation path takes approximately 34 quarters to get back to the initial equilibrium point before the shock on the SBI rate (IRF test result). The variable that has the greatest influence in the inflation expectation path is the deposit rate (from 0.056% in the event of SBI rate shock to 10.58% in the next fifty quarters). These results indicate that the deposit rate has a strong relationship with the SBI rate so that the deposit rate meets the requirements as the operational target of monetary policy to reach the final target of inflation.
Several other studies focusing on monetary policy transmission mechanisms through credit lines affecting the real sector such as Oliner's (1996) research find that credit lines are more relevant for developing countries because they are based on premises, another research conducted by Azali (1999) with a case study in Malaysia , and Ramlogan (2007) with case studies in Trinidad and Tobago. Nuryati (2004) and Wulandari (2012) studies with case studies in Indonesia found that credit lines play an important role in
MTKM in maintaining inflation, while credit lines effectively affect economic growth.
The result of the research shows that the transmission mechanism in the inflation expectations path which can be explained as follows: the transmission begins from the shock of SBI rate instrument announced by Bank Indonesia to the public which is expected that it can influence inflation expectation toward the inflation target and also become the nominal anchor for the perpetrators business activities in making business planning. Changes in SBI interest rate policy instruments will also affect the stability of the domestic currency exchange rate. The higher the domestic interest rate will attract capital inflow so that the appreciation of the rupiah, and vice versa. In addition, the exchange rate changes will respond to changes in inflation expectations by economic actors. If inflation expectations do not match with the exchange rate, it will result in output gap. Further, the change in output gap affects the ultimate goal of monetary policy (inflation).
196 Ripdian Nisa M N, et al., The Most Effective Channel expectations among others was conductd by
Anwar (2008). Since the ITF was occured, market participants have started to follow inflation target set by the government and BI. People increasingly have a rational expectation, so any announcement of government policy and Bank Indonesia is able to influence expectations directly and thereby reduce inflation without necessarily causing a recession. Research of Ranchhod (2003), Tjahjono and Purwato (2012) and Natsir (2009a) found that the transmission of monetary policy through the inflation expectations path is effective in controlling inflation. Some statistical tests performed include stationary test, granger causality test, cointegration test and optimum lag determination presented in the following discussion: The stationarity test is performed according to the shape of the trends which contained in each variable.
The result of the ADF stationarity test is influenced by the length of slowness that can be done through the criteria of Akaike Information Crirterion (SIC) or with other criteria. In determining whether stationary time series data or not is by comparing the
statistical value of ADF test with the critical value of MacKinnon statistical distribution.
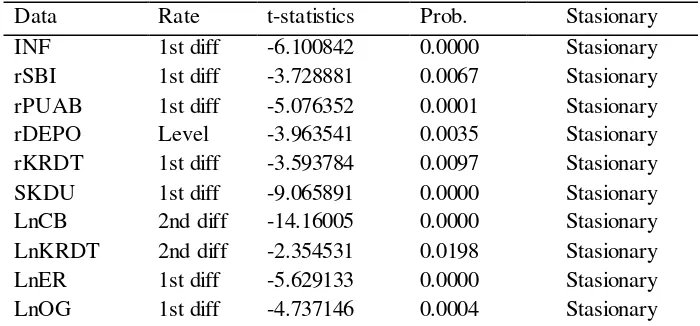
If the absolute value of ADF is statistically greater than MacKinnon Critical Value, it can be concluded that the series data is stationary. Conversely, if the absolute value of the ADF is statistically smaller than the critical value of the MacKinnon distribution, the time series data is not stationary at a real 5% level. Time series data from root unit test results show seven of ten stationary variables at first-difference level, two stationary variables at the second-difference level and one variable have been stationary at current level. That is, the time series data can continue for cointegration testing.
The optimum lag is a way to choose how much lag we use in the research before performing cointegration tests, granger causality test, VAR and VECM. Its objective is to know how long it takes a variable to respond to changes in other variables. In VAR or VECM analysis, it is necessary to firstly determine the optimal lag length, because VAR or VECM analysis is very sensitive to the length of the data lag used. Indeed, the lag used in this study is four in accordance with the lowest value of Akaike Information Criteria (AIC).
Table 1. Root Unit Test Results
Data Rate t-statistics Prob. Stasionary
INF 1st diff -6.100842 0.0000 Stasionary
rSBI 1st diff -3.728881 0.0067 Stasionary
rPUAB 1st diff -5.076352 0.0001 Stasionary
rDEPO Level -3.963541 0.0035 Stasionary
rKRDT 1st diff -3.593784 0.0097 Stasionary
SKDU 1st diff -9.065891 0.0000 Stasionary
LnCB 2nd diff -14.16005 0.0000 Stasionary
LnKRDT 2nd diff -2.354531 0.0198 Stasionary
LnER 1st diff -5.629133 0.0000 Stasionary
LnOG 1st diff -4.737146 0.0004 Stasionary
197 JEJAK Journal of Economics and Policy Vol 11 (1) (2018) : 189-206
The cointegration test is performed to find out if each variable in the equation has a long-term relationship or not. Before conducting a cointegration test, deterministic criteria are determined based on the AIC and
SIC criteria to obtain an appropriate cointegration model. Furthermore, the Johansen cointegration test is performed by comparing the value of trace statistic or maximum eigenvalue which is smaller than the value of critical value, as the result the data has short-term balance.
Table 2. Granger Level Pathway Causality Test
Source: Primary Data, processed
Then, the test of causality between variables is intended to know and prove the direction of short-term relationships between variables (Widarjono, 2016). The granger causality test in the study is divided into three transmission mechanisms, namely the interest
rate path, credit line and inflation expectations path.
Table 2 shows that the relationship between rSBI and rPUAB variables, rPUAB and rDEPO, LNOG and rKRDT, and rSBI and INF is a one-way relationship.
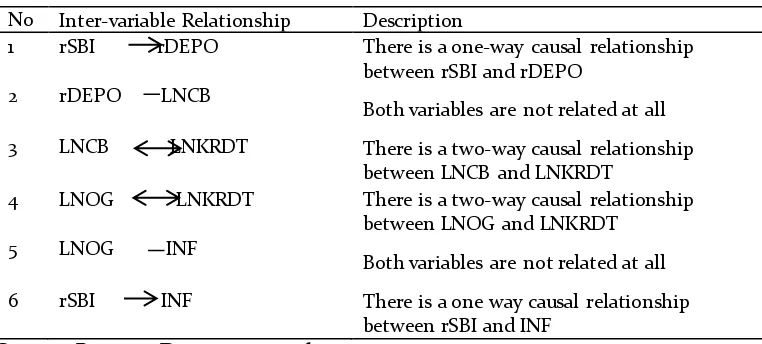
Table 3. Credit Line Granger Causality Test
No Inter-variable Relationship Description
1 rSBI rDEPO There is a one-way causal relationship
between rSBI and rDEPO
2 rDEPO LNCB
Both variables are not related at all
3 LNCB LNKRDT There is a two-way causal relationship
between LNCB and LNKRDT
4 LNOG LNKRDT There is a two-way causal relationship
between LNOG and LNKRDT 5 LNOG INF
Both variables are not related at all
6 rSBI INF There is a one way causal relationship
between rSBI and INF
Source: Primary Data, processed
No Inter-variable Relationship Description
1 rSBI rPUAB There is a one way causal relationship between
rSBI and rPUAB
2 rPUAB rDEPO There is a one-way causal relationship between
rPUAB and rDEPO 3 rDEPO rKRDT
Both variables are not related at all
4 LNOG rKRDT There is a one-way causal relationship between
LNOG and rKRDT
5 LNOG INF Both variables are not related at all
6 rSBI INF There is a one way causal relationship between
198 Ripdian Nisa M N, et al., The Most Effective Channel
While there is no relation at all in the causality test between rDEPO with rKRDT
and LNOG with INF. It means that there is no interdependence (no causality).
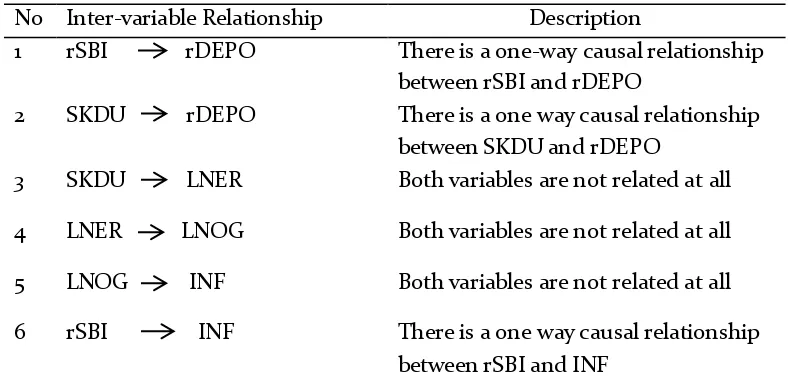
Table 4. Granger Causality Test of Inflation Expectation Path No Inter-variable Relationship Description
1 rSBI rDEPO There is a one-way causal relationship between rSBI and rDEPO
2 SKDU rDEPO There is a one way causal relationship between SKDU and rDEPO
3 SKDU LNER Both variables are not related at all
4 LNER LNOG Both variables are not related at all
5 LNOG INF Both variables are not related at all
6 rSBI INF There is a one way causal relationship between rSBI and INF
Source: Primary Data, processed
Table 4 shows that the relationship between rSBI and rDEPO, SKDU with rDEPO, and rSBI with INF is a one-way relationship. While the causality test between SKDU and LNER, LNER with LNOG, and LNOG with INF, there is no relationship between the two variables. In brief, there is no interdependence (no causality).
The results of impulse response test shows response through the interest rate channel from RSBI to inflation is positive.
The results show that the shock caused by RSBI in the early period quickly responded by changes in inflation. Besides, the inflation began to stabilize in the 47th period. So, inflation on the interest rate line takes about 47 quarters to get back to the balance point when shock occurs.
The Effectiveness of Monetary Policy Transmission Mechanism: Impulse Response Test Result (IRF).
0.6 0.8 1.0 1.2 1.4 1.6 1.8
5 10 15 20 25 30 35 40 45 50 55 60
Figure 2. Impulse Response Function Line of Interest Rate
Source : Primary data, Processed
0.7 0.8 0.9 1.0 1.1 1.2 1.3 1.4 1.5
5 10 15 20 25 30 35 40 45 50 55 60
Figure 3
. Impulse Response Function Path
199 JEJAK Journal of Economics and Policy Vol 11 (1) (2018) : 189-206
Based on the figure above, the impulse
response test result shows response through
credit line from RSBI to inflation is positive.
The results show that the shock caused by
RSBI in the early period quickly responded by
changes in inflation. Inflation began to
stabilize in the period of 36. So, inflation on
the credit line takes about 36 quarters to get
back to the balance point when shock occurs.
0.2 0.4 0.6 0.8 1.0 1.2 1.4
5 10 15 20 25 30 35 40 45 50 55 60
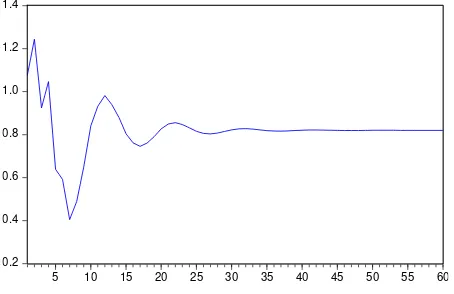
Figure 4. Impulse Response Function Line Inflation Expectation
Source : Primary Data
Regarding to the figure above, the results of impulse response test show response through inflation expectations of RSBI towards inflation is positive. The results show that the shock caused by RSBI in the early period quickly responded by changes in inflation. Inflation began to stabilize in the period of 34. So, inflation in the expectation path takes about 34 quarters to get back to the balance point when shock occurs.
The Effectiveness of Monetary Policy Transmission Mechanism: Variance Decomposition Test Result (VD). First, in the interest rate, the effect of each variable used
is SBI interest rate (50.54%), interbank money market rate (10.65%), deposit interest rate (0.161%), interest rate (8,327 %), and output gap (0.169%) in shock at SBI rates up to the fiftieth period, the portion of inflation variation explained by rPUAB increased to 19.79% and rDEPO slightly increased to 0.30% B).
Second, in the credit line, the effect given by each variable used are SBI interest rate (49.25%), deposit interest rate (0.038%), bank reserves (0.149%), loans (2.691%), and output gap (0.003%) when shock in SBI rates while in the fiftieth period, the portion of inflation variations that can be explained by rDEPO increased to 45.82% and LNKRDT increased to 3.31% (Appendix B).
Third, in the inflation expectation, the effect of each variable used are SBI interest rate (41.13%), deposit interest rate (0.056%), SKDU (0.605%), exchange rate (3.99%), and the output gap (0.031%) when a shock on the SBI interest rate which leads to an increase in inflation and up to the fiftieth period, the portion of inflation variations that can be explained by rDEPO increased to 10.58% and LNOG increased to 9.32% (Appendix B).
CONCLUSION
200 Ripdian Nisa M N, et al., The Most Effective Channel
affect the ultimate target" as the operational target of monetary policy in Indonesia. Above all, the policy implication of this study is that Bank Indonesia should prioritize the transmission mechanism of inflation expectation path rather than the interest rate and credit line in achieving the inflation target. The Government and Bank Indonesia are suggested to use the deposit interest rate instrument as the operational target of monetary policy to achieve the ultimate target (inflation) because the variable can quickly and strongly respond shock SBI interest rate and able to explain the variation of inflation significantly.
REFFERENCE
Anwar, T. C. (2009). Analysis of Inflation Expectations Indonesia Post ITF. Working Paper, No. 9, Bank Indonesia.
Azali, K. M. (1999). Money-Income and Credit-Income Relationship During Pre and Post Liberianization Periods: Evidence from Malaysia. Applied Economics, 1161-1170.
Bank Indonesia. (2004). Mechanism of Transmission of Monetary Policy in Indonesia, Series of Nations, No. 11. Jakarta: PPSK.
Dyahningrum, Y. F. (2016). Effectiveness of Monetary Policy Transmission Mechanism in Indonesia Period 2005.3-2015.3. Faculty of Economics and Business, Diponegoro University.
Gujarati, D. (2004). Basic Econometrics, Fourth-Edition. New York: The McGraw-Hill Companies. Judge, L. (2001). Implementation of Inflation Targeting
In Transmission Mechanism: Monetary Policy 1990.1-2000.4. Media Economics, Vol. 7, No. 2, 119-137.
Maski, G. (2005). Study on the Effectiveness of Monetary Policy Transmission Line With Single Inflation Target (VAR Approach). Economics and Development Studies (Unpublished) Post Graduate Program, Universitas Brawijaya. Natsir, M. (2009). Empirical Analysis of The
Effectiveness of Monetary Policy Transmission Mechanism in Indonesia through Expectations of Inflation Expectations Period 1990: 2-2007: 1. Equity, Vol. 13, 288-307.
Natsir, M. (2011). Empirical Analysis Effectiveness of Monetary Policy Transmission Mechanism in Indonesia through Interest Rate Channel Period 1990: 2-2007: 1. Economic Magazine, Year XXI, No. 2. Nuryati, Y. (2004). Implementation of Monetary Policy Targeting Inflation in Indonesia. Unpublished Thesis, Graduate Program, Bogor Agricultural University.
Oliner, R. G. (1996). Is There A Broad Credit Channel for Monetary Policy? Federal Bank of St. Francisc, 3-13. Ramlogan, C. (2007). Anism of Transmission Mechanism
Monetary Policy in Trinidad and Tobago. Journal of Economics Studies, 435-447.
Ranchhod, S. (2003). The Relationship between Inflation Expwctations Survey Data and Inflation. Reserve Bank of New Zealand Bulletin, Reserve Bank of New Zealand, Vol. 66.
Tjahjono, E. D, dkk. (2012). Survey Measures of Inflation Expectation. Buletin Ekonomi Moneter dan Perbankan, 422-456.
Warjiyo, P. (2004). Seri Kebanksentralan No.11 : Mekanisme Transmisi Kebijakan Moneter di Indonesia. Jakarta: PPSK.
Widarjono, A. (2016). Ekonometrika Pengantar dan Aplikasinya. Yogyakarta: UPP STIM YKPN.
Wulandari, R. (2012). Do Credit Channel and Interest Rate Channel Play Important Role In Monetary Transmission Mechanism In Indonesia? A Structural Vector Autoregression on Model. Procedia-Social and Behavioral Sciences, 557-563.
201 JEJAK Journal of Economics and Policy Vol 11 (1) (2018) : 189-206
APPENDIX
Interest Rate Eqution Model
202 Ripdian Nisa M N, et al., The Most Effective Channel
Credit Line Equation Model
203 JEJAK Journal of Economics and Policy Vol 11 (1) (2018) : 189-206
Inflation Expecttion Equation Model
204 Ripdian Nisa M N, et al., The Most Effective Channel Variance Decomposition Test Results
Interest Rate Variance Decomposition Results
Source: Primary Data, processed
Inflation of Variance Decomposition
Periode S.E. RSBI RPUAB RDEPO RKRDT LNOG INF
1 0.597703 50.53974 10.64772 0.160879 8.327125 0.169832 30.15471
2 1.074184 72.05138 5.709412 1.610866 4.859451 0.931893 14.83700
3 1.485170 74.99002 3.924605 2.005969 6.121603 2.350386 10.60742
4 1.820142 74.89864 8.127868 1.743558 5.255144 2.239965 7.734825
5 2.099186 71.71477 12.99865 1.526085 4.886572 2.219502 6.654426
6 2.333295 68.64831 17.41731 1.363957 4.480814 2.021068 6.068541
7 2.537671 65.69922 20.97417 1.292054 4.613559 1.876656 5.544343
8 2.717355 63.07684 23.07189 1.198994 5.477884 1.740625 5.097798
9 2.886635 63.07684 23.26071 1.147124 6.131011 1.632311 4.752002
10 3.052903 64.05126 22.52863 1.087693 6.374884 1.528381 4.429162
20 4.524886 71.08908 20.43757 0.618134 4.243049 1.102044 2.510127
30 5.617035 73.38329 19.98346 0.445983 3.486882 0.933223 1.767162
40 6.527787 74.48657 19.84897 0.355337 3.096667 0.842548 1.369906
41 6.611828 74.56069 19.84544 0.348651 3.069442 0.835643 1.340134
42 6.694843 74.63587 19.83819 0.342229 3.042935 0.829059 1.311719
43 6.776897 74.71121 19.82865 0.336042 3.016753 0.822805 1.284538
44 6.858028 74.78508 19.81861 0.330081 2.990870 0.816869 1.258488
45 6.938254 74.85582 19.80961 0.324348 2.965508 0.811222 1.233486
46 7.017580 74.92233 19.80255 0.318846 2.940980 0.805828 1.209471
47 7.096014 74.98429 19.79754 0.313575 2.917553 0.800650 1.186398
48 7.173568 75.04212 19.79410 0.308529 2.895363 0.795660 1.164224
49 7.250264 75.09668 19.79148 0.303694 2.874396 0.790839 1.142912
50 7.326135 75.14893 19.78890 0.299055 2.854515 0.876180 1.122420
205 JEJAK Journal of Economics and Policy Vol 11 (1) (2018) : 189-206
Credit Line Decomposition Results
Inflation of Variance Decomposition
Periode S.E. RSBI RDEPO LNCB LNKRDT LNOG INF
1 0.586285 49.25585 0.038862 0.149019 2.691101 0.002869 47.86230
2 0.987142 66.48904 2.078014 3.077164 1.959125 0.606805 25.78986
3 1.389020 70.60020 4.604199 2.934522 1.987685 0.741316 19.13208
4 1.762322 62.53979 14.74687 3.574699 1.799261 1.233007 16.10637
5 2.147491 51.47817 29.23994 2.681421 2.073866 1.188069 13.33853
6 2.527388 43.08028 40.27658 2.118676 2.633955 1.032797 10.85771
7 2.903300 38.46710 47.08773 1.775341 2.725804 0.897254 9.046767
8 3.248457 36.50857 50.26517 1.603320 2.754323 0.873695 7.994930
9 3.567689 36.23075 51.24301 1.529903 2.721116 0.908967 7.366250
10 3.862531 36.70539 51.25723 1.450936 2,677496 0.967058 6.941889
20 6.201622 40.21939 49.11962 1.005164 2.944309 1.831808 4.879704
30 7.872874 42.43911 47.45850 0.780316 3.135165 2.344269 3.842634
31 8.020699 42.60896 47.33814 0.763108 3.146261 2.378517 3.765009
32 8.165884 4276574 47.22727 0.746846 3.156930 2.412465 3.690750
33 8.308511 42.90957 47.12101 0.731588 3.169687 2.448646 3.619505
34 8.448486 43.04886 47.01835 0.717067 3.183275 2.480991 3.551461
35 8.586356 43.19001 46.91788 0.702789 3.192860 2.509938 3.486519
36 8.722094 43.32274 46.82369 0.689167 3.201735 2.538340 3.424330
37 8.855754 43.44517 46.73365 0.676290 3.212055 2.568282 3.364555
38 8.987260 43.56264 46.64708 0.664004 3.223270 2.595790 3.307214
39 9.116981 43.86060 46.56271 0.651951 3.231869 2.620637 3.252232
40 9.244928 43.79290 46.48297 0.640380 3.239637 2.644740 3.199377
50 10.43813 44.70064 45.82481 0.546165 3.312994 2.850859 2.764528
60 11.50828 45.35835 45.34934 0.478110 3.364995 2.998115 2.451098
Source: Primary Data, processed
Inflation Expectation Decomposition Variance Decomposition Results
Inslation of Variance Decomposition
Periode S.E. RSBI RDEPO SKDU LNER LNOG INF
1 0.563402 41.13472 0.056616 0.605554 3.997351 0.031406 54.17435
2 0.914182 59.38576 1.216781 1.096889 3.449934 0.768381 34.08225
3 1.262517 61.74861 3.025677 2.601426 3.592937 2.043343 26.98800
4 1.603777 54.22630 6.070401 7.894631 4.87000 6.222463 20.71620
5 1.884712 48.5045 8.894128 9.525724 7.170270 7.657044 18.24835
6 2.08881 46.12306 9.60006 9.811666 8.439816 8.908316 17.11708
7 2.243437 45.60767 9.779209 9.42046 8.731873 9.92431 16.51848
8 2.369302 45.97687 9.549655 9.39960 8.45044 10.60301 16.02042
9 2.49060 47.16500 9.250587 9.69485 8.093275 10.46944 15.32685
10 2.612623 49.32926 8.99055 9.689537 7.603075 9.98922 14.39835
206 Ripdian Nisa M N, et al., The Most Effective Channel
30 4.625954 63.58101 10.25461 4.474244 5.581120 9.354971 6.754043
31 4.703340 63.8961 10.27427 4.36061 5.530768 9.341985 6.596300
32 4.779791 64.18646 10.29706 4.250402 5.48650 9.332587 6.446997
33 4.855215 64.4508 10.32182 4.144719 5.447574 9.328407 6.306661
34 4.92950 64.6930 10.34653 4.04439 5.412263 9.32890 6.174952
35 5.002567 64.91919 10.56947 3.949754 5.378751 9.331992 6.050849
36 5.074426 65.13549 10.38972 3.86065 5.345745 9.335304 5.933096
37 5.145145 65.34571 10.40732 3.776536 5.312761 9.337118 5.820558
38 5.214831 65.55117 10.42289 3.69667 5.279992 9.336807 5.712471
39 5.283596 65.75123 10.43732 3.620293 5.248007 9.334681 5.608461
40 5.351529 65.94431 10.45140 3.546838 5.217399 9.331606 5.508451
50 5.989558 67.4640 10.57689 2.949632 4.982149 9.320955 4.706388
60 6.565816 68.52568 10.66428 2.532365 4.817513 9.314267 4.145888