O R I G I N A L A R T I C L E
Base Rates, Deception Detection, and
Deception Theory: A Reply to Burgoon (2015)
Hee Sun Park1& Timothy R. Levine1,2
1 School of Media and Communication, Korea University, Seoul 136-701, Republic of Korea 2 Department of Communication Studies, University of Alabama at Birmingham, AL 35233, USA
This essay continues a debate about the relative scientific merits of the Park-Levine Model (PLM) and Interpersonal Deception Theory (IDT) with regard to accuracy in deception detection. Key points of disagreement include (a) the degree to which message recipients are sensitive to sender veracity and (b) the extent to which interactivity moderates the veracity and base-rate effects specified by PLM. According to PLM, people are truth-biased, truth-bias makes people insensitive to deception, and as a consequence, base rates affect accuracy regardless of interactivity. IDT, in direct contrast, holds that people are sensitive to the veracity of other’s communication and that interactivity is a key moderator. Consis-tent with PLM, data repeatedly show that people are insensitive to other’s veracity and that this insensitivity is general across media affordances including interactivity. This rejoin-der uses Burgoon’s (2015) own interactive data to demonstrate the empirical superiority of PLM over IDT.
Keywords:Deception, Lies, Truth Bias, Veracity Effect.
doi:10.1111/hcre.12066
The Park-Levine Model (PLM; Park & Levine, 2001) predicts that accuracy in deception detection experiments is a positive linear function of truth-lie base rates. Recently, we published a series studies inHCR(Levine, Clare, Green, Serota, & Park, 2014) testing PLM and Interpersonal Deception Theory (IDT; Buller & Burgoon, 1996) predictions. Our results were consistent with PLM but not IDT. Across all three studies, we found the PLM predicted linear base-rate effects for both interaction participants and passive observers. Consistent with meta-analysis but contrary to IDT predictions, the extent of interaction made little difference.
The Levine, Clare, Green et al. (2014) test of PLM and IDT has been disputed. Burgoon (2015) finds much fault with our logic, literature review, method, analysis, and especially our conclusions. She objects to our studies on the grounds that our methods do not provide a fair test of her theory. Our work, in her opinion, is not sufficiently interactive, and she thinks this matters. We do not believe interactivity
matters in the way Burgoon or IDT claims, and we disagree that people are sensitive to other’s veracity.
In this rejoinder, we explain why the PLM and IDT are logically contradictory, and why it is that if both fit the data equally well neither would fit the data very well. PLM presumes independence of observation and insensitivity to other’s lies whereas IDT is predicated on the exact opposite. Empirically, we show that Professor Burgoon’s results fit the veracity effect (Levine, Park, & McCornack, 1999) more closely than her data fit IDT’s sensitivity to deception hypothesis. Finally, we will explain why Bur-goon’s interactive data lead to the same conclusions about accuracy and truth-bias as the findings of noninteractive deception detection experiments. Because both inter-active and noninterinter-active experiments lead to identical conclusions about truth-bias and accuracy regardless of interactivity, interactivity is not the all-important consid-eration as IDT claims.
The PLM and base rates summarized
The PLM is a module in Truth-Default Theory (TDT; Levine, 2014a) that predicts deception detection accuracy at different truth-lie base rates. Base rates have to do with the proportion of communication that is honest or dishonest. Almost all decep-tion research uses a 50–50 base rate where half of the senders’ messages are honest and half are deceptive. For example, the Burgoon, Buller, White, Afifi, and Buslig (1999), Burgoon, Buller, Afifi, White, and Hamel (2008), and Burgoon, Buller, Afifi, White, and Buslig (2014) studies discussed below presented subjects with the answers to 12 questions, 6 of which were honest and 6 of which were deceptive. Fifty-fifty base rates like this are conventional and ubiquitous in deception detection research because most researchers (us included) have sought to balance the truth-lie mix equally in their experimental designs. But this mix departs radically from the base rates typical of interpersonal communication outside the lab where utterances are not evenly dis-tributed between honest and deceptive (Serota, Levine, & Boster, 2010). In PLM and TDT, base rates are not a nuisance variable to be controlled; they are a theoretically important part of deception detection. For us, understanding and explaining decep-tion as a phenomenon requires understanding its prevalence and the implicadecep-tions of deception prevalence for deception detection (see Serota et al., 2010).
Initial clarifications regarding different definitions
We define truth-bias and accuracy differently than Professor Burgoon, and we need to make these differences explicit to avoid confusion. We do not claim that our defini-tions, or any definidefini-tions, are correct, and we see little to gain from an argument about who is using words the right way. We nevertheless believe we have chosen our words carefully and that we can make a good case for the utility of our word usage.
We define truth-bias as the tendency to believe that communication is honest regardless of actual honesty (see Levine, 2014a; Levine et al., 1999). The word “bi-as” may be a little misleading, but we use the term (and score the variable) consistent with its original use by the scholars who coined the term (McCornack & Parks, 1986). In our own research that typically uses dichotomous truth-lie judgments rather than scaled judgments of honesty, we score truth-bias as the percentage of messages that are rated as honest. In Professor Burgoon’s research, our conception of truth-bias cor-responds to her variable honesty rating. Whereas she scores bias as a discrepancy between sender and receiver, we see truth-bias as just the extent to which honesty ratings are high. Consequently, we interpret an “8” on her 0–10 honesty scale as truth-biased regardless of experimental condition or sender’s rating of their own hon-esty.
Professor Burgoon, in contrast, focused on the “bias” in truth-bias, and she scores bias in her studies as the signed discrepancy between sender and receiver ratings. Receivers are truth-biased to the extent that they rate a message as more honest than the sender’s own rating of the same message. Thus, receivers viewing a 100% honest message could never be truth-biased by Burgoon’s definition, and truth-bias is only possible under conditions of some sender dishonesty. So, for example, if senders rate their own honesty as a “9” and interviewers rate the senders as an “8,” then in Bur-goon’s scoring, the interviewer is slightly lie-biased even though they rated the senders as mostly honest.
We define and score accuracy simply as being correct about whether a message is truthful or deceptive. In our view, that’s the bottom line. Burgoon (2015), in contrast, distinguishes genuine accuracy from pseudo-accuracy. In an analogy to billiards, we allow “slops” while Burgoon requires that all shots be called in advance. While we see merit to both views depending on the goal of the research, we do not understand why Professor Burgoon pushes this distinction as a criticism of our work while she also scores accuracy as a simple discrepancy in much of her own work (e.g., Burgoon, Buller, Ebesu, & Rockwell, 1994; Dunbar et al., 2013).
The core disagreement
to incorrectly believe that others are honest when the others are actually deceptive. Belief that others are honest (truth-bias or honesty ratings) is relatively constant across sender veracity but accuracy is not. Accuracy is good for truths and poor for lies precisely because people are not sufficiently sensitive to other’s veracity. In the bigger theoretical picture of TDT, this is of huge theoretical importance because it means that truth-bias is adaptive; it improves accuracy (our use of the term) in real-world communication situations.
In contrast to the PLM view, Burgoon (2015) claims that “base rate effects com-pletely comport with IDT because they show thatreceivers are attuned to the veracity of the messages to which they are exposed” (p. 338, we added the emphasis because the whole debate hinges on the validity of this claim). IDT only works to the extent that this is true; PLM is only useful to the extent this is false. Burgoon, Buller, Dill-man, and Walther (1995) put it a little differently: “we hypothesized and confirmed (as have others) that people sense deception when it is present” (p. 184). Thus, according to Burgoon and IDT, sender honesty-deceit affects receiver’s evaluations of a sender’s honesty or deceit.
Because people (according to IDT) are sensitive to the honesty-deceptiveness of others, changing the base rate must change the proportion of others’ messages that are believed or doubted. If people interact with only honest senders, receivers’ hon-esty ratings would be high. If people interact only with liars, honhon-esty ratings must plunge. For IDT, the greater the proportion of honest senders, the higher the average honesty rating (what we call truth-bias). But base rates are not especially interesting or important for IDT. As Burgoon (2015) makes clear, she sees base rates as a con-ventional methodological decision so that bias balances out. Otherwise, base rates are not a theoretical issue in IDT, and IDT hypotheses and conclusions do not hinge on base rates.
To summarize the competing claims so far, according to us and PLM:
1. People in most deception detection experiments are not sensitive to actual veracity.
2. Actual veracity affects accuracy much more than receiver’s ratings of sender hon-esty.
3. Base rates strongly affect accuracy in theoretically important ways.
According to Burgoon and IDT, in contrast:
1. People are sensitive to the veracity (honesty or deceptiveness) of other’s commu-nication.
2. Actual veracity, therefore, affects receiver’s ratings of sender honesty.
3. Base rates are only important to balance out bias and are not of theoretical impor-tance.
But, this is not what research shows at all. What decades of research does show is that while people are significantly better than chance at distinguishing truths from lie, rates for lie detection per se are actually below 50% (Bond & DePaulo, 2006; Levine et al., 1999). Burgoon’s (2015) position is empirically incorrect.
Our previously published experiments (Levine et al., 1999; Levine, Clare, Green et al., 2014; Levine, Kim, Park, & Hughes, 2006) as well as Kim Serota’s doctoral disser-tation and three new unpublished experiments we have recently conducted in Korea all produce findings consistent with PLM. Experimentally changing base rates has lit-tle impact on average honesty ratings but produces large and predictable linear effects on accuracy. In every experiment we have performed, as the proportion of honest senders increases, accuracy increases while truth-bias is flat across various base rates. These findings too strongly refute Burgoon’s and IDT’s claim that receivers are attuned to sender’s veracity. Our data falsify IDT to the extent that it is falsifiable.
In IDT, however, interactivity is postulated to be a game changer and Burgoon (2015) pounds this point home again and again. According to IDT and Burgoon, because interactive deception is so different from noninteractive lie detection, find-ings from our noninteractive experiments just do not apply to her theory. We often use only short snippets of noninteractive behavior, so our findings are dismissed. IDT anticipates different findings from the more ecological (according to Burgoon) and interactive deception experiments conducted by Burgoon and her students than from less interactive experiments like ours.
However, is Burgoon’s (2015) and IDT’s assertion that interactive deception is just different justified? We need to take a close look at what Burgoon’s (2015) “essence of an interactive experiment” (p. 334) actually finds. We need to see if Burgoon’s interactive deception research really produces new, different, and novel results consistent with IDT and inconsistent with PLM as she claims, or if her results show just the same things as noninteractive deception research.
What did Burgoon et al. really find?
Burgoon (2015), pp 327–349, Figures 1 and 2 used a data set from Burgoon et al. (1999) and Burgoon et al., (2014) and findings reported by Burgoon et al. (2008) as (a) evidence that that research findings provide empirical support IDT, (b) a demonstra-tion of the “dynamics of decepdemonstra-tion judgments,” and (c) to discredit PLM. Burgoon’s (2015) Figures 1 and 2 are reprinted here for the convenience of the reader with the permission of Professor Judee Burgoon and with full credit to the original source, Burgoon et al., 2008. Our interpretation of these results follows.
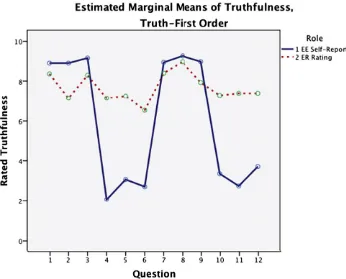
Figure 1 Estimated marginal means of truthfulness, truth-first order (from Burgoon, 2015).
rate themselves as somewhat dishonest (1–4 on the scale where 5 is the midpoint). The up and down movement of the solid line has nothing to do with the dynamic nature of interaction. That fluctuation is just the sender instruction-following.
The dotted line is the receiver’s ratings of the sender’s honesty (ER for interview-ers). This is the line that provides the critical information relevant to our disagree-ment. Again, a score of 5 is at the scale midpoint. When the dotted line is above 5, receivers are rating the senders as honest, and the farther above 5 and the closer to 10, the more subjects are truth-biased (in our use of the term). Ratings below 5 reflect the deceptive end of the scale with 0 being complete dishonesty.
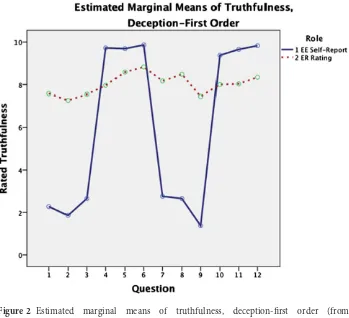
Figure 2 Estimated marginal means of truthfulness, deception-first order (from Burgoon, 2015).
When we look at Figures 1 and 2, here is what we see. The first thing to notice is that both figures tell pretty much the same story. Truth-deception order makes little difference. We previously argued that if people were really sensitive to other’s veracity like Burgoon and IDT say, order should make difference (Levine, Clare, Green et al., 2014). If you know someone has deceived you three times in a row, then on the fourth time you should be more wary of them then if you know they have been consistently honest in the past. But Burgoon (2015) says no, this does not follow from IDT’s sen-sitivity to deception prediction, so we will let it pass. The important thing for now is that if we view the two different orders of truths and lies as replications, then the main findings replicate reasonably well. This is an important part of our point. The pattern of results is very robust.
The third thing we notice is that honesty ratings (dotted line) stay high across questions. The ratings vary by a scale point or two, but they never dip below a “6” much less the scale midpoint of 5. Our read of the results is that all the answers are rated as honest regardless of actual honesty. We do not see any question in either of Burgoon’s figures that was rated as dishonest or even neutral. Although receivers are a little bit sensitive to changes in receiver veracity, they are never sensitive enough to rate a deceptive answer as deceptive! Never, ever, not even once over all 12 deceptive answers!
Now, as mentioned in the last paragraph, the dotted line does dip a little lower for deception than honest messages, but just a little bit. Receivers do rate honest senders as a little more honest than deceptive senders. But, this is not a finding unique to interactive deception nor is this evidence of the dynamics of interactive deception as Burgoon claims. This is just the slightly better-than-chance accuracy that has been reported in literarily hundreds on noninteractive deception detection experiments. The findings are presented differently due to Professor Burgoon’s preference for 0–10 scaling, but this is nevertheless the same significant-but-unimpressive accuracy that has been around since the 1940s (cf. Levine & Bond, 2014).
The fourth and most important thing to note is that accuracy is uniformly high for truths and uniformly low for lies. That is, in both figures, whenever receivers are rating honest messages, there is close correspondence between the two lines. The difference is less than two scale points in every instance. However, for deceptive messages, the gap is quite wide. In 1999, we labeled this robust finding “the Veracity Effect” (Levine et al., 1999). The veracity effect holds that sender veracity (whether a sender or mes-sage is true or false, honest or deceptive) predicts the receiver accuracy. According to the veracity effect, receivers are more accurate with honest senders than deceptive senders. Now, of course, Professor Burgoon does not interpret her findings as sup-porting our ideas. To the contrary, Burgoon (2015) explicitly interprets these finds as “disputing” us (see the quote below). Nonetheless, a big strong veracity effect is clearly evident in Burgoon’s own data. Thus, although Professor Burgoon disputes PLM, her own data clearly do not.
In sharp contrast to what we noted above, Burgoon (2015) interprets her findings as follows:
These results, which support one of the IDT propositions, show that judges are attuned to changes in interviewee veracity; their judgments are not random and they are not static. The PLM [Park-Levine Model] would have had to predict that veracity
judgments would remain the same across all 12 interview questions since the base rate did not change. (p. 334)
We simply ask the reader to look at the figures. Is it the case that the two lines track each other as IDT and Burgoon assert showing that receivers are sensitive to changes in veracity? Or is the dotted line relatively flat and always in the range of honesty as PLM suggests?
Readers, we hope, will have noted that we both seem right, at least to some extent. The dotted line does drop for deception just like Professor Burgoon predicts; changes are directionally consistent. But the dotted line never dips very far, just like we pre-dict. This is a question of relative goodness-of-fit. We can both showp<.05 for our
claims; but whose predictions describe the results better? Once again PLM predicts that the dotted line is flat, consistently above the scale midpoint, close to the solid line for truths, but departing from the solid line for lies. Burgoon, in contrast predicts sensitivity such that the dotted line mirrors and approximates the solid line.
Factoring in base rates
Now, let us add base rates into the discussion. The PLM is about changes in the base rate and the Burgoon et al. (1999) experiment holds base-rate constant at 50–50. Would changing the base rate affect accuracy as PLM suggests? If the reader will try these simple thought experiments, they should be able to visualize the PLM implication for Burgoon et al.’s (1999) findings. In Burgoon’s Figures 1 and 2, the dotted line always stays relatively high. What would happen if the senders were instructed to be honest on all 12 answers rather than just 6? In that case, the solid line would be uniformly high too. If PLM is right, both lines would be close together on all 12 questions and answers, the average discrepancy would be small, and accuracy would be really impressive; much higher than the average accuracy in the actual 50–50 truth-deception mix. People would correctly rate honest messages as honest, and because all messages were honest, people would always be right. Now, let us try the reverse. What if Burgoon et al. had instructed the senders to be deceptive every time? The dotted line would dip a little bit, but not below 6 on the scale. That never happens for deception in the data we are looking at. The solid line would be flat and low toward the lower end of the scale. The discrepancy would be large for every question, much larger on average than the discrepancy in the actual study. Accuracy would be low. People would rate all the messages as honest, all the messages would actually be deceptive, and the judges would be wrong in that they rated all the messages as honest when they were not ever honest.
listening to the radio, or engaging in any other type of communication with different affordances. Any data that show the veracity effect will produce base-rate effects. The only way it could be otherwise would be if math ceases to work. PLM is a formula that shows how the veracity effect plays out on accuracy with different base rates.
Burgoon’s own interactive data show a strong veracity effect, and the veracity effect is much stronger than IDT’s alternative senders-are-sensitive-to-veracity prediction. The data, we believe, are crystal clear. But, if our conjectures (thought experiments) about different base rates are too abstract or speculative, let us look at the logical coherence of the competing claims.
According to Burgoon (2015) and IDT:
(a) People are usually truth-biased; that is, truth-bias is acknowledged to be robust.
(b) Truth-bias lowers accuracy and sensitivity according to IDT and Burgoon (2015) because biases are antithetical to accuracy and sensitivity. To think otherwise is an “oxymoron” (p. 338) according to Burgoon (2015).
(c) But, people are nevertheless sensitive to deception and detect deception when present even though they are truth-biased, and they do not rate deceptive mes-sages as deceptive.
To accept Burgoon’s (2015) position, a reader must accept an argument that Bur-goon herself labels oxymoronic. BurBur-goon’s stance specifies both truth-bias and sen-sitivity while asserting that bias and sensen-sitivity (i.e., accuracy) cannot coexist. This is not a coherent position. The argument self-contradicts.
According to PLM:
(a) People are usually truth-biased; that is, truth-bias is acknowledged to be robust.
(b) Truth-bias lowers accuracy for deception but increases accuracy for honest mes-sages.
(c) Truth-bias does not reliably affect accuracy at the artificial, experimentally induced 50–50 base-rate level because the improvements in truth-accuracy and the decrements in lie-accuracy cancel out.
(d) However, truth-bias does predictably affect accuracy when base rates are other than 50–50. As the ratio of truth-to-deception increases, so too does accu-racy, the increase is linear and positive, and it is predicted by the formula: total raw accuracy (percent correct across truths and deception)=([accuracy for truths]×[percent messages truthful])+([percent correct for decep-tion]×[percent messages that are deceptive]).
Interactivity, really?
Here is the other crucial part of our disagreement. Burgoon and IDT emphasize the importance of interactivity. Interactive deception, she says, is different in a myriad of ways that matter for deception detection accuracy. But, we do not see the empiri-cal basis for that claim in either her data or in meta-analysis. Meta-analysis (Bond & DePaulo, 2006) tells us that people are significantly better than chance at distinguish-ing truths from lies (p<.0001, effect sized=.42), but people are nevertheless much closer to 50–50 chance than perfection (i.e., accuracy is normally distributed around 54% which is 4 points higher than chance null hypothesis tested by Burgoon, but 46 points below perfect sensitivity). Meta-analysis also finds that people are truth-biased and that accuracy is higher for truths than lies(Bond & DePaulo, 2006). This is just what we find in most of our noninteractive studies. And, this is exactly what Burgoon (2015; Burgoon et al., 1999) finds in her “essence of interaction” findings too.
The findings mapped in Burgoon’s (2015) Figures 1 and 2 mirror the findings of noninteractive deception research closely. The bottom-line conclusions are exactly the same. People are truth-biased (honesty ratings are above 5 on the 10-point scale). People are significantly better than chance at accuracy but not by much (i.e., they rate honest messages as more honest than deceptive messages,p<.05). Accuracy is higher
for truths than lies in both interactive and noninteractive studies alike. If interactivity is such a critically important variable, why are the results just the same as noninter-active deception? And, this is not just the findings in Burgoon’s figures. Meta-analysis reports identical accuracy for both interactive and noninteractive deception detection experiments (53% for both, Bond & DePaulo, 2006).
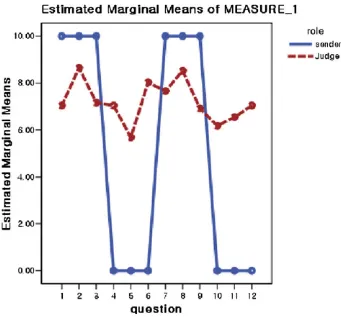
To illustrate that Burgoon’s data only create the illusion of interactive dynamics and sensitivity to deception, we created Figure 3 with some currently unpublished data we collected in October 2014 for a future article on base rates. In the study, 81 Korea University students watched and judged a series of short snippet (approx-imately 20 seconds each) videotaped truths and lies. Although truths and lies were interspersed in the research design, we grouped them into alternating blocks of 3 to match Burgoon’s sequence in her Figure 1. To put scores on the same metric as Bur-goon, we gave honest judgments a score of 10 and lie judgments a score of 0. These honesty scores are graphed by the dotted line and ground truth (actual honesty) is mapped with the solid line (see Figure 3).
Figure 3 Illustrative data from noninteractive deception detection research yielding 54% accuracy.
veracity effect just like in Burgoon’s data. Again, these findings are no more sensitive to deception than usual, and the findings cannot show the dynamics of interaction because there is no interaction. Snippet experiments and fully interactive experiments produce similar looking graphs and lead to the same conditions. Actual data provide little support for interactivity as a game-changer.
Ecological considerations
imposed base rates that are seen as departing from the real world. Professor Bur-goon (2015) sees her research subjects as biased victims of a truth-bias heuristic. She needs signal detection statistics to correct this bias. PLM and TDT see researchers as biased, using base rates that depart radically from real-life interpersonal interac-tion. As the work on deception prevalence repeatedly shows (Halevy, Shalvi, & Ver-schuere, 2014; Serota & Levine, 2015; Serota et al., 2010; Smith, Hancock, Reynolds, & Birnholtz, 2014), subjects’ judgments in deception research mirror the real word much better than the 50–50 base rates used in lab studies. Subjects are not biased, deception researchers and their research designs are. PLM lets us model this research-induced bias.
From the TDT perspective (Levine, 2014a), a second critical aspect of the ecology of interpersonal communication is the base-level degree of suspicion and sensitiv-ity to deception in everyday communication. In the Burgoon results we have been discussing, the receivers were told that the research involved deception and decep-tion detecdecep-tion, they were given a high suspicion inducdecep-tion, and they were required to rate sender honesty after every answer (Burgoon et al., 1999). Burgoon finds that receivers are at least somewhat sensitive to deception when they are (a) prompted to think about veracity, and (b) required to answer researcher-asked questions about honesty-deceit. But, how ecological is this? Would the limited sensitivity evident in her results hold in interactions if people were not primed to be suspicious by the very fact that they were in an experiment, and they were not purposely primed by suspicion inductions and explicit measures of honesty? In some unpublished work with David Clare, the answer seems a resounding no. When subjects do not know they are in a deception detection experiment and when they are not explicitly asked about honesty, the idea that the sender might be deceptive usually does not even come to mind. If the thought of deception seldom comes to mind absent prompting, then sender veracity and base rates explain 100% of the variance in accuracy. Professor Burgoon is right to be concerned with ecology, but IDT does a poor job of prioritizing what aspects of the ecology matter most.
Parsimony
As an alternative, we offer a rival equation as a predictive model for Burgoon’s “essence of interactive” data in Figures 1 and 2 based on PLM:
Accuracy=actual sender veracity
No regression weight or intercept is needed. When senders are honest, accuracy is high. When senders are deceptive, accuracy is low. For the reasons just mentioned under the ecology heading above, in most interpersonal interaction, our simple equation (the veracity effect) explains most of the variance in interpersonal decep-tion detecdecep-tion. Even when suspicion is primed, this equadecep-tion still explains 40–60% of the variance (Levine et al., 1999).
For expert interrogation situations, however, we propose a different set of variables that predict accuracy (see Levine, 2014b; Levine, Clare, Blair et al., 2014). Accuracy is a function of (a) the expert’s familiarity with the context, (b) the expert’s access to relevant evidence (c) the diagnostic utility of the sender’s communication content vol-unteered or solicited though questioning, and (d) the expert’s success in soliciting an honest confession. The careful reader will note zero overlap between our list and Pro-fessor Burgoon’s variables. As research progresses, it will be interesting to see whose list does better in improving accuracy.
Signal detection adds little
A related issue that Professor Burgoon (2015) raises involves the use of signal detection analysis in deception detection research. She sees utility in it, and this is another point of disagreement. Burgoon claims that signal detection is normative and conventional. That is correct in some circles, but not in others. Meta-analysis tells us that d’ (sensitivity) in signal detection and raw accuracy are correlated at
r=.988 (Bond & DePaulo, 2006). Our view is that any two measures that cor-relate that highly tell us the same thing. As raw accuracy and truth-bias (our preferred scoring) are simple percentages, we see advantage in being accessible to a wider audience and little gain from reporting our findings in a more cryptic form when so little value is added. When the Levine Clare, Green et al. (2014) article was originally submitted to HCR, one of the reviewers raised this same objection. As mentioned in note 3 of our original article, we conducted a signal detection analysis and found that it added nothing (except unnecessary com-plexity) to the article. This is another distinction that just does not make any difference.
Summary and conclusion
correct inferences (even if just by chance; i.e., Burgoon’s pseudo-accuracy) about honest others and make faulty judgments about deception (deception is misperceived as honest). The extent to which this is empirically observed is called the veracity effect (Levine et al., 1999), and the veracity effect is demonstrated quite clearly in Burgoon’s (2015) interactive data. Receivers in Burgoon’s experiment rated every answer to every question as honest regardless of whether senders were instructed to be honest or deceptive.
Burgoon’s interpretation of these findings as proving that people are sensitive to other’s deception are hard to reconcile with her own findings because her subjects (on average) never rated a deceptive sender response as deceptive. All senders were rated as honest all of the time. Burgoon’s nil-null statistical hypothesis can be rejected atp<.05, but that is trivial because that effect (slightly better-than-chance truth-lie discrimination) is very well known, well documented, and universally dismissed as unimpressive by the research community. Deception researchers know that accuracy is better than chance, but we also know it is not better than chance by enough to be very important. It does not matter that the scaling is continuous or dichoto-mous. It does not matter if the study is interactive or not. It is the same old finding either way.
As the veracity effect is huge in Burgoon’s data, and because PLM follows directly from the veracity effect, PLM fits Burgoon’s data nicely. Burgoon’s claims that her data support IDT and refute PLM are objectively false. Her own Figures 1 and 2 show this. At the core of IDT (and this was as true in 1996 as it is in 2015), is the claim that interactivity is a critical factor in deception detection, that an interactive theory (IDT) is needed to explain interactive deception detection, and that noninterac-tive findings just do not apply. Burgoon’s interacnoninterac-tive experiments prove this false too. The big findings are the same in both interactive and noninteractive decep-tion experiments. Receivers are truth-biased regardless. Accuracy is significantly better-than-chance-but-not-by-much regardless. The veracity effect holds true in both regardless.
Acknowledgment
Dr. Kim Serota provided helpful comments on earlier drafts of this article.
References
Blair, J. P., Levine, T. R., & Shaw, A. S. (2010). Content in context improves deception detection accuracy.Human Communication Research,36, 420–439.
Bond, C. F., Jr., & DePaulo, B. M. (2006). Accuracy of deception judgments.Personality and Social Psychology Review,10, 214–234.
Buller, D. B., & Burgoon, J. K. (1996). Interpersonal deception theory.Communication Theory,6, 203–242.
Burgoon, J. K. (2015). Rejoinder to Levine et al.’s comparison of the Park-Levine probability model versus interpersonal deception theory: Application to deception detection.Human Communication Research,41, 327–349 .
Burgoon, J. K., Buller, D. B., Afifi, W. A., White, C. H., & Buslig, A. L. S. (2014).The dynamic nature of veracity judgments. Manuscript in preparation.
Burgoon, J. K., Buller, D. B., Afifi, W. A., White, C. H., & Hamel, L. (2008).Cognitive heuristics and the stability of receiver judgments in detecting deception. Paper presented at the 41st Hawai’i International Conference on System Sciences, Kona, HI.
Burgoon, J. K., Buller, D. B., Dillman, L., & Walther, J. B. (1995). Interpersonal Deception IV. Effects of suspicion on perceived communication and nonverbal behavior dynamics.
Human Communication Research,22, 163–196.
Burgoon, J. K., Buller, D. B., Ebesu, A. S., & Rockwell, P. (1994). Interpersonal deception: V. Accuracy in deception detection.Communication Monographs,61, 303–325.
Burgoon, J. K., Buller, D. B., White, C. H., Afifi, W. A., & Buslig, A. L. S. (1999). The role of conversational involvement in deceptive interpersonal communication.Personality and Social Psychology Bulletin,25, 669–685.
Dunbar, N. E., Jensen, M. L., Burgoon, J. K., Kelly, K. M., Harrison, K. J., Adame, B. J., & Bernard, D. R. (2013). Effects of veracity, modality, and sanctioning on credibility assessment during mediated and unmediated interviews.Communication Research. doi: 10.1177/0093650213480175.
Halevy, R., Shalvi, S., & Verschuere, B. (2014). Being honest about dishonesty: Correlating self-reports and actual lying.Human Communication Research,40, 54–72.
Levine, T. R. (2014a). Truth-default theory (TDT): A theory of human deception and deception detection.Journal of Language and Social Psychology,33, 378–392. Levine, T. R. (2014b). Active deception detection.Policy Insights from the Behavioral and
Brain Sciences,1, 122–128.
Levine, T. R., Blair, J. P., & Clare, D. D. (2014). Diagnostic utility: Experimental
demonstrations and replications of powerful question effects in high stakes deception detection.Human Communication Research,40, 262–289.
Levine, T. R., & Bond, C. F., Jr. (2014). Direct and indirect measures of lie detection tell the same story: A reply to ten Bribke, Stimson, and Carney (2014).Psychological Science,25, 1960–1961.
Levine, T. R., Clare, D. D., Green, T., Serota, K. B., & Park, H. S. (2014c). The effects of truth-lie base rate on interactive deception detection accuracy.Human Communication Research,40, 350–372.
Levine, T. R., Kim, R. K., & Blair, J. P. (2010a). (In)accuracy at detecting true and false confessions and denials: An initial test of a projected motive model of veracity judgments.
Human Communication Research,36, 81–101.
Levine, T. R., Kim, R. K., Park, H. S., & Hughes, M. (2006). Deception detection accuracy is a predictable linear function of message veracity base-rate: A formal test of Park and Levine’s probability model.Communication Monographs,73, 243–260.
Levine, T. R., Park, H. S., & McCornack, S. A. (1999). Accuracy in detecting truths and lies: Documenting the “veracity effect.”.Communication Monographs,66, 125–144. Levine, T. R., Serota, K. B., Shulman, H., Clare, D. D., Park, H. S., Shaw, A. S.,… Lee, J. H.
(2011). Sender demeanor: Individual differences in sender believability have a powerful impact on deception detection judgments.Human Communication Research,37, 377–403.
Levine, T. R., Shaw, A., & Shulman, H. (2010b). Increasing deception detection accuracy with direct questioning.Human Communication Research,36, 216–231.
McCornack, S. A., & Parks, M. R. (1986). Deception detection and relationship development: The other side of trust. In M. L. McLaughlin (Ed.),Communication Yearbook 9(pp. 377–389). Beverly Hills, CA: Sage.
Park, H. S., & Levine, T. R. (2001). A probability model of accuracy in deception detection experiments.Communication Monographs,68, 201–210.
Serota, K. B., & Levine, T. R. (2015). A few prolific liars: Variation in the prevalence of lying.
Journal of Language and Social Psychology,34, 138–157.
Serota, K. B., Levine, T. R., & Boster, F. J. (2010). The prevalence of lying in America: Three studies of reported deception.Human Communication Research,36, 1–24.