Jurnal Natural
Vol.18, (2) 2018DOI 10.24815/jn.v0i0.7032
Published June 2018 pISSN 1411-8513 eISSN 2541-4062
56
MOLECULAR IDENTIFICATION OF
Shorea
johorensis
IN KETAMBE RESEARCH STATION,
GUNUNG LEUSER NATIONAL PARK
Nir Fathiya
1, Essy Harnelly
2*, Zairin Thomy
2and Iqbar
21
Master Program of Biology, Biology Department, Faculty of Mathematics and Natural
Sciences, Syiah Kuala University, Jalan Tgk Chik Pante Kulu No. 5, Banda Aceh 23111,
Indonesia
2
Biology Department, Faculty of Mathematics and Natural Sciences, Syiah Kuala
University, Jalan Tgk Chik Pante Kulu No. 5, Banda Aceh 23111, Indonesia
*
Corresponding author, e-mail: [email protected]
Abstract. Shorea johorensis is one of the red meranti plants in Ketambe Research Station, Gunung Leuser National Park, Aceh Tenggara. Currently, Shorea johorensis also is well known as a major source of valuable commercial timber. This research aims to analyze the phylogenetic of Shorea johorensis based on chloroplast and nuclear DNA in Ketambe Research Station so that it can be known the relationship of Shorea johorensis
with other species of Dipterocarpaceae in GenBank database. The research was conducted from July 2015 to August 2016 in Ketambe Research Station and Forestry and Forest Genetics Laboratory of Molecular, Bogor Agricultural University. The method used quadrat sampling technique with purposive sampling and experimental laboratory that consisted of DNA extraction, PCR, electrophoresis, and sequencing. The data analysis was done using BLAST, BioEdit, and MEGA6. The results showed that the phylogenetic tree of
Shorea johorensis based on the rbcL and matK showed that Shorea johorensis was closely related with
some species of Hopea; but the phylogenetic tree based on psbA-trnH, 5.8S rRNA, ITS2, and 28S rRNA showed that Shorea johorensis was closely related with Shorea robusta.
Keywords: Chloroplast DNA, Ketambe Research Station, Nuclear DNA, Shorea johorensis
I INTRODUCTION
Gunung Leuser National Park is one of Nature Conservation Areas in Indonesia covering an area of 1.094.692 hectares. This national park is located in Aceh and Sumatera Utara provinces. It is known as one of the World Heritage Sites for the rainforest which has several ecosystems from the coast to the high mountains [1]. One of the research stations in Gunung Leuser National Park is Ketambe Research Station. Ketambe Research Station has high and unique biodiversity. It lies in Aceh Tenggara district. A few Dipterocarpaceae species is found growing in Ketambe Research Station [2]. Dipterocarpaceae is the most typical family of tropical forest trees in the Malesian region with a geographical distribution that extends to South America and Africa. The family comprises approximately 500 species in 17 genera. It is subdivided into three subfamilies: Dipterocarpoideae, Monotoideae, and Pakaraimoideae. Dipterocarpoideae comprises 470 species in 13 genera [3]. The most Dipterocarpaceae are large trees with towering top reaching 70-80 m. Dipterocarpaceae dominate in tropical lowland forest [4]. The
57 maternally inherited shows more conserved
DNA patterns compared with a nuclear gene that is biparentally inherited. Several regions of chloroplast genome are rbcL gene, matK gene, and psbA-trnH intergenic spacer. The rbcL gene is a gene encoding a large subunit of ribulose 1.5 bisphosphate carboxylase (Rubisco or RuBPCase), which is important for photosynthesis. The sequence of rbcL gene data is extensively used in the reconstruction of the whole seed plants phylogeny because it has a fairly conservative level of evolution [8]. On the other hand, the matK gene is a gene encoding the maturase enzyme subunit K. In plant systematics, matK appears as a valuable gene because it has a high phylogenetic signal than another gene [9]. The psbA-trnH intergenic spacer is an evolutionary plastid region and employed as a phylogenetic marker [10].
In addition, nuclear DNA is also generally used in evolutionary as well as phylogenetic studies. Nuclear DNA is transmitted from parent to offspring by nuclear division through sexual or asexual reproduction [11]. Since a nuclear genome is biparentally inherited, it is expected to provide more information than a chloroplast or mitochondrial genome on species identity, including hybridization. One of the most useful types of nuclear DNA sequences is the Internal Transcribed Spacer
(ITS) region, which contains multiple DNA copies. The ITS region lies between 16S and 28S nuclear ribosomal DNA (nrDNA). Several years ago, ITS regions were often used by experts for molecular phylogenetic analysis on plants in order to understand diversity and answer some issues phylogenetic. This is because the ITS region has superior characteristics namely, has small size (approximately 700 base pairs) and a lot of copying in the nuclear genome [12]. These characteristics cause the ITS region to be easy to be isolated, amplified, and analyzed. Therefore, this research aims to analyze the phylogenetic of Shorea johorensis based on chloroplast and nuclear DNA in Ketambe Research Station so that the relationship of Shorea johorensis with some species in Dipterocarpaceae can be determined.
II METHODOLOGY
Study Area
The research was conducted in Ketambe Research Station, Gunung Leuser National Park, Aceh Tenggara and Forestry and Forest Genetic Laboratory of Molecular, Bogor Agricultural University. The research was begun on July 2015 to August 2016. The location of the research area is showed from the map (Figure 1).
Molecular Identification of Shorea johorensis In Ketambe Research Station, Gunung … (Nir Fathiya, Essy Harnelly, Zairin Thomy and Iqbar)
_________________________________________________________________________________________________
58 Samples collection
Samples of Dipterocarpaceae were collected from Ketambe Research Station, Gunung Leuser National Park, Aceh Tenggara (Figure 1). Samples were collected using Quadrat Sampling Technique. Intake of vegetation data by sampling plot was done by purposive sampling. There were 25 plots with an area of each plot 20 x 20 m [13]. The total area of the plots was 1 ha 10.000 m2. Samples consisted of leaves from sampling stage, pole stage, or tree of Dipterocarpaceae. Three individuals per species were collected represent Ketambe Research Station location. The three individual samples had the same ID number, and they were numbered individually. Three sets of specimen leaves were collected from each individual sample: (a) two sets of leaves for the herbarium (leaves must have important taxonomic characters such as leaf tip, leaf surface, stipule, pteolus/leaf stalk). Specimens for herbarium were put on paper sheets, and moistened with 70% alcohol. The specimens were dried and glued on herbarium paper pairs. Specimens were labeled information such as ID numbers, collector name, collection date, and taxonomy. Identification of samples was done using Dipterocarpaceae identification book; and (b) a set of leaves for DNA extraction (soft, fresh, and young leaf tissue). Specimen for DNA extraction: leaf sheets were cleaned with the dry cloth. Specimens were placed into an existing sac containing another sac filled with silica gel (ratio of silica gel 5-10: 1). The ID number of the specimens were written on the outside of the bag using a permanent marker. All packets/bags of the specimen were stored in containers [14].
DNA Extraction
DNA extraction was carried out using Cetyltrimethyl Ammonium Bromide (CTAB) method developed by Doyle and Doyle [15]. Young leave of 200 mg was ground in a mortar with liquid nitrogen. The leaf powder was put into 2 mL tubes, 500 extraction buffer solutions and 100 μL polivinilpirodin (PVP) solution were added. The mixture was vortexed
and then incubated in a water heater (waterbath) for 60 min at a temperature of 65ºC and every 15 min once reversed. After cooling to room temperature for 15 min, the mixture was added with 500 μL chloroform-isoamyl alcohol (24:1) and centrifuged for 10 min at 10,000 rpm. The upper layer (water phase/supernatant) was separated from the organic phase by using the micropipette into the new tube. Chloroform-isoamyl alcohol was added twice. The Supernatant was addes with 500 μL cold isopropanol and NaCl of 300 μL. Samples were incubated overnight in the freezer. The precipitation result was centrifuged at 10.000 rpm for 10 min. The DNA pellet was washed twice using 96% ethanol of 300 μL and dried in a desiccator for 15 min. The dried DNA was added with 50 μL TE buffer (5 M Tris-HCl pH 8.0; 0.5 M EDTA pH 8.0). The DNA then was flicked and centrifuged at 10,000 rpm for 2 min. DNA was stored at -20ºC in the freezer. Polymerase Chain Reaction (PCR)
For chloroplast DNA, The final conditions of each PCR reaction were 16 μL consisted of 8 μL Green GoTaq DNA polymerase, 2 μL Nuclease-Free Water, 2 μL primer (forward), 2 μL primer (reverse), and 2 μL DNA template. The primers were rbcL, matK, and psBA-trnH. The temperature settings of the thermocycler were the initial denaturation at 95°C for 4 min were mixed into one tube. The temperatures for PCR machine were started by initial denaturation at 94ºC for 3 min; 30 cycles 3 stages: (at 94ºC for 30 s), annealing (at 58ºC for 30 s), and extension (at 72ºC for 1 min); and elongation stage at 72ºC for 10 min. The primers in this study were ITS1 and ITS4 (Table 1).
Table 1 Primers Data in This Study
DNA region Primer Sequence (5’
59 Gel electrophoresis
The result of PCR (DNA) was visualized by 1% agarose gel electrophoresis. Gel electrophoresis procedure consisted of making agarose gel, sample loading into the gel, running electrophoresis, and observation of electrophoresis running with UV transilluminator. For the DNA extraction, gel electrophoresis was done by using electric current with a voltage of 100 volt for 45 min and for the PCR, the process of running electrophoresis was for 30 min with a voltage of 100 volt. The results of running electrophoresis were observed using UV transilluminator.
Sequencing
The nucleotide sequence of the amplicon was identified using the Sanger method carried out by 1st BASE Sequencing INT in Malaysia. The sequencing process was done twice with different directions (forward and reverse). The sequencing data were used for the construction of phylogenetic trees.
Data analysis
The result of sequencing were analyzed with the following stages: (i) Annotation of ITS2 Sequence using ITS2 Database [22], (ii) BLAST (Basic Local Alignment and Search Tool) sequence using GenBank Database, (iii) Sequence alignment using Bioedit program [23], (iv) The result of sequence alignment was used to develop phylogenetic tree by Neighbor Joining (NJ) method with MEGA (Molecular Evolutionary Genetics Analysis) version 6 [24], (v) The reliable test of the tree was done by the bootstrap method 1000 times.
III RESULT AND DISCUSSION
A. The result of Electrophoresis Gel
DNA Extraction
DNA extraction is a method of separating DNA from other cell components. The extraction of DNA Dipterocarpaceae was performed to obtain DNA from the genome total of Shorea johorensis which were used as DNA template for PCR amplification process. The most methods for DNA extraction used CTAB buffer solution as cell wall degradation because it has advantages i.e., easy to do and the possibility of DNA degrading enzymes is smaller than other methods [25]. Based on the visualization of electrophoresis result in Figure 2, there were DNA bands of the three samples. All of DNA bands look thick, so the process of DNA extraction was successful.
Figure 2 The Results of Gel Electrophoresis of DNA Extraction Shorea johorensis (M = Marker 1 kb DNA Ladder; 1 =
Shorea johorensis 1; 2 = Shorea
johorensis 2; 3 = Shorea johorensis 3
PCR Amplification
PCR Amplification was performed to multiply Shorea johorensis genomic DNA strands with the target of the rbcL, matK, psbA-trnH, and ITS region. The result of electrophoresis is presented in Figure 3.
Figure 3 The results of Gel Electrophoresis of PCR Amplification (1-3 = (Shorea
johorensis 1, Shorea johorensis 2, and
Shorea johorensis 3; rbcL sequences);
4-5 = (Shorea johorensis 1 and Shorea
johorensis 2; matK sequences); 6-8 =
(Shorea johorensis 1, Shorea
johorensis 2, and Shorea johorensis 3;
ITS sequences); 9-10 = (Shorea
johorensis 1 and Shorea johorensis 2;
psbA-trnH sequences); 1kb DNA Ladder (bp): 250, 500, 750, 1000, 1500, 2000, 2500, 3000, 3500, 4000, 5000, 6000, 8000, 10000; 100bp DNA Ladder (bp): 100, 200, 300, 400, 500, 600, 700, 800, 900, 1000, 1500)
Molecular Identification of Shorea johorensis In Ketambe Research Station, Gunung … (Nir Fathiya, Essy Harnelly, Zairin Thomy and Iqbar)
_________________________________________________________________________________________________
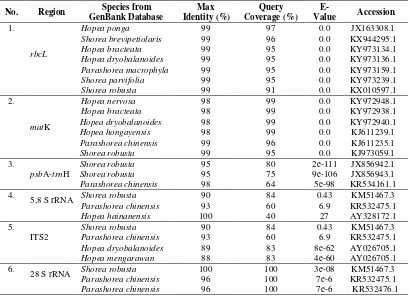
60 Table 2 The result of BLAST Analysis of Shorea johorensis
successfully done but for matK and trnH-psbA only two samples were successfully amplification and sequencing. One of the successes of amplification is affected by the primer. In this study, all primers are universal primers for recognizing regions of Angiospermae plant. All of the ten samples of DNA bands look quite thick.
B. BLAST Analysis
The Basic Local Alignment Search Tool (BLAST) finds regions of local similarity between sequences. The program compares nucleotide or protein sequences to sequence databases and calculates the statistical significance of matches. BLAST can be used to infer functional and evolutionary relationships between sequences as well as help identify members of gene families [26]. The result of BLAST Analysis of Shorea johorensis can be seen in Table 2. The results of BLAST analysis of Shorea johorensis based on rbcL showed that this Shorea had similarity with some species of Shorea and Hopea. Shorea johorensis had the highest similarity with Hopea ponga. Shorea johorensis had the maximum identity value 99%, the query coverage 97%, and the E-value 0.0 with Hopea ponga. According to Ref. [27], maximum identity is the highest value of the percentage of identity or compatibility
between a query sequence (sequence research) with sequence from GenBank database.
Query coverage is the percentage of the nucleotides length aligned with the existing database on BLAST. According to Ref. [28] the value of an E-value is an alleged value that gives statistically significant sizes to the second sequence. The higher value of E-value indicates the lower homology between sequences, while the lower E-value indicates the higher homology between sequences. An E-value of 0 indicates the both of sequences are identical. For matK, Shorea johorensis had similarity with some species of Shorea and Hopea. Shorea johorensis had the highest similarity with Hopea nervosa. Shorea johorensis had the maximum identity value 99%, the query coverage 98%, and the E-value 0.0 with Hopea nervosa. Shorea Johorensis based on psb A-trnH had the highest similarity with Shorea robusta. Shorea johorensis had the maximum identity value 95%, the query coverage 80%, and the E-value 2e-111 (far enough from 0) with Shorea robusta. It caused there were only a few sequences psbA-trnH of Dipterocarpaceae in GenBank database.
ITS1 and ITS4 primers can amplify ITS region from 16S until 28S nuclear ribosomal DNA. In this study, there were 3 parts of ITS region for phylogenetic analysis namely, 5.8S rRNA gene, ITS2, and 28S rRNA gene. The results of
No. Region Species from
GenBank Database
Max Identity (%)
Query Coverage (%)
E-Value Accession
1.
rbcL
Hopea ponga 99 97 0.0 JX163308.1
Shorea brevipetiolaris 99 96 0.0 KX944295.1
Hopea bracteata 99 95 0.0 KY973134.1
Hopea dryobalanoides 99 95 0.0 KY973136.1
Parashorea macrophyla 99 95 0.0 KY973159.1
Shorea parvifolia 99 95 0.0 KY973239.1
Shorea robusta 99 91 0.0 KX010597.1
2.
matK
Hopea nervosa 98 99 0.0 KY972948.1
Hopea bracteata 98 99 0.0 KY972938.1
Hopea dryobalanoides 98 99 0.0 KY972940.1
Hopea hongayensis 98 99 0.0 KJ611239.1
Parashorea chinensis 99 96 0.0 KJ611235.1
Shorea robusta 99 95 0.0 KJ973059.1
3.
psbA-trnH
Shorea robusta 95 80 2e-111 JX856942.1
Shorea robusta 95 75 9e-106 JX856943.1
Parashorea chinensis 98 64 5e-98 KR534161.1
4.
5,8 S rRNA Shorea robusta 90 84 0.43 KM51467.3
Parashorea chinensis 93 60 6.9 KR532475.1
Hopea hainanensis 100 40 27 AY328172.1
5. ITS2
Shorea robusta 90 84 0.43 KM51467.3
Parashorea chinensis 93 60 6.9 KR532475.1
Hopea dryobalanoides 89 83 8e-62 AY026705.1
Hopea mengarawan 88 83 4e-60 AY026705.1
6.
28 S rRNA Shorea robusta 100 100 3e-08 KM51467.3
Parashorea chinensis 96 100 7e-6 KR532475.1
61 BLAST of Shorea johorensis based on 5.8 S
rRNA showed that there were only 3 sequences of 5.8 S rRNA available in the NCBI database i.e., Shorea robusta, Parashorea chinensis, and Hopea hainanensis. Shorea johorensis had the highest similarity to Shorea robusta. Shorea johorensis had the Shorea showed similarity with some species of Shorea and Hopea. However, only 4 sequences were selected, i.e., Shorea robusta, Parashorea chinensis, Hopea dryobalanoides, and Hopea mengarawan. The highest similarity was owned by Shorea robusta. Shorea johorensis had the maximum identity value 90%, the other species showed low homology level with Shorea johorensis. For 28S rRNA, this Shorea showed that there were only 3 sequences of 28S rRNA available in the NCBI database i.e., Shorea robusta, Parashorea chinensis (KR532475.1), and Parashorea chinensis (KR532475.1). Shorea johorensis had the highest similarity to Shorea robusta. Shorea johorensis had the maximum identity value and the query coverage value 100% with Shorea robusta.
The E-value between of these sequences 3e-08. The result of BLAST analysis based on 28S rRNA showed the highest similarity with the same species in 5.8S rRNA and ITS2 (Shorea robusta), but it had the difference of E-value with them. Overall, Sequence data from Shorea johorensis based on rbcL, matK, psbA-trnH, 5.8S rRNA, ITS2, and 28S rRNA have not been found in the NCBI database, so this Shorea had the highest similarity to other Dipterocarpaceae species. In addition, chloroplast DNA analysis of Dipterocarpaceae showed the difficulty of distinguishing between closely related species in the genera level primarily to indicate the species of Shorea. In fact, several types in the same tribe have identical sequences [29].
C. PHYLOGENETIC TREE
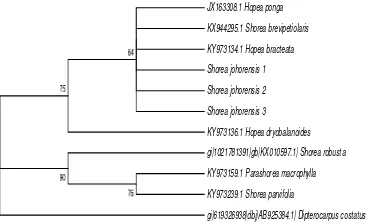
Phylogenetic Tree of Shorea johorensis based on rbcL
The construction of phylogenetic tree was conducted using MEGA 6 program with Neighbor Joining (NJ) method. The construction of phylogenetic tree aims to determine the relationship of among several Dipterocarpaceae species. Based on Figure 4, there were two groups (clades) namely group 1 and group 2. The first group had bootstrap value 75, consisted of Hopea ponga, Shorea brevipetiolaris, Hopea bracteata, Shorea johorensis, and Hopea dryobalanoides. The second group had bootstrap value 90 consisted of Shorea robusta, Parashorea macrophylla, and Shorea parvifolia.
Molecular Identification of Shorea johorensis In Ketambe Research Station, Gunung … (Nir Fathiya, Essy Harnelly, Zairin Thomy and Iqbar)
_________________________________________________________________________________________________
62 Dipterocarpus costatus was an outgroup
because it had a distant relationship with Dipterocarpaceae research samples. According to Ref. [38], in the analysis of phylogenetics, outgroup lead to the polarization of characters or characteristics, namely apomorphic and plesiomorphic characters. The apomorphic character is the changed and derived characters which were found in the ingroup (species which were studied), whereas the plesiomorphic character is the primitive character found in the outgroup. The synapomorphic character is a derived character in the monophyletic group.
Phylogenetic Tree of Shorea johorensis based on matK
The pylogenetic tree of Shorea johorensis based on matK is presented in Figure 5. There were two monophyletic groups. The first group had bootstrap value 100, consisted of Shorea johorensis, Hopea bracteata, Hopea dryobalanoides, and Hopea nervosa. The second group had bootstrap value 89, consisted of Parashorea chinensis and Shorea robusta.
Figure 5 The phylogenetic tree of Shorea johorensis
based on matK gene using the neighbor joining method
Shorea johorensis had a closer relationship with some of Hopea than Parashorea chinensis or Shorea robusta. Based on this phylogenetic tree, the matK gene also was not able to separate Shorea, Hopea, and Parashorea to different monophyletic. The phylogenetic analysis using trnL-trnF, trnL, and matK from several species of Dipterocarpoidea also showed that Hopea formed monophyletic with several of Shorea [39]. Dipterocarpus costatus was an outgroup because it had a distant relationship with Dipterocarpaceae research samples.
Phylogenetic Tree of Shorea johorensis based on psbA-trnH
Based on Figure 6, Shorea johorensis formed the monophyletic group with Shorea robusta (bootstrap value 100). It means this Shorea had a closer relationship with Shorea robusta than Parashorea chinensis. Based on morphology data, Shorea robusta showed some similarities
in morphological characters with Shorea johorensis. Shorea robusta is a large, deciduous tree up to 50 m tall (but these are exceptional sizes), and under normal conditions Shorea robusta trees have a height of about 18-32 m and girths of 1.5-2 m; the bole is clean, straight and cylindrical, but often bearing epicormic branches; the crown is spreading and spherical. The bark is dark brown and thick, with longitudinal fissures deep in poles, becoming shallow in mature trees [40]. Dipterocarpus zeylanicus was an outgroup.
Figure 6 The phylogenetic tree of Shorea johorensis
based on psBA-trnH using the neighbor joining method
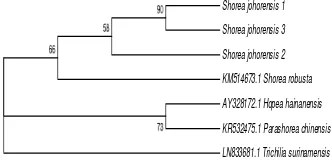
Phylogenetic Analysis Based on 5.8S rRNA All of the three individuals of shorea johorensis formed a monophyletic group with Shorea robusta (first group). This group had bootstrap value 66. Hopea hainanensis and Parashorea chinensis also formed a monophyletic group with bootstrap value 73 (second group). There were 3 genera of Dipterocarpaceae i.e., Shorea, Parashorea, and Hopea. Shorea was separate with Parashorea (Figure 7). This is in accordance with the analysis of nuclear DNA conducted by Ref. [36], Shorea and Parashorea were separate and not belonging to a monophyletic group.
Figure 7 The phylogenetic tree of Shorea johorensis
based on 5.8S rRNA using the neighbor joining method
In addition, Shorea also formed a separate group with Hopea. This is in contrast to rbcL and matK genes where Shorea formed a monophyletic group with Hopea. It means that ITS2 was able to separate Shorea with Parashorea and Hopea but not able to separate Parashorea with Hopea. Trichilia surinamensis was an outgroup because it had a distant
JX856943.1 Shorea robusta isolate 95
JX856942.1 Shorea robusta isolate 237
63 Phylogenetic Analysis Based on ITS2
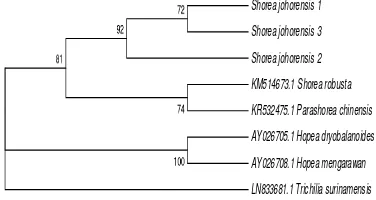
The three individuals of Shorea johorensis formed a monophyletic group with Shorea robusta and Parashorea chinensis with bootstrap value 81 (Figure 8). This is in accordance with chloroplast DNA analysis research by Ref. [14 and 33], Parashorea formed a monophyletic group with Shorea. In addition, molecular data from Ref. [34, 35, and 36] also explained that Parashorea was relatively close to several species of Shorea.
Figure 8 The phylogenetic tree of Shorea
johorensis based on ITS2 using the
neighbor joining method
Hopea mengarawan and Hopea
dryobalanoides formed a monophyletic group with bootstrap value 100. Based on this phylogenetic tree it appears that Shorea and Parashorea formed a separate group with Hopea. It means that ITS2 was able to separate Shorea with Hopea but not able to separate Shorea with Parashorea. Trichilia surinamensis was an outgroup because it had a distant relationship with other samples.
Figure 9 The phylogenetic tree of Shorea johorensis
based on 28S rRNA gene using the neighbor joining method
Phylogenetic Analysis Based on 28S rRNA
Based on Figure 9, all of the three individuals of Shorea johorensis formed a monophyletic group with Shorea robusta (bootstrap value 62). This Shorea formed the separate group with Parashorea chinensis. This is in accordance with the nuclear DNA analysis performed by [36], where Parashorea and
Shorea were separated and not belonging to a monophyletic group. Trichilia surinamensis was an outgroup.
CONCLUSION
The phylogenetic tree of Shorea johorensis based on the rbcL and matK showed that Shorea johorensis was closely related with some species of Hopea; but the phylogenetic tree based on psbA-trnH, 5.8S rRNA, ITS2, and 28S rRNA showed that Shorea johorensis was closely related with Shorea robusta.
ACKNOWLEDGMENT
This project was funded by Directorate General of Higher Education (DIKTI), Ministry of Research, Technology and Higher Education, Indonesia through the fundamental scheme. The authors also thank Laboratory of Forest Genetics and Molecular Forestry, Bogor Agricultural University, Gunung Leuser National Park Office, and Leuser Conservation Forum which have been very helpful in conducting this research.
REFERENCE
1. TNGL. [internet] 2018 Tentang TNGL
available fom
http://gunungleuser.or.id/tentang- kami/tentang-tngl/
2. Djojosudharmo S Atmoko USS, Azwar Istiadi Y 2007 Ketambe, Potensis Ekologi, Keanekaragaman Hayati, dan Sosial Masyarakat (Medan: Balai Besar TNGL) 3. Ashton PS 1982 Dipterocarpaceae. Flora
Malesiana Series I Spermathopyta, Vol.9, Part 2 (The Netherland: Sijthoff & Noordhoff International Publishers Alphen aan den Rijn)
4. Newman M F Burgess P F Whitmore T C 1999 Pedoman Identifikasi Pohon- pohon Dipterocarpaceae di Indonesia (Bogor: Prosea)
5. Appanah S 1998 A Riview of Dipterocarps: Taxonomy, Ecology and Sylviculture (Bogor: CIFOR)
6. Sutedjo Wahyuni H Marjenah Wawan K Sumaryono Djumali Mardji Rujehan 2014 Shorea johorensis Foxw dan Shorea leprosulaMiq Ekologi, Silvikultur, Budidaya dan Pengembangan (Samarinda: Balai Besar Penelitian Dipterokarpa) 7. Raubeson L A and Jansen R K 2005
Chloroplast genomes of plants (United Kingdom: Oxfordshire)
8. Doebley J Durbin M Golenberg E M Clegg M T and Ma D P 1990 J. Evolution. 44 1097-1108.
9. Muller K. and Borsch A T 2005 J. Plant Syst. Evol. 250 39–67.
Shorea johorensis 1
Shorea johorensis 3
Shorea johorensis 2
KM514673.1 Shorea robusta
KR532475.1 Parashorea chinensis
AY026705.1 Hopea dryobalanoides
AY026708.1 Hopea mengarawan
LN833681.1 Trichilia surinamensis
Shorea johorensis 1
Shorea johorensis 2
Shorea johorensis 3
KM514673.1 Shorea robusta
KR532475.1 Parashorea chinensis isolate BB0377
KR532476.1 Parashorea chinensis isolate BB0378
Molecular Identification of Shorea johorensis In Ketambe Research Station, Gunung … (Nir Fathiya, Essy Harnelly, Zairin Thomy and Iqbar)
_________________________________________________________________________________________________
64 10. Aldrich J B W crnheey E Merlin and L
Christopherson 1988 J. Current Genetics. 14 137–146
11. Simpson M G 2006 Plant Systematics 1st edition (Elsevier-Academic Press) 12. Baldwin B G M J Sanderson J M Porter
M F Wojciechowski C S Campbell and M J Donoghue 1995 J. Annual Missouri Botanic Garden 82 247-277.
13. Indriyanto 2006 Ekologi Hutan (Jakarta: Bumi Aksara)
14. Harnelly E Thomy Z and Fathiya N 2018 J.Biodiversitas 19(3) 1074-1080
15. Doyle J and L Doyle 1987 J Focus. 12 13– 15
16. Kristina A V Iskandar Z S and Yunanto T 2007 Manual Analisis Genetik Tanaman Hutan di Laboratorium Silvikultur (Bogor: IPB)
17. Kress W J and Erickson 2007J. Plos ONE.2(6) e 508
18. Jing Yu Xue J H and Zhou S L 2011 J. Systematics and Evolution. 49 (3) 176–181 19. Sang D T Crawford J and Tuessy T F S
1997 J. American Journal of Botany 84 (9) 1120-1136
20. Tate J A and Simpson B B 2003 J. Systematic Botany. 28 (4) 727-737 21. White T J T Bruns S Lee and J Taylor 1990
Amplification and Direct Sequencing of Fungal Ribosomal RNA Genes for Phylogenetics (San Diego: Academic Press, Inc)
22. Koetschan C and Wolf M 2010 J. Nucleic Acids Research. 38 275-279
23. Hall B G 2011 Phylogenetic Trees Made Easy A How-to Manual Fourth edition (Sunderland: Sinauer Associates Inc) 24. Tamura K Peterson D Peterson N Stecher
G Nei M and Kumar S 2011 J.Nucleus. 2 168–172
25. Roger S O and A J Bendich 1994 Extraction of Total Celluler DNA from Plant, Algae, and Fungi. 2nd ed., (Dordrecht: Kluwer Academic Publisher) 26. NCBI. [internet] 2018 BLAST (Basic
Local Alignment Search Tool) United
State available from
https//www.ncbi.nlm.nih.gov
27. Miller A G Beckwith R Fellbaum C Gross D and Miller K 1990 WordNet: An Online Lexical Database. International journal of lexicography
28. Claverie J M and Notradame C 2007 Bioinformatics for Dummies 2nd Edition (Indiana: Wiley Publishing Inc Indianapolis)
29. Yulita K S Bayer R J and West J G 2005 J. Plant Species Biology 20 167-182
30. Campbell N A Reece J B Urry L A Cain M L Wasserman S A Minorsky P V and Jackson R B 2003 Biologi Jilid II Edisi Kelima (Jakarta: Erlangga)
31. Cao P C Oliver G Iskandar Z Siregar Ulfah J Siregar and Reiner F 2009 J.Tree Genetics and Genomes 5 407-420.
32. Tsumura Y Kado T Yoshida K Abe H Ohtani, M., Taguchi Y Fuku Y Tani N Ueno S Yoshimura K Kamiya K Harada K Takeuchi Y Diway B Finkeldey R Na’im M Indrioko S Siong-Ng K K Muhammad N and Lee S L 2011 J. Plant Res. 124 (1) 35-48
33. Indrioko S Gailing O and Finkeldey R 2006 J. Plant Syst Evol. 261 99-115
34. Tsumura Y Kawahara T Wickneswari R and Yoshimura K 1996 J. Theor Appl Genet 93 22-29
35. Kajita T Kamiya K Nakamura K Tachida HWickneswari R Tsumura Y Yoshimaru H Yamazaki T 1998 J. Moleculer Phylogenetic Evolution 10 202-209 36. Kamiya K Harada K Tachida H Ashton P S
2005 J. Am J Bot. 92 775-788
37. Dayandan S Ashton P S Wilhams S M Primack R B 1999 J.Am. J. Bot. 86 (8) 1182-1190
38. Hidayat T and Pancoro 2008 J. AgroBiogen 4(1) 35-40
39. Gamage D T de Silva M. P Inomata N Yamazaki T and Szmidt A E 2006 J. Genes Genet. Syst. 2006 81 1-12