Journal of Home Affairs Governance p-ISSN: 2085-4323 | e-ISSN: 2503-3360 Jurnal Bina Praja
P : R D A
M H A R I
Bina Praja Vol. 8 Iss. 2 pp. 175-340 p-ISSN: 2085-4323 e-ISSN: 2503-3360 Accredita 735/AU2/P2MI-LIPI/04/2016
Valid thru: 24 April 2019 Jakarta, November 2016
Jurnal Bina Praja 8 (2) (2016): 317-329
Jurnal Bina Praja
e-ISSN: 2503-3360 p-ISSN: 2085-4323
www.binaprajajournal.com
The Modelling of Strengthening Indicators Development
in Regional Innovation System and Its Effect
on the Gross Domestic Product
Rislima F. Sitompul
1, *, Ophirtus Sumule
21 Appropriate Technology Development Center (PPTTG)
Indonesian Institute of Sciences (LIPI) Jl. KS Tubun No. 5, Subang-Jawa Barat 41213
2 Innovation Systems Directorate
Ministry of Research, Technology and Higher Education (Kemenristekdikti) Jl. MH Thamrin No. 8, Jakarta
Received: 20 June 2016; Accepted: 7 October 2016; Published online: 30 November 2016
DOI: 10.21787/jbp.08.2016.317-329
Abstract
This study aims to revise the indicators of measuring Regional Innovation System (SIDa) component in order to
simplify the measurement such that it can directly influence the improvement of success indicators in a region or district.
Measuring the components of SIDa for all regions are necessary as the baseline of policy parameters for the Government in developing SIDa so that the implementation the policy on innovation systems become more effective. In this study, the
modeling is focused on refining the existing parameters that have been previously developed for strengthening policy
implementation of SIDa applied in each region. Modeling and development of these indicators are required in order to result as a reference for solving problems in the implementation of SIDa and can be used as reference material to establish an appropriate and effective patterns of regional development approach. The analysis tool used is multiple regression analysis using an Ordinary least square technique. Results of regression modeling produced a valid model
with all independent variables significant and positive impact on the SIDa. Regression analysis shows that strengthening SIDa of all provinces in Indonesia provide significant and positive impact in increasing the Gross Domestic Products
(GDP). Likewise, the success indicators show the positive effect, which means that implementation of SIDa has proven to increase the benchmark indicators of the region.
Keywords: regression analysis, GDP, the Joint Regulation, SIDa, innovation system.
I. Introduction
The development and strengthening of regional innovation systems (SIDA) are one of the main strategies in strengthening the national innovation system (SINAS) which facilitates the process of integration between the different strengthening components. The strengthening of SIDA is done to accommodate the National Medium-Term Development Plan (RPJMN 2010-2014) followed by RPJMN 2015-2019 through the territorial dimension development approach in order to accommodate the dynamics, capacity, and capability of the region in national development planning. The principal issues in regional development lie
According to Kemenristek and Kemendagri. (2012), innovation is the activity of research, development, implementation, assessment, engineering, and operation hereinafter referred to as kelitbangan aimed at developing a value practical application and the context of new knowledge or new ways to apply the existing science and technology in the product or the production process. Regional Innovation System, hereinafter abbreviated as SIDA, is the whole process in one system to foster innovation done by inter-governmental institutions, local governments, kelitbangan institutions, educational institutions, innovation supporting institutions, businesses, and communities in the area.
Innovation system can also be interpreted as a network between public and private institutions within the national (SINas) or the regional (SIDA) territory, in which the interactions happen with coherent activities of producing knowledge, implement and disseminate, resulting in real benefits that can be perceived by the public. According to Nelson (1993), innovation system is a set of actors who collectively play an important role in influencing the innovative performance.
With the innovation system, it is expected that the society can be independent with the resources owned, solve various problems, foster innovation and research in science and technology, and has the advantages and competitiveness. To encourage innovation, required a synergy of three parties in the ABG (Academics, Bussiness, and Government), known as triple helix concept. This synergy aims to solve various problems, fostering innovation and research in the field of science, and the technology that has advantages and competitiveness. In the context of regional development, the increase of competitiveness through the use of science and technology requires community participation, in which each Regency/City seeks to build and grow the economy in the region. The concept of innovation system then developed a concept called Quadro Helix (Academic, Business, Governance and Community), or often called ABG-C.
Ismiatun (2015) explains that in each regency/city should be developed a synergistic integration pattern between 4 functions/ roles of economic institutions that complement each other, namely between (i) the Government of Regency/City (functions and is responsible for creating a conducive business climate, through policy and economic regulation that stimulates and simultaneously protect the industry in the region as well as integration between regencies/cities in the region of its economy corridor), (ii) university/ research institution (functions and is responsible for creating the knowledge and technology to increase the added value of innovative products/processes
in the territory), (iii) industry Group (functions and is responsible for building industry products/ services that create the value-added economy in the territory); and (iv) Community Group or Business Community (functions and is responsible for creating a community to share knowledge and experience among members of the community).
Through the Joint Regulation of the Minister of Research and Technology with the Minister of Home Affairs No. 3 of 2012 and No. 36 of 2012, the strengthening of the regional innovation system (SIDA) is organized to develop a system or a network that will enhance regional comparative advantage to competitive advantage that has a competitiveness based on innovation in the area. Ismiatun (2015) explains that in each regency/city should be developed a synergistic integration pattern between 4 functions/roles of economic institutions that complement each other, namely between (i) Regency/City Government (ii) university/research institution (iii) Industry Group (functions and is responsible for building industry products/services that create value-added economy in the territory); and (iv) Community Group or Business Community.
The development strategy of Regional Innovation System (SIDA) continues to be developed in order to strengthen the National Innovation System (SINas). In order for the implementation of policies in the area of innovation system be more effective, needed a components measurement on the strengthening of SIDA around the area that can be used as a baseline of policy parameters for decision making in developing the innovation system in the area.
The principal issue in regional development lie in its emphasis on development policies that are based on the uniqueness of the region concerned (endogenous development) by using the potential of human resources, institutional, and local physical resources. This orientation will lead to taking initiatives emanating from the area in the development process to create new employment opportunities and stimulate economic activity.
Within the framework of the availability and the ability of regions/provinces in the implementation of the strengthening of SIDA, in 2014 the Ministry of Research and Technology (now the Ministry of Research, Technology, and Higher Education) and the Ministry of Home Affairs (MOHA) has been measuring the strengthening of SIDA in all provinces as a baseline that is used as a parameter of the implementation of policies applied in the region, followed by modeling and development of indicators in strengthening the SIDA in each region (Kemenristek and Home Affairs, 2014). For the regions, this measurement result can be used as a base in implementing the Strengthening of SIDA. Thus, there will be a harmony between the central and regional policies in maintaining the continuity of the implementation of innovations in the area which in turn will have an impact on national innovation (Kemenristek, 2014).
In 2015, Kemenristekdikti conducted a study on the innovation clusters in 10 regencies/cities, each with different provinces, namely Regencies: Riau Islands, Rejang Lebong, Ogan Ilir, Sukabumi, Banyumas, Madiun, Polewali Mandar, Luwu Utara, Toraja Utara and Gorontalo. Based on the study, generated data and information related to the resource potential, technology needs, regulations and institutions in targeted areas as the basis for recommendations for the implementation of appropriate technology, in terms of regulatory policy and institutional (Kemenristekdikti and PPTTG LIPI, 2015). This innovation cluster study will be used in planning and implementation of programs to strengthen SIDA in those 10 regions.
The assessment of the modeling and the development of indicators in strengthening SIDA developed in this study is an improvement from the previous study conducted by Kemenristek (2015), as described above. In this study, it focuses more to see the effect of the strengthening of SIDA to the development of GDP. GDP indicator is chosen because it can describe the level of a country’s economy. Some studies mention a close relationship between the economic growth of a country’s GDP and the level of poverty (Suliswanto, 2010). Changes in the value of GDP from one period to another reflects the economic growth that directly or indirectly is a real form of development and successful implementation of policies manual (Husen, 2011).
The purposes of this study, among others, are to a) develop an indicator model on the valid index strengthening of SIDa so it can be used as a reference in the development of the innovation system in the region, b) investigate and quantify the relationship between the strengthening of SIDA with GDP, and c) analyze the effect of the increase in the SIDA index towards the indicators of development of a region. The benefit of this research is the modeling results
are progressive in which the filling and the renewal of the questionnaire can be completed online, and may be revised as quickly without changing the modeling that has been made.
In its descriptions, the SIDa strengthening implementation is related to three main measures, namely the pillar structuring of SIDA, the development of the priority focus, and the implementation of the innovation systems framework. The strengthening of SIDa can be developed by developing and synchronizing policy instruments relating to SIDA properly and thoroughly. The policy instruments include stakeholders, infrastructure conditions, and policy support.
The modeling towards the pillars of SIDa strengthening is done by simplifying the measurement indicator variables by grouping so that there is no overlap of these variables. Measurement indicator variables are quantified by scoring so it can be incorporated into a generic model that indicates the condition of SIDa in every province. The model obtained then was associated with a change in a region, which are the inflow of investments, the increased number of educated people, or the increase of the Owned-Source Revenue (PAD), primarily GDP, in a region.
The results of the modeling in this study is expected to strengthen the existing parameter and make it beneficial for the SIDa strengthening policy implementation applied in the regions, especially in the provincial government. Additionally, the result of this modeling can also be used as an information base for formulating policy recommendations relating to the strengthening of SIDA, so as to encourage harmony between the central and regional policies in maintaining the continuity of the implementation of innovations in the area which in turn will impact on the national innovation system. The results of modeling can also be a reference for solving problems in the implementation of innovations in the area and can be a reference material to weave patterns of the regional development approach that are both systemic and systematic.
II. Method
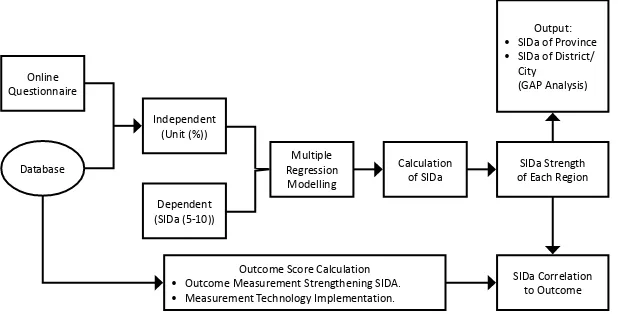
The thinking framework is a conceptual model on how a theory is related to various factors identified as an important component. There, the thinking framework is the most basic understanding and becomes the foundation for every thinking or a form of the process from the whole research conducted (Uma Sekaran in Sugiyono, 2011). The thinking framework in the research of the measuring of SIDa strengthening can be seen in Figure 1.
Joint Regulation of Menristek and Mendagri No. 3 of 2012 and No. 36 of 2012 on the Strengthening of SIDa. The measuring components are described in three pillars of SIDa, namely 1) The Arrangement of SIDa Institutional, 2) The Arrangement of SIDa Network, and 3) The Arrangement of SIDa Resources. The questionnaire is spread online in which it is then filled by the whole provincial government in Indonesia. The data inputs become the main components of the measuring modeling of SIDa strengthening. The description of the components can change depending on the interest of the development of SIDa strengthening nationally (Kemenristek and Kemendagri, 2012).
Some of the modeling features:
1. Have a database related to the policy of innovation system in a region that is more arranged and can be accessed directly by every local government.
2. The developed model can become a benchmark of the measuring method of SIDa index directly in which when the data is filled online by a region, then will be seen the result of SIDa. 3. The developed model can be used to know
directly the variables of SIDa policy in which the performance needs to be intervened and improved.
4. The model can be used to find out the comparison of SIDa index between regions or areas.
5. The SIDa indicators developed can be used to measure the impact of the SIDa index strengthening towards the local development success, in this case, shown by the GDP value of a measured region.
The data processing in this study uses the qualitative data analysis method and the quantitative data analysis. The qualitative data analysis is a form of analysis based on the data stated in the form of description. This qualitative data is the data that can only be measured directly (Hadi, 1984). The
qualitative analysis process is conducted with phases as follows:
1. Editing 2. Coding 3. Scoring 4. Tabulating
The grouping of data upon the answers to every question in one indicator then is calculated to be a total score. The total score resulted by each indicator is converted into a percentage with the formulation:
I=MaximumTotal TotalScore Score×100%
The quantitative data analysis is a form of analysis that uses the numbers and the calculation with a statistical method, then the data must be classified into certain categories by using certain tables to simplify the analysis by using the MINITAB 16 program. The analysis tool used is the multiple regression analysis.
The equation of regression analysis can illustrate a regression line. The close the distance between data and the coordinate placed on the regression line, then the better our prediction is. The distance between the real data with the regression data is squared and totaled, that is why the regression analysis is also known as the Ordinary Least Square Analysis (Winarno, 2007).
The multiple linear regression equation is as follows:
Y’ = a + b1X1 + b2X2 + ⋯ + bnXn
Remarks:
Y’ = Dependent Variable (predicted value)
X1 and X2 = Independent Variable
Online Questionnaire
Database
Independent (Unit (%))
Dependent (SIDa (5-10))
Multiple Regression
Modelling
Calculation of SIDa
SIDa Strength of Each Region
SIDa Correlation to Outcome
Output: • SIDa of Province • SIDa of District/
City (GAP Analysis)
Outcome Score Calculation • Outcome Measurement Strengthening SIDA. • Measurement Technology Implementation.
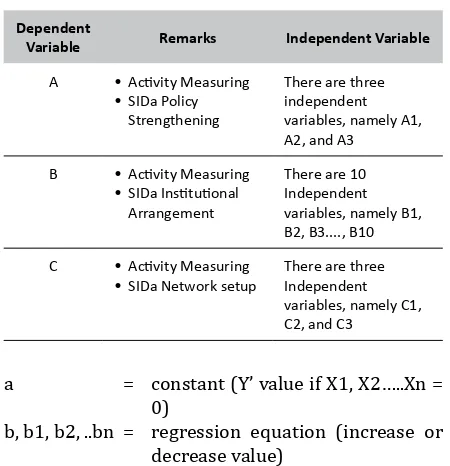
a = constant (Y’ value if X1, X2…..Xn = 0)
b, b1, b2, ..bn = regression equation (increase or decrease value)
In this study, there are three dependent variables measured in regression analysis. The dependent variables of SIDa measuring are the strengthening of SIDa policy (Variable A), the arrangement of SIDa institutional (Variable B), and the arrangement of SIDa network (Variable C), as described in Table 1.
1) The Measuring of SIDa Policy Strengthening Activity (A)
The Measuring of SIDa Policy Strengthening Activity result has the regression equation of:
A = β0 + β1Α1 + β2Α2 + β3Α3 + ei
Independent Variable
The formation of a Coordination Team for the Strengthening of SIDa and its apparatus (A1)
SIDa Strengthening Roadmap (A2)
Synchronization, harmonization, and synergy of policy related to SIDa Strengthening (A3)
2) The Measuring of SIDa Institutional Arrangement (B)
The Measuring of SIDa Institutional Arrangement Activity result has the regression equation of:
B = β0 + β1B1 + β2B2 + β3B3 + β4B4 +
β5B5 + β6B6 + β7B7 + β8B8 + β9B9 +
β10B10 + ei
Independent Variable
Government Institution Arrangement (B1)
Synergize the program and the activity into the governmental environment with SIDa strengthening (B2)
Local government Arrangement (B3)
RND Institution Arrangement (B4)
Education Institution Arrangement (B5)
Supporting Institution Arrangement (B6)
Business Sector Arrangement (B7)
Empower social organization and synergize it with SIDa strengthening (B8)
Arrangement towards new regulations, change the regulation and repeal the inappropriate regulation related to SIDa (B9)
Development of professionalism and internalization of social values for SIDa strengthening (B10)
3) The Measuring of SIDa Network setup (C) The Measuring of SIDa Network setup Activity result has the regression equation of:
C = β0 + β1C1 + β2C2 + β3C3 + ei
Independent Variable
Develop intensive communication between SIDa institutions (C1)
Human Resource mobilization (C2)
Optimization of the Utilization of Intellectual Property Rights (IPRS), information, as well as facility and infrastructure of science and technology through its utilization (C3)
4) The Impact of SIDa Strengthening Pillars Model Towards Development Indicator (GDP)
The development of GDP becomes one of the indicators on the existence of the community economic growth. Although the development of GDP does not simultaneously happen because of SIDa strengthening, but the synergy and the consistency of SIDa policy implementation among stakeholders (government institutions, academics, business sector, and community) become the important key in creating, encouraging, and developing the GDP in the region.
The Equation Model on the Impact of SIDa towards GDP is as follows:
• PDB = b0 + b1 SIDa (A)
• PDB = b0 + b1 SIDa (B)
• PDB = b0 + b1 SIDa (C)
• PDB = b0 + b1 SIDa (D)
Table 1.SIDa Measuring Variables
Dependent
Variable Remarks Independent Variable
A • Activity Measuring • SIDa Policy
Strengthening
There are three independent variables, namely A1, A2, and A3
B • Activity Measuring • SIDa Institutional
Arrangement
There are 10 Independent variables, namely B1, B2, B3...., B10
C • Activity Measuring • SIDa Network setup
III. Result and Discussion
A. The Prediction Result of SIDa Strengthening Indicator Regression Model
The prediction result of a regression model of each SIDa strengthening indicator is obtained based on the historical data in 2014, which consists of the value score of 5-10 (look up Kemenristekdikti and Kemendagri, 2014). The prediction of regression model could result in the examination that measures the impact of each variable of SIDa strengthening measuring. In addition to result the significance examination, the prediction model results in a regression equation value as the weight for each independent variable. The weight obtained from the regression modeling illustrates the amount of impact towards SIDa strengthening indicator, which is grouped into three SIDa strengthening indicators, namely SIDa (A), SIDa (B), and SIDa (C). The explanation of the prediction result of regression model of each SIDa strengthening indicator is described as follows:
1) Regression Result of SIDa Policy Strengthening Activity Measuring (A)
The measuring result of SIDa policy strengthening activity has a regression equation of:
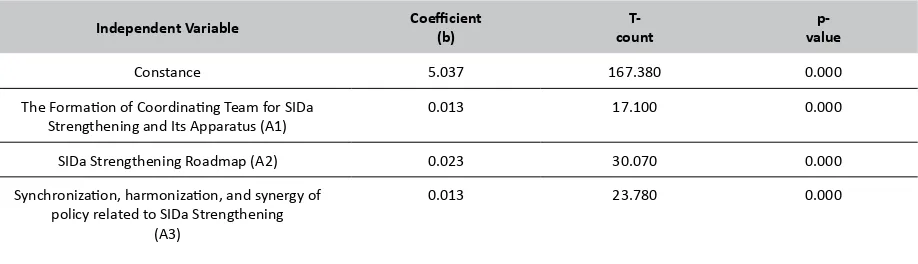
A = 5.04 + 0.0131 A1 + 0.0233 A2 + 0.0126 A3
Table 2 shows that the measuring indicator of SIDa policy strengthening activity measuring is affected by the independent variable of the formation of a coordinating team for SIDa strengthening and its apparatus, SIDa strengthening roadmap, as well as policy synchronization, harmonization, and synergy related to the strengthening of SIDa. It can be seen from p-value < 0.01, which means that the independent variable significantly affects the measuring of SIDa policy strengthening activity at the real level of 1%.
From the measuring result as stated in the above table, seen (b) equation which is the weight for each independent variable towards SIDa strengthening index. The bigger the (b) equation means the more important or the stronger the impact of the independent variable. The equation value of the formation of the coordinating team for SIDa strengthening and its apparatus i.e. amounted to 0,012, the SIDa strengthening roadmap has the equation value of 0,023, while the synchronization, harmonization, and synergy of policy related to SIDa strengthening amount to 0,013. From these three independent variables, the SIDa strengthening roadmap variable has the biggest equation. Therefore, the SIDa strengthening roadmap has the biggest influence towards SIDa policy strengthening.
The SIDa roadmap variable shows an important role in the context of its relation to GDP because it will be the focus on the stipulation of the community economic activity. As known that the phase of goal stipulation from SIDa strengthening roadmap variable through a long process started from:
SIDa roadmap variable shows a very important role in the context of its relation to GDP because it will be the focus of the community economy activity stipulation. As known that the phase of goals stipulation from SIDa strengthening roadmap variable through a long process initiated from: (1) the preparation and the organization of the process of the roadmap organization which is illustrated from the working agenda availability of roadmap organizer team; (2) the stipulation of priority theme measured from the sequence of priority theme validated by the authorized party, and (3) the existence of inventory of the current local innovation system condition and the challenge as well as the opportunity characterized from the existence of a holistic analysis result. In addition, the composing of SIDa strengthening roadmap is needed to be stipulated in the form of activity focus, action plan, and the relation between roadmap with RPJMS so that the activities related to the local innovation can be implemented periodically and sustainably. Table 2.
The t-test of Independent Variable Impact towards SIDa Policy Strengthening Activity Measuring Indicator
Independent Variable Coefficient (b)
T-count
p-value
Constance 5.037 167.380 0.000
The Formation of Coordinating Team for SIDa Strengthening and Its Apparatus (A1)
0.013 17.100 0.000
SIDa Strengthening Roadmap (A2) 0.023 30.070 0.000
Synchronization, harmonization, and synergy of policy related to SIDa Strengthening
(A3)
Meanwhile, the regression (b) coefficient value between two other variables, namely the formation of coordinating team of SIDa strengthening and its apparatus as well as the independent variables of synchronization, harmonization, and synergy of policy related to SIDa strengthening in which the value is almost the same (0.0131 and 0.0126) shows the logical relation that for the implementation of SIDa strengthening, needed a roadmap with a clear working focus supported by the existence of a solid coordinating team and the synchronization, harmonization, and synergy between various policies related to the innovation system in the region.
From this equation, can be seen that the GDP can be increased by composing local development roadmap based on the innovation approach, which involves the pillars of academic, business sector, and local government. This strategy must be conducted through an effective coordination so it can be beneficial for strengthening each function owned by those three pillars, and it is reflected in the formal document in the form of policy harmonization and synergy.
The indication also shows that if one day will be conducted a perfecting in the stipulation of independent variable in the arrangement of policy, then the independent variable of SIDa strengthening roadmap needs to be given a serious attention, for example by elaborating the independent variable of SIDa strengthening roadmap into various independent sub-variables and reducing the
arrangement focus in the other two variables.
2) The Regression Result of SIDa Institutional Arrangement Activity (B)
The measuring result of SIDa institutional arrangement activity has the regression equation of:
B = 5.00 + 0.00418 B1 + 0.00357 B2 + 0.00260 B3 + 0.00396 B4 + 0.00435B5 + 0.0143 B6 + 0.00397 B7 + 0.00545 B8 + 0.00356 B9 + 0.00353 B10
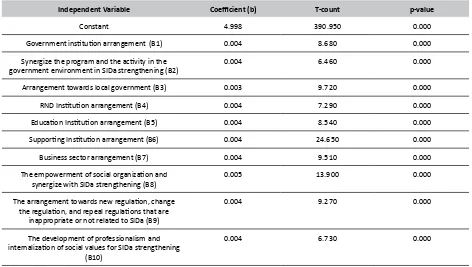
Table 3 shows that the measuring indicator of SIDa institutional arrangement activity influenced by all independent variables of government institution arrangement, synergize the program and the activity in the government environment in SIDa strengthening, the arrangement of local government, the arrangement of RND institutions, the arrangement of education institutions, the arrangement of supporting institutions, the arrangement of business sector, the empowerment of social organization, and synergize by SIDa strengthening, the arrangement towards new regulation, change the regulation, and repeal regulations that are inappropriate or not related to SIDa, and the development of professionalism and internalization of social values for SIDa strengthening. All those indicators can be seen from p-value < 0.01, which means the independent variable significantly influence the measuring of SIDa institutional arrangement activity at the real Table 3.
The t-test result on the Influence of Independent Variable Towards the Measuring Indicator of SIDa Institutional Arrangement Activity
Independent Variable Coefficient (b) T-count p-value
Constant 4.998 390.950 0.000
Government institution arrangement (B1) 0.004 8.680 0.000
Synergize the program and the activity in the
government environment in SIDa strengthening (B2) 0.004 6.460 0.000
Arrangement towards local government (B3) 0.003 9.720 0.000
RND Institution arrangement (B4) 0.004 7.290 0.000
Education Institution arrangement (B5) 0.004 8.540 0.000
Supporting Institution arrangement (B6) 0.004 24.650 0.000
Business sector arrangement (B7) 0.004 9.510 0.000
The empowerment of social organization and synergize with SIDa strengthening (B8)
0.005 13.900 0.000
The arrangement towards new regulation, change the regulation, and repeal regulations that are
inappropriate or not related to SIDa (B9)
0.004 9.270 0.000
The development of professionalism and internalization of social values for SIDa strengthening
(B10)
level of 1%.
The regression result based on the table above, the equation (b) is a weight for each independent variable towards SIDa index, the bigger the coefficient (b) means the more important or the stronger the influence of independent variable. From the ten independent variables that influence the activity of SIDa institutional arrangement, the variable of supporting institution arrangement has a big coefficient value from the other independent variable amounted to 0,014 which means it has a more important influence than the others. The equation value of other independent variables that has almost similar value, which is around 0,003 to 0,005. All independent variables in the arrangement SIDa institutional have a positive equation which means the increase in the independent variable percentage that will always increase SIDa index of a province or a regency/city.
From the measurement result above, it shows that the coefficient (b) on the independent parameter B6, which is an arrangement of supporting institutions, is the biggest among other independent variables. The independent variable of supporting institutions (B6) which are included in it is the institutions that can support the strengthening of regional innovation system (e.g. banking sector, professional organizations, etc.). These institutions vary greatly, depending on the type of activities as arranged in the roadmap (A2) arranged. This indicates that in building and strengthening a regional innovation system, required the involvement of various institutions, in which the institution has a role which may vary from one region to the other and the difference is largely determined by the types of commodities developed. The appropriate determination of supporting institutions becomes a priority in re-arrange the independent variables to enhance the determination of various indicators of SIDa strengthening in the future.
In addition, the independent variable of B8
is empowering social organizations and build a synergy between social organizations and the SIDa strengthening program will be quite important, meaning that if the SIDa strengthening program is conducted, the participation and the involvement of social organizations have become the important factor to be considered.
Another thing to consider is the coefficient (b) of the independent variable B5, namely the independent variable of educational institutions arrangement. The high value of the coefficient B5 which is positioned on the third highest after the arrangement of supporting institutions and social organization variable, gives an indication that the readiness of professional labor in strengthening SIDa becomes a factor to be considered in the future, either through special programs such as training programs, internship programs, as well as through the arrangement of the curriculum at educational and training institutions.
3) The Regression Result on SIDA Network (C) Setup Measurement Activity
The result of activity measurement of SIDa network setup has a regression equation of:
C = 5.03 + 0.0373 C1 + 0.00609 C2 + 0.00920 C3
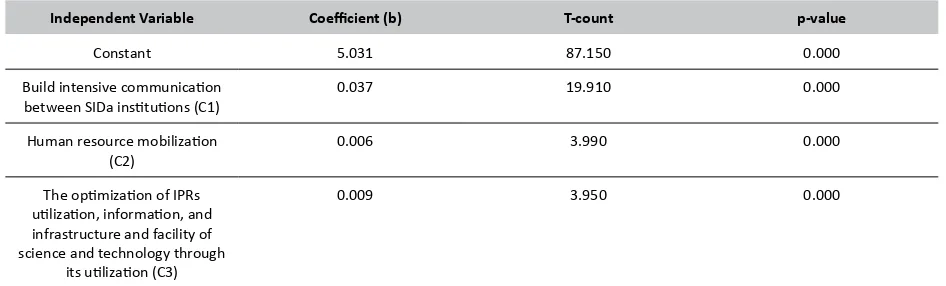
Table 4 shows that the indicators of SIDa network setup activity measurement are influenced by independent variable of establishing intensive communication between SIDa institutions, the mobilization of human resources, and the optimization of the utilization of Intellectual Property Rights (IPRs), information, and infrastructure and facility of science and technology through its utilization. It can be seen from the p-value <0:01, meaning that the independent variable significantly influences the activity measurement of SIDa network setup on the real level of 1%.
From the regression result based on the above table, the coefficient (b) is the weight for Table 4.
The t-test result of the Independent Variable Effect on the Measurement Indicators of SIDa Network Setup
Independent Variable Coefficient (b) T-count p-value
Constant 5.031 87.150 0.000
Build intensive communication
between SIDa institutions (C1) 0.037 19.910 0.000
Human resource mobilization (C2)
0.006 3.990 0.000
The optimization of IPRs utilization, information, and infrastructure and facility of science and technology through
its utilization (C3)
each independent variable to the SIDa index. The coefficient of the independent variable established an intensive communication between SIDa institutions in the amount of 0.037, the mobilization of human resource has a coefficient of 0.006, and the optimization of the utilization of IPRs, information, and infrastructure and facility of science and technology through its utilization has a coefficient value of 0.009. The bigger the coefficient (b) means the more important or stronger the influence of the independent variables. Thus, the measurement indicators of SIDa network setup activity, the variable that contributes the most is to establish an intensive communication between the SIDA institutions. All independent variables have a positive coefficient which means an increase in the percentage of independent variables in the SIDa network setup will influence in increasing the SIDa index of a province or a regency/city.
B. The Simulation of SIDa Strengthening Index Calculation
As explained previously, the filling of information on the innovation System Implementation in the region is done BY doing the Data Filling of Operated questionnaire online filled
in by all provincial governments. The calculation simulation of the SIDa index Strengthening ON the provincial level is conducted in several Phases as follows:
1. After all the provinces fill out the questionnaire, then all the data will be directly entered into the database.
2. The system will automatically calculate the percentage value of each SIDa measurement variable.
3. With the data of each variable, it will be directly calculated with the results of the regression equation. So automatically, each province will issue SIDa value.
4. The calculation of SIDa value for each province will be correlated with the GDP outcome. Here is an illustration of the result of the correlation between the SIDa value and the GDP outcome.
C. The Impact of SIDa Strengthening Index towards GDP
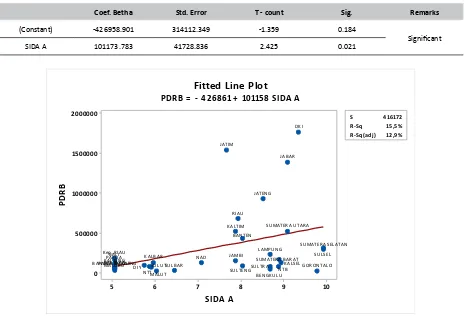
According to Statistical Agency (BPS), the definition of GDP basically is a total of value added resulted by the whole business unit in a certain country, or is the final total value of goods and services resulted by all economy units. GDO upon Table 5.
Table of SIDa A Regression Result towards GDP
Coef. Betha Std. Error T - count Sig. Remarks
(Constant) -426958.901 314112.349 -1.359 0.184
Significant SIDA A 101173.783 41728.836 2.425 0.021
10 9
8 7
6 5
2000000
1500000
1000000
500000
0
S 4 16 172 R- Sq 15 ,5 %
R- Sq(adj) 12 ,9 %
S IDA A
P
D
R
B
SU MATERA U TARA
SU MATERA SELATAN
SU MATERA BARAT SU LU T SU LTRA
SU LTEN G
SU LSEL SU LBAR
RIAU
PAPU A BARAT PAPU A
N TT N TB
N AD
MALU T MALU K U
LAMPU N G K ep . RIAU
K ALTIM
K ALTEN G
K ALTARA K ALSEL
K ALBAR
JATIM
JATEN G
JAMBI
JABAR
GORON TALO D K I
D IY
BEN GK U LU BAN TEN
BAN GK A BELITU N G BALI
Fitted Line Plot
PDRB = - 426861 + 101158 S IDA A
the valid basic price illustrates the value added of goods and services calculated using the prevailing price each year, while GDP upon the constant price base shows the added value of goods and services calculated using the prevailing process of a certain year as a base. GDP upon the prevailing basic price can be used to see the economic shifting and structure, while the constant price is used to find out the economic growth from year to year. GDP has four components, namely household consumption, investment, government consumption, and net export.
If consumption is added, then it will influence the GDP that will also increase. Similar with investment, if there is an increase in government expenditure and net export, then the number of GDP will increase. This is because the components are in one linear function. Therefore, each country always tries to increase consumption, investment, government expenditure, and net export value (www.artikelsiana.com).
Generally, GDP can be made into the measurement of the economic welfare of a country, but this measurement is not really right because it still neglects the total population factor. This study has a purpose to see the impact of SIDa
strengthening impact towards GDP. The impact of SIDa strengthening index towards the outcome of GDP theoretically not yet showing that the SIDa strengthening index has a positive and significant impact on GDP. This study proves that there is a positive relation between SIDa Strengthening index towards GDP in 33 provinces.
1) Analysis of SIDa (A) Regression towards PDB The processing result of SIDa (A) index impact regression towards GDP can be seen in Table 5.
Figure 2 shows the linearity graph of the impact of SIDa (A) towards GDP.
From Figure 2, can be concluded that there is a significant impact between the index of SIDa policy strengthening towards GDP. From the regression result of probability (prob) value with the value of 0,021 smaller than alpha 5%. Therefore, it has a significant impact, in which the regression equation has a positive value means SIDa policy strengthening will give an impact in the increase of GDP.
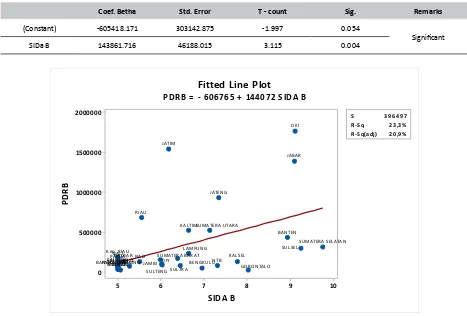
2) Analysis if SIDa (B) Regression towards GDP The processing result of SIDa (B) index impact regression towards GDP is explained in Table 6.
Figure 3 shows the linearity graph of SIDa B Table 6.
Table of SIDa B Regression Result towards GDP
Coef. Betha Std. Error T - count Sig. Remarks
(Constant) -605418.171 303142.875 -1.997 0.054
Significant
SIDa B 143861.716 46188.015 3.115 0.004
10 9
8 7
6 5
2000000
1500000
1000000
500000
0
S 3 9 6 4 9 7 R- Sq 2 3 ,3 %
R- Sq(adj) 2 0 ,9 %
S IDA B
P
D
R
B
SU MATERA U TARA
SU MATERA SELATAN
SU MATERA BARAT SU LU T
SU LTRA SU LTEN G
SU LSEL
SU LBAR RIAU
PAPU A BARAT PAPU A
N TTN AD N TB MALU T
MALU K U
LAMPU N G K ep . RIAU
K ALTIM
K ALTEN G K ALTARA
K ALSEL K ALBAR
JATIM
JATEN G
JAMBI
JABAR
GORON TALO D K I
D IY BEN GK U LU
BAN TEN
BAN GK A BELITU N G BALI
Fitted Line Plot
PDRB = - 606765 + 144072 S IDA B
impact towards GDP.
From Figure 3 can be concluded that there is a significant impact between SIDa institutional arrangement index towards GDP. From the regression result of the prob, value has a value of 0,004 smaller than alpha 5%. Therefore, it means that SIDa institutional arrangement has a significant impact. The equation has a positive value which means that each policy step in the arrangement of SIDa institution will increase the GDP.
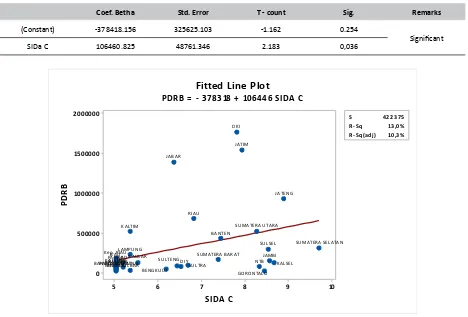
3) Regression Analysis of SIDa (C) towards GDP The regression processing result of SIDa index impact (C) towards GDP is explained in Table 7.
Figure 4 shows a linearity graph of SIDa C impact towards GDP.
Based on the dynamics showed in Figure 4, can be concluded that there is a significant impact between SIDa strengthening index towards GDP. From the regression result of prob value (0,036) smaller than alpha 5%, which means a significant impact. The positive coefficient means the improvement of SIDa will increase the GDP.
From the correlation, seen that the C1 independent variable, that to build a communication between SIDa implementer institution, has the
biggest equation value (b). This indicated that in the pillar of network setup, the communication between SIDa institution becomes more important. The development of communication is fulfilled from the existence of research and development forums in the regions, the existence of various discussion groups like the seminar, workshop, FGD, etc. as well as the implementation of RND cooperation between institutions, both government, and private RND institutions. The form of communication is very important to be encouraged in order for the GDP increase in the future. In addition, the mobilization of human resources in order for the technology transfer process and the optimization of IPRS utilization becomes important.
IV. Conclusion
In this study, conducted an analysis of the measuring indicators of SIDa components that directly influence the indicators of the success of the region. The SIDa strengthening implementation is related to three main measures, which are the pillars structuring of SIDA, the development of priority focus, and the implementation of the innovation system framework. The modeling of the pillars on the strengthening of SIDA is done by Table 7.
Table of SIDa C Regression Result towards GDP
Coef. Betha Std. Error T - count Sig. Remarks
(Constant) -378418.156 325625.103 -1.162 0.254
Significant SIDa C 106460.825 48761.346 2.183 0,036
10 9
8 7
6 5
2000000
1500000
1000000
500000
0
S 4 2 2 3 75 R- Sq 13 ,0 %
R- Sq(adj) 10 ,3 %
S IDA C
P
D
R
B
SU MATERA U TARA
SU MATERA SELATAN
SU MATERA BARAT SU LU T
SU LTRA SU LTEN G
SU LSEL
SU LBAR
RIAU
PAPU A BARAT PAPU A
N TT N TB
N AD MALU T MALU K U
LAMPU N G K ep . RIAU
K ALTIM
K ALTEN G
K ALTARA K ALSEL
K ALBAR
JATIM
JATEN G
JAMBI JABAR
GORO N TALO D K I
D IY BEN GK U LU
BAN TEN
BAN GK A BELITU N G BALI
Fitted Line Plot
PDRB = - 378318 + 106446 S IDA C
simplifying the measurement indicator variables grouped in a way so that there is no overlap of these variables. The multiple regression analysis showed all independent variables are impacting significantly and positively on the index of SIDA. The result of Regression Model Prediction of the Strengthening Indicators of SIDA (A) indicates the importance of drafting a roadmap of regional development based on innovation approach, namely to involve the pillars of academics, business and local government, which is done through an effective coordination so as to be useful to mutually reinforce each functions held by the three pillars of SIDA. The Regression Result of Measurement Activity Arrangements of SIDA (B), indicating that in building and strengthening a regional innovation system required the involvement of various institutions, in which the institutions have a role which may vary from one region to another. The determination of appropriate supporting institutions is very helpful in refining the determination of various indicators in the strengthening of SIDA in the future. While Regression Results of Measurement Activity Network Setup of SIDA (C), indicates the importance of network setup of SIDA in establishing intensive communication between SIDA institutions. All independent variables in this study have a positive equation, which means an increase in the percentage of independent variables will increase the index of SIDa in a province or regency/city. The study results showed that the index of the strengthening of SIDA impacts positively and significantly on GDP in all measured provinces and showed a positive linear line. This indicates that the increase in the SIDA index is able to increase the value of GDP as an outcome indicator of the development in a region.
The result of this study can serve as a reference for the policy implementation of the innovation system that connects directly between the central government and local governments in coordinating the development of the innovation system, making it easier for the government in mapping the region with the innovation system owned. Some recommendations from the results of this study include the need to: a) Increase the new input data sourced from regencies/cities as the direct implications of the model that has been created, b) The model created is a valid model with the good indicators of a model that has been fulfilled, so it can be used to represent the weight of each indicator of the strengthening of SIDA, and c) enhance the study by reducing the measuring variables of regional innovation policies (SIDA), with the involvement of all competent parties in drafting the legislation in the area of the innovation system. By revising the measuring variables of SIDA, it is expected that the resulted model can explain the influence of significant and positive policy factors significant and
positive towards the success indicators of a region.
Acknowledgement
The author would like to express his gratitude to the Directorate General of Innovation Enforcement of the Ministry of Research, Technology, and Higher Education (Kemenristekdikti) for the provision of the fund in the Fiscal Year of 2015 so that the execution of this study can be conducted well.
V. References
Arsyad, L. (1999). Ekonomi Pembangunan. Yogyakarta: STIE YKPN.
Badan Pengkajian dan Penerapan Teknologi. (2011). Buku Putih Penguatan Sistem Inovasi Nasional: Naskah Akademik. Jakarta: Deputi Bidang Pengkajian Kebijakan Teknologi-Badan Pengkajian dan Penerapan Teknologi.
Hadi, S. (1984). Bimbingan Menulis Skripsi Thesis. Yogyakarta: Yayasan Penerbitan Fakultas Psikologi UGM.
Handayani, W., Sophianingrum, M., & Nutriandini, U. (2013). Kajian Roadmap Pengembangan Sistem Inovasi Daerah (SIDa) Kota Semarang. Riptek, 7(2), 97–108. Retrieved from http:// bappeda.semarangkota.go.id/kategori/2/ jurnal-riptek-bulan-november-2013
Husen, S. (2011). Pengaruh Pengeluaran Agregat dalam Mendorong Pertumbuhan Produk Domestik Bruto dan Implikasinya pada Kesejahteraan Sosial. Jurnal Ekonomi Pembangunan, 12(1), 130–158.
Ismiatun. (2015). Pengembangan Sistem Inovasi dalam Perspektif Peningkatan Daya Saing Daerah dengan Pendekatan System Dynamics. JISIP: Jurnal Ilmu Sosial Dan Ilmu Politik, 4(2), 253–261. Retrieved from www.publikasi. unitri.ac.id
Kemenristekdikti, & PPTTG-LIPI. (2015). Pengembangan Klaster Inovasi dalam Rangka Penguatan Sistem Inovasi Daerah (SIDa) di 10 Kabupaten/Kota. Jakarta: Direktorat Sistem Inovasi-Kemenristekdikti.
Minister of Research and Technology, & Minister of Home Affairs. Joint Regulation of the Minister of Research and Technology with the Minister of Home Affairs No 3 of 2012 and No 36 of 2012 on the Strengthening of the Regional Innovation System (SIDa), Pub. L. No. 3 & 36 (2012).
Ministry of Research and Technology. (2014). Panduan Penguatan SIDa. Jakarta: Ministry of Research and Technology.
Nelson, R. R. (Ed.). (1993). National Innovation Systems: A Comparative Analysis. New York: Oxford University Press. Retrieved from http:// site.ebrary.com/id/10087205
Ruswandi, A. (2013). Kajian Penguatan Sistem Inovasi Daerah Jawa Barat. Jurnal Bina Praja, 5(1), 27–34. http://doi.org/10.21787/ jbp.5.2013.27-34
Sugiyono. (2011). Metode Penelitian Kuantitatif, Kualitatif, dan R&D. Jakarta: Alfabeta.
Suliswanto, M. S. W. (2010). Pengaruh Produk Domestik Bruto (PDB) dan Indeks Pembangunan Manusia (IPM) terhadap Angka Kemiskinan di Indonesia. Jurnal Ekonomi
Pembangunan, 8(2), 357–366. Retrieved from http://ejournal.umm.ac.id/index.php/jep/ article/view/3610
Taufik, T. A. (2005). Pengembangan Sistem Inovasi Daerah: Perspektif Kebijakan. Jakarta: Pusat Pengkajian Kebijakan Teknologi Pengembangan Unggulan Daerah dan Peningkatan Kapasitas Masyarakat, Deputi Bidang Pengkajian Kebijakan Teknologi, Badan Pengkajian dan Penerapan Teknologi bekerjasama dengan Deputi Bidang Pengembangan Sipteknas, Kemente.