Well-being Evaluation with Capability Approach
R Widodo D Pramono (Department of Achitecture and Planning, Gadjah Mada University, Yogyakarta, Indonesia)
Prof. Johan Woltjer (Faculty of Spatial Science, Groningen University, the Netherland)
Introduction
Development as intended action must be evaluable in order to be accountable. For planning, evaluation and measurement of success, therefore, has been an important concern during the last decades (Patton 1978, Issac & Michael 1981, Rossi 1989, Khakee et al 2008, Hull et al 2011, Pinho 2010). The general idea has been that without
evaluation, there is no way to distinguish the worthwhile from the worthless (Schmidt 1978), and to express adequately levels of quality or success. Evaluation not only refers to practical skills, but also needs theoretical thinking in order to understand notions like development, well-being and context (Sanders, 2001).
The evaluation of well-being1 and quality of life of communities has been an emerging issue in regional development planning practice. Nevertheless, a framework for
expressing and operationalizing issues of well-being within this field, in an adequate and coherent way, is still lacking. This deficiency is mainly caused by the absence of a set of indicators which are contextual to social, cultural, as well as political circumstances, and specific to the situation planned for.
Nevertheless, although academic in nature, evaluation also has to be implementable to support practices in public policy formulation and development intervention. To meet this requirement, an evaluation framework will have to be contextual and specific to the issues characteristic of development planning, like land use management, accessibility, water supply, or public services. The context of any evaluation effort will include local problems, institutions, current aspirations, and potentials.
This paper sets out to operationalize an evaluation framework for development planning based on well-being and quality of life, thereby employing Indonesia and more
specifically the Magelan Regency in Java‟s Central Province as a context for research.
Regional Development Planning Issues
Currently, there are a variety of countrywide indicators available for expressing development attributes, including Gross Domestic Product (GDP), indices on income growth and the Human Development Index (HDI). As these indicators pertain to nationwide statistics, they are limited in their usefulness to actually describe well-being and quality of life at the regional scale (Nussbaum and Sen, 1993). For the case of Indonesian regional development for instance, the increase in GDP or GDP per capita has not always been in line with people„s general feelings on the improvement of their quality of life. An example at hand is the so-called Farmer Household Survey conducted by the
Indonesian Central Bureau of Statistics in 2003. It showed that people still felt their living situation to be unsatisfactory, while, at the same time, national and regional GDP showed significant progress, also in terms of local productivity and production volume (see chapter 3).
So, the growth of regional and national GDP does not always concur with a similar growth in well-being of the population. An evaluation study by Breman & Wiradi (2004) in Indonesia showed that although the regional GDP per capita had improved, a systematic decrease of rural prosperity could be detected. Also rural-urban disparities increased (Baswir, 2003), while agricultural and rural economic conditions were unstable (e.g. Noertjahyo, 2005).
There are several reasons why GDP is not sufficient to evaluate quality of life. First, GDP is measured at the national scale, which automatically precludes indications of the distribution of well-being over a group or an area. The second reason is that certain levels of GDP, or income per capita, will be evaluated and perceived differently by different people. The third reason is that GDP includes only material and measurable aspects, thereby ignoring important non-material, or wider aspects of quality of life.
The “Capability Approach” (CA), introduced in 2000 by Amartya Kumar Sen in
his book Development as Freedom (2000) presents a new approach to the evaluation of well-being in a development setting. The central focus in CA is the notion of „levels of
freedom to choose‟. Sen defines capability as the level of freedom available to a person to
choose between various valuable “functionings2” (states of being and doing). A large number of freely available options imply a higher level of „capabilities‟, where the level
of „capabilities‟ is an equivalent of the level of „freedom of choice‟.
Compared to GDP, the merits of the capability approach (CA) are: 1) it allows for a variety of personal preferences and is locally contextual; 2) it considers reciprocal relationships between individuals‟ interests; 3) it evaluates material and non-material well-being at the same time. Based on these characteristics of CA it is expected that – given a proper evaluation framework- planners will be able to evaluate regional development in relation to regional development aspirations. CA provides insight in factors of relevance to regional development and at the same time how to us these factors to the benefit of the region. The capability concept has been widely recognized as a useful evaluative concept for development achievement. However, operationalization is still problematic. The main difficulty in the CA concept is the fact that preferences of individuals are idiosyncratic due to personal, spatial, and temporal differences in situation.
A well-known effort to operationalize „capability‟ was proposed in 1990, in the Human Development Report (HDR) by the United Nations Development Program (UNDP). It served to replace previous income indicators. Sen‟s concept on human
development was used, defined as “a process of enlarging people‟s choice”; The concept
–better known as the Human Development Index (HDI)- was developed into a set of
2
This term is perhaps unusual in English. However, it will be used throughout this paper, as it concurs with
the terminology introduced and explained by Amartya Sen in his book “Development as Freedom (2000).
indicators to quantify the increase of an individual‟s freedom of choice. The HDI was considered – as indicators such as life expectancy, adult literacy and real per capita gross national product (GNP) were included, to represent the whole concept of „capability‟. Nevertheless, according to Kaley (1991), HDI is a linear concept portraying only the latest well-being/capacity, while excluding any evidence about when and to what extent human development has occurred, as well as the factors influencing them. The HDI does not explain how the development process should continue. Kaley (1991) argues that this observation ignores the phenomenon of production-transformation interplay among indicators. The HDI has been applied predominantly at a national level, also to compare the different levels of development between nations.
Another effort relevant to „capability‟ is an approach presented by Robert Ericson (1993). It a survey method for measuring levels of quality of life, and was applied in a study of Swedish households. The basic principle within the approach is the use of several indicators such as health and access to health, employment and working conditions, economic resources, education and skills, family and integration, housing, security of life and property, recreation and culture, and political resources such as membership of parties and voting participation. The introduction of these multiple indicators may satisfy one of Kaley‟s requirements to adequately evaluate the phenomenon of production-transformation interplay among indicators. Nevertheless, because the indicators are evaluated using quantitative-standardized parameters, such as the ability to walk 100 meters or the ability to cover unforeseen expenses of up to $ 1,000 within a week, it contradicts the relative and contextual characteristics of „capability‟, which are idiosyncratic by nature. Therefore, Ericson‟s approach cannot accommodate individual preferences and aspirations. It is in fact only an expanded version of the use of the per capita GDP indicator.
A similar approach to Ericson‟s index is Mercer Quality of Living Survey 2010. Mercer‟s survey covers urban environment components as indicators of quality of life, thereby adding non-physical indicators such as relations with other countries, internal stability, crime, law enforcement, and ease of entry and exit. The analysis is essentially the same as Ericson‟s. Both assume absolute-quantitative analyses to value the indicators investigated.
Other evaluation methods have included perceptual data. Illustrative examples of these methods are, for instance, the Happy Planet Index (HPI) and the World Values Survey. HPI (Nef centre, 2006) measures how efficient countries are in achieving certain levels of happiness. This index includes a perceptual survey on satisfaction, combined with life expectancy, lessened by the ecological footprint as a general standard of natural resource consumption. It is more or less similar to sustainable development measurement,
but incorporates people‟s perception of their level of satisfaction. The World Values
As a response to the aforementioned limitations of available indicators, this paper aims to develop an alternative framework to evaluate a community‟s quality of life, specifically for the practice of regional development planning. A framework that is
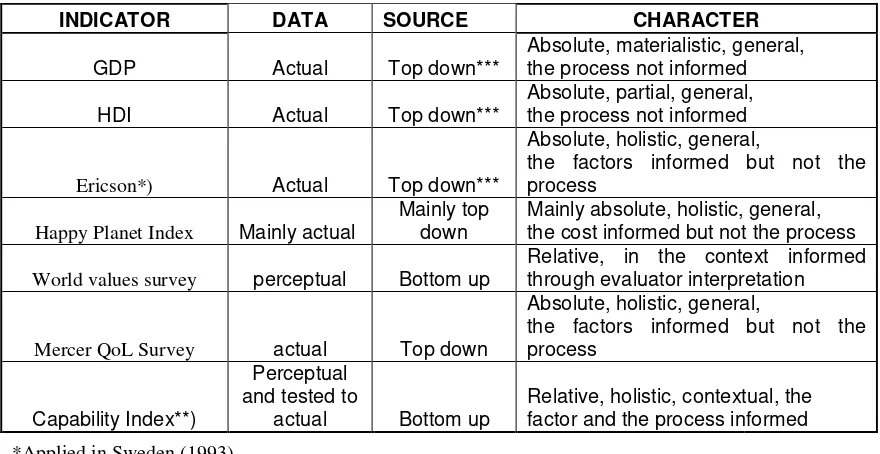
contextual to a region‟s characteristics and its actual issues. The paper will take the merits of the capability approach as a theoretical base by giving due respect to individual aspirations. It will be holistic in nature (including physical and social aspects of well-being), relative and contextual, thereby taking into account the spatial, social, and political circumstances of a place. A so-called „Capability Index‟ (CI) will be introduced to determine capability levels (level of freedom to choose) and their increase within a certain period of time. Table 1.1. shows a review on a series of common indicators to evaluate well-being.
Table 1.1. Indicators for the evaluation of well-being
Contextual characteristics are the key of the framework. To be contextual, the formula that construct the Capability Index is designed to represent a variety of inputs and outcomes, which exist in the economic production in a community, and circumstances that influence the development process. These inputs and outcomes are
called “assets”, defined either as material (money, goods, and infrastructure with which a person has property right or access rights to get benefits), or non-material (health, knowledge, skill/abilities, relationship, organization, social environment, political
condition, which may influence a person‟s access to particular assets). The benefits of having assets are in their opportunities for economic consumption and production. The research documented in this paper asks which assets are consumption and production input, or act as catalysts in the development process.
INDICATOR DATA SOURCE CHARACTER
GDP Actual Top down***
Happy Planet Index Mainly actual
Mainly top down
Mainly absolute, holistic, general, the cost informed but not the process
World values survey perceptual Bottom up
Relative, in the context informed through evaluator interpretation
Mercer QoL Survey actual Top down
Absolute, holistic, general,
Action research with a specific region as case was used to explore the kind of assets that determine capability. The study, therefore, combines action research and case study to evaluate development. The case study area selected stands for dynamic economic
consumption, production and transformation, with a variety of local community‟s as well
as government‟s development innovations. It also displays strong linkages to external and
contextual circumstances. Action research makes it possible to involve as much as possible local people observation and perception on the development
their quality of life and the context. Based on other previous authors (such as
Kemmis and McTaggar 1998; Andersen, Herr and Nihlen 1994; and Reason 1994), Stringer (1996) resumes that fundamental investment of process of action research are rigorously empirical and reflective (or interpretative). It engages people who have
traditionally been called “subject” as active participants in research process, and it result
in some practical outcome related to the lives or work of participant. This method can
potentially enrich concept/theories to be proposed applied in community
planning practices as it has promote both practical and theoretical outcome (Stringer 1996).
Community’s self
-evaluation on well-being: Indonesian Case Study
The study area selected in Indonesia is relatively complex in terms of situational circumstances and community attitudes, yet it has the potential to provide opportunities for replication and generalization. The Indonesian government has consciously been aware of economic globalization, democratization and participatory governance as part of the global development debate, as shown in their development policies and actions (McGee and Kumsa 2001).Michael Storper (1997) describes the general phenomenon of economic globalization as “the flow economy”. This phenomenon encompasses social-economic changes that occur at multiple levels simultaneously (multifaceted). Next to economic globalization, state of the art regional development practices as adopted by Indonesian regional development planners encompass (1) Decentralization; (2) Governance; (3) Subsidiarity; (4) Equity; (5) Sustainability; and (6) the importance of civil society (Walter B. Stohr, 2001). Indonesia faces a complex development situation as it has been in a period of democratization and opening up of the economy. Developments include direct general elections, the implementation of decentralization policies and various national policies inviting international investment. The country‟s efforts to take economic globalization processes and progress in international development theories into account are described in the following.
Since the start extensive and intensive national development programs at the end of the 1960s, Indonesian development planning has witnessed many well-documented and solidly evaluated experiments. During this period, the Indonesian government actively developed policies based on modernization theory, growth pole strategy, and import substitution strategies (Info Ristek 2007). The country also welcomed various advisors from institutes such as the World Bank and the International Monetary Fund. The
documentation of the Indonesian government‟s experiments in regional development
Based on these lessons learned and by observing regional planning processes, this paper expects to find factors/variables that are contextual for regional development.
Development factors/variables to be included in the evaluation framework should be contextual and, henceforth, emerge from a bottom up process. For this reason, this paper uses action-evaluation research among a variety of social economic groups in an agricultural community. The choice for an agricultural community is a choice for the majority of Indonesian communities belonging to the „silent majority‟. More than 45 % of the Indonesian population is engaged in the agricultural sector. Nevertheless, agricultural communities have the most limited access to political and decision-making processes. This characteristic is of relevance to action-evaluation research, which pivots on a participatory and grassroots approach. Within the agricultural communities pressing development problems exist, such as poverty. There is a clear need for ideas to mitigate them.
Regional development practices in Indonesia testify of complex policy formulation and development intervention. By reviewing several authors (Booth 1988; Mubyarto 1989; Van der Eng 196; Harun 1999; Pranoto 2006; Sudaryanto and Rusastra 2006, three types of policy experiments in regional development (especially related to agriculture) can be distinguished. The first type based on the modernization paradigm is
“agricultural intensification” by a technological development strategy and the establishment of supporting institutions. It was the most successful program/strategy as it increased rice production and enabled food selfsufficiency by 1984. The second type is
“poverty alleviation” by economic programs such as IDT (Presidential instruction to solve the problems of underdeveloped rural areas) carried out from 1993 to 1996, Poverty Alleviation through Rural Urban Linkage (PARUL) launched in December 1997, and
kecamatan (sub district) development program (KDP 1998) in 2002 renamed to
PNPM-PPK (Program Nasional Pemberdayaan Masyarakat (national community development program)-Program Pengembangan Kecamatan (sub district development program). The
third type is “regional spatial planning programs”. These programs were directed at the
enhancement of rural services, rural-external linkage diffusion, and to the facilitation of agricultural input supply and product marketing. PARUL is also included in this third type. Other examples of the third type are the Secondary City Strategy through NUDS‟s (National Urban Development Strategy) in 1990, and the comprehensive Regional Spatial Development Planning (RTRW=Rencana Tata Ruang Wilayah), which has become a routine program.
All policies as described above corresponded to the then actual global debate on development theories. For instance, the emphasis on technology as the key to development is based on the Modernization Theory, as proposed by Rostow and Organski (1962). The second type might be related to Chenery‟s (1935) Investment Re-direction theory. The regional spatial planning approach adopted several proposals such as the Growth Pole strategy of Perroux (1950), Boudeville (1950), Rodwin (1969), Friedmann (1966) that demands public investment to be concentrated in relatively few
sectors and places; North‟s (1955) Export-Base theory to develop a region‟s comparative
advantage, or Rondinelly‟s (1978) Urban hierarchy & secondary cities to facilitate
strategies, many potential variables related to technological, human, as well as institutional resources, are expected to emerge from the research presented this paper.
1
stCase: Exploratig the w
ay of people’s self
- evaluating well-being in
Magelang Regency
The community‟s self-evaluation of their well-being started with the question: how do you assess your present living situation (keadaan/suasana); is there any progress or improvement, for instance on welfare (kesejahteraan)/prosperity (kemakmuran). From the results of snowballing, it showed that profession and age influenced the answers upon quality of life and situational improvement/progressmainly. Typical answers that
emerged were “better”, “not so much different/NSMD”, and “worse”.In fact, these
typical answers were mentioned relatively quickly. This confirmed the findings of the
CSB‟s survey, and supported the argument that people do not evaluate well-being in absolute terms, but in relative terms.
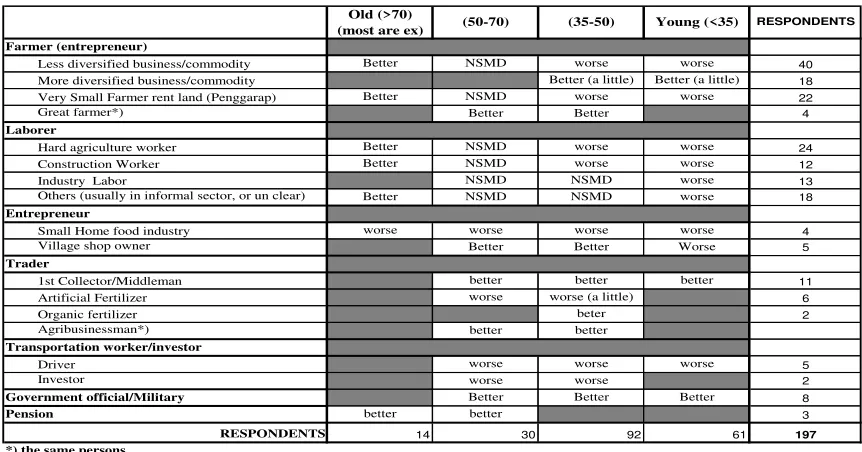
This typical evaluation was very much influenced by the perception of each group on the opportunities available to them, such as what efforts they have to do to achieve something. This encompasses their professional opportunities, what they own or consume such as land, goods, livestock, technologies/knowledge, the market situation, and certain physical and social environmental factors. Table 2 shows the perceptions found classified according to profession and age.
Old (>70) (most are ex)
Farmer (entrepreneur)
Less diversified business/commodity Better NSMD worse worse 40
More diversified business/commodity Better (a little) Better (a little) 18
Very Small Farmer rent land (Penggarap) Better NSMD worse worse 22
Great farmer*) Better Better 4
Laborer
Hard agriculture worker Better NSMD worse worse 24
Construction Worker Better NSMD worse worse 12
Industry Labor NSMD NSMD worse 13
Others (usually in informal sector, or un clear) Better NSMD NSMD worse 18 Entrepreneur
Small Home food industry worse worse worse worse 4
Village shop owner Better Better Worse 5
Trader
1st Collector/Middleman better better better 11
Artificial Fertilizer worse worse (a little) 6
Organic fertilizer beter 2
Table 2: Groups Perception on Quality of Life
This table is based on a selection of representative interviews, whereas the following narratives are a further illustration of the typical perceptions found.
“Better”. Mostly successful agribusiness people, traders, and civil servants, such as teachers, and the military, and local government officers typically give this answer. These groups including government officers or pensioners are all engaged in agricultural
small. During the time span of the survey, only four successful agribusiness people, who also acted as wholesalers, were encountered. These persons are locally known as
juragan. The general impression was that the present situation is better than two decades
ago. Due to the development of better transportation networks also in other parts of the nation, the market was enlarged with better opportunities to sell more local products or at a higher price. Better access to agro-technology such as fertilizer increased the local productivity in tons per hectare significantly. This implies a positive impetus for their businesses not only by an enlarged market with better prices for local produce, but also by an increased availability of agricultural products for that market. There is however competition with distributors in other regions to export to a few concentrated markets such as Jakarta or the islands Bantam and Kalimantan. Nevertheless, the interviewees asserted that as they had permanent business partners in those markets, and that their business was safeguarded.
Although with different levels of confidence, smaller traders perceived the
situation generally also as „better‟. Some collectors/middlemen, for instance, said:
… as far as we can maintain good relations with farmers as well as with wholesalers (juragan), we
can still run our business…. It is okay not to get so much profit but to have continuity.
… I feel the situation is better especially since I have my own car. I can easily move from one
village to another without worrying the rent of a car except the gasoline…. The roads are also
better now, only on several places there is still gravel, but in most cases farmers bring their commodity to tarmac roads. Of course when supply decreases we have to compete between us
then sometime I have to use not so proper ways…
….wow, especially since I got a mobile phone (he showed me), I never experience any loss since I
know the normal price in Jakarta. It is not easy anymore for juragan to manipulate the price….….
one time I may perhaps develop my business similar to them. I already know a big trader in Jakarta. Only because of lack of investment capital I have not had the chance to start developing
my business... ….I am now trying to get closer access to this person in Jakarta. I hope that he will
lend me money and I guarantee him to seek good and enough commodities for him…
…” I am happy with this new auction” said a middleman at the market. Now I do not have to
depend on juragan anymore. There are always traders coming from other region to whom I can
sell …. (Just to see his reaction, I asked him what would happen if farmers would directly sell their commodities here.)… I don‟t think so. It will not be efficient for them, except for farmer in the direct vicinity of this market…Especially for commodities such as chillies they usually sell in small quantities for instance once in a week, depending on the size of their land …
Most government officers, living in the rural areas, also mentioned the perception
“better”. All of them, especially those born in the region, are considered as belonging to a
farmer family; their parents or even most of themselves do still practice on-farm activities. Commonly, they said that being a government officer has given them access to a secure source of finance.
…” I can save or use my salary for non food”….said one of them,
Another man said, “Yeah although now the prices of some necessities increase, it is still okay for our family. We use our salary not for food, but mainly for kids schooling. Now my kids are still at
the elementary and junior high school. I don‟t know if he wants to go to the university…. let‟s see”
….”Being a government officer makes it easy for me to buy a motorcycle on credit, or to access another line of credit, as for instance my colleague who set up a small home shop run by his
“In my time, almost everybody wanted to be a government officer (red vehicle license plates for
state vehicles are associated with government officers). Imagine that you get a monthly salary, rice for the family (he said that he got 20 kg (?) per month when his 2 kids were still young), health
insurance, and a guaranteed pension,” said a 65 years old pensioner.
Another group that perceives the current situation as “better” is the recently emerging organic fertilizer producer/retailer. I encountered at least 2 of such individuals in the research area, but according to them there are about 10 persons in this region and many more in other regions, doing the same. One of them said that the 10 who operate in this region are friends who previously were contracted by the Belgium Agribusiness Company in Aceh. After the end of the contract about three years ago, he had tried doing business in Jakarta, but eventually decided to establish his small business here. This person said that due to newspapers, television, and, most importantly, the coming of
several NGO‟s, farmer‟s awareness in using organic fertilizer, or in his term „back to organic‟, is increasing. And especially in the present days, farmers experience that some chemical fertilizers are difficult to get, and when they are available, only for a very high price.
“This situation is fortunate for me as I now have at least 200 farmer customers to supply to” he
said.
There are other upcoming actors who also perceive the current situation as better. They are young men who inherit a small piece of land from their parents to cultivate but now also diversify their activities to selling seedlings grown on small shelves. They utilize their yard or even the side the street for this activity. When I asked them why they were optimistic that this business would continue to be beneficial to them, they said:
“Oh I feel no problem. In fact now we produce these seedlings not for local farmers. We now send this to regions such as Wonosobo (about 50-60 km away) and Yogyakarta (45 km away).
Sometimes buyers also come here”
“No, no problem. We are well known for this business. My buyers say that the quality of seeds
from other places is usually not as good as seeds from here”, according to another actor.
One of the most interesting findings is that the “better” perception also emergefrom people who get „help‟, due to community‟s values such as „solidarity‟ (see
chapter 6), and can thus not be classified by occupation or age. This statement, for instance, came from middlemen who were given the opportunity to buy product from farmers who could have sold the same produce directly on the auction. The farmers continue selling to the middlemen, as they have become a long time partner. Solidarity happens also within kinship relations that besides performing as a source for informal financial capital, also have significant influence in terms of land management. It is found that among the communities who have a kinship relation a selected group collates land in larger units to be managed/cultivated. This happens usually when some of them have jobs out of agriculture. By this practice, the members who are still engaged in agriculture have the opportunity to run a farming business on a larger and thus more economic scale. There is no charge required in this practice; nevertheless a person who gets lands will consciously give a small part of the benefit from the harvest to the landowner. This practice also results in „better‟ perception by people benefitting from this system.
“Worse” was the answer of all hard working agricultural labourers or most of the small
reason for the “worse” perception. The first reason is that not having a motorcycle did not increase their assets, mainly land or a set of tools to be used for agricultural production. The second reason is very much influenced by their experiences of the certainty of ever increasing expenditures for daily necessities compared to the uncertainty of their income. They feel that although they have always stepped up their efforts for a higher productivity the revenues did not keep pace significantly while daily expenditures increase continually. Although the productivity and output increased, the cost of inputs increased
too, while the yield‟s price is uncertain. Thefollowing is an example of their perception. “We (family) don‟t know why luck has never been at our side (sepertinya tidak pernahberpihak pada kami). Living now is even worse than in my childhood, even worse. If in the past, although I knew my parents had not much money, we never had to worry about food. Now, with our very small landholding, we have to decide whether to grow paddy and some vegetables, or for commodities to sale. For us this is just like gambling. Of course we have more expectations besides only our daily food. We would like to give our kids a higher education, just like other families. We would also like to buy a motorcycle. However, like in gambling, we are only working and waiting. The basic hope is that we will always be able to buy food and pay our other
bills, such as electricity and the social fund from the revenues of our harvest”
Similar to the hardworking agricultural labourer, most 50-70 years old respondents compared the current situation of food security and the margins on commercial commodities with the past. They asserted that although they had not much cash in the past, they never had to worry about food. Compared to the current farmers
who focus to on cash crops, formerly farmers (until the 70‟s) prioritized growing food
crops for their own daily needs and set aside part of the harvest for bad seasons. Only cash crops such as cabbages and tobacco were obtaining prices with a very high profit
margin. This group of informants observed that today‟s farmer tends to depend on
commercial commodities with a too optimistic expectation of market prices as compared to the rice price as experienced in 1970‟s to the early 1990‟s.
Another group that perceived the current situation as “worse” are the local drivers
and industrial workers; they are worried about their future. Local drivers experience the decrease in customers since some farmers have invested in cars for transporting their own commodity and that of neighbouring farmers. Local drivers generally operate cars, owned by shopkeepers and/ or government officers. They said that their situation went even worse when the government raised the price of gasoline. Car owners agree with this perception, they even consider to stop their business and to sell their car. For the active industrial worker two things are worrisome. First the uncertainty of keeping their job, as this is dependent on the economy at large. The second reason is that their salary deflated due to ever increasing daily necessities prices. The following statement illustrates this worry:
“… Sometimes I think that not to be in deficit is just okay, Sir, perhaps, some small money left for
gasoline and lunch. But we are happy that we now get health insurance”, said an industrial labourer whom I met at Tempuran Industrial complex. “You know the standard payment in this
region. (Current regional standard of monthly payment is about 650.000 rupiah) Only because the
certainty of this income I still keep this job as it is not easy to find another job nowadays.”
“…. I hope, that I will always be able to at least reach a minimum target to pay to the car owner every day”, said a public vehicle driver when I met him in Soka Market, Dukun. “The situation
seems to be more difficult. I do not know whether I will survive doing this job or not. But in fact I
“A little bit worse”. Some synthetic fertilizer retailers who generally operate their shops
at the village market place (village service centre) are feeling that the situation is worse for them. Some of them are descendants from Chinese immigrants.
“… Now it is not our golden period. (I interrupted, “when was your golden period?”). That was approaching 1980‟s to around 1995. (What is happening nowadays?). She said, “Synthetic
fertilizer now is expensive and even often disappears so that farmers tend to reduce the use of it,
while some now use organic fertilizer. (Why do you not provide organic fertilizer?). ”No. I am not the producer of that. (Is there no producer who would supply you?). “No. They will not. They are
local skilled people who produce very little. Most of them co-ordinate farmers by partaking in a
farmers group. There is such a membership”. (“About the missing of artificial fertilizer, some people said retailers like you hoard it, is it true?”). “Not really, at least I myself do not do that”. (“So what is your prospect?”). ”I am little happy with the overwhelming use of mulsa plastic to
avoid parasitic plants. Although the same farmer will buy it back after about one year, there is an increase in the number of farmers using the plastic. Perhaps we will also start to collect
commodities (as wholesaler). I have space here”, she said just when her husband was coming and
gave a sign to show me that they have talked about that.
“Not so much different/moderate/fluctuating”. This means that the situation is perceived as not having any significant changes; it could be always good or bad. However, the second impression is more dominant as the most comments pointed out by lower class labourers and farmers whose land size is not so different from the regional average (about 2000 m2 wet or dry land). This pessimistic sound is likely due to experiencing a bad situation during most of their live. Their poverty is generally inherited from their parents, which is difficult to escape without external help.
“For us, the situation remains constant. It is perhaps our destiny to be poor. We don‟t have any land except this small piece to live on. We don‟t have any skills except cultivate a very small-scale farm. However, I cannot blame my parents; they have given all these to me. I hope my son can
understand the situation‟.
His wife takes part in this conversation and makes a comment:
“I think we should still thank God. This situation is better than them (she point a finger at a
particular neighbouring house). We cultivate our own land, whereas they cultivate other persons
land, and only maro(share the harvest 50:50 % with the owner)”.
I asked them whether all families have similar experiences, with not much possibility to improve their situation. He denied and described that there is some hope for families whose members migrate for jobs to other regions:
He said, “as household help, they get an opportunity to develop a simple saving scheme starting to
buy gold, goats, cows and, if only there are neighbours like me, who due to adverse circumstances
(illness) are willing to sell a parcel of land, they will have a change to enlarge their own”.
Why doesn‟t your son go to the city?
“It is difficult for him to get a job with agood salary on only having an elementary school certificate. This is not a problem for women to be a housekeeper. Although the salary is not much,
in case she has a good boss she will almost never spend her salary and keeps it as savings”.
All stakeholders‟ answers show that there are „positive‟ and „negative‟ changes.
People were happy when experiencing positive changes and sad when experiencing negative changes, while many are also sad when the situation remains the same. The
upon the content of the conversation, it is found that there are typical „words/terms‟ used
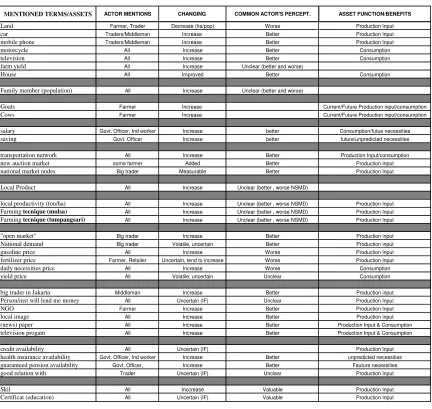
by respondents. These words (see table 3.) are the input to answer that question.
MENTIONED TERMS/ASSETS ACTOR MENTIONS CHANGING COMMON ACTOR'S PERCEPT. ASSET FUNCTION/BENEFITS
Land Farmer, Trader Decrease (ha/pop) Worse Production Input
car Traders/Middleman Increase Better Production Input
mobile phone Traders/Middleman Increase Better Production Input
motorcycle All Increase Better Consumption
television All Increase Better Consumption
farm yield All Increase Unclear (better and worse)
House All Improved Better Consumption
Family member (population) All Increase Unclear (better and worse)
Goats Farmer Increase Current/Future Production input/consumption
Cows Farmer Increase Current/Future Production input/consumption
salary Govt. Officer, Ind worker Increase better Consumption/futue necessities
saving Govt. Officer Increase better future/unpredicted necessities
transportation network All Increase Better Production Input/consumption
new auction market some farmer Added Better Production Input
national market nodes Big trader Measurable Better Production Input
Local Product All Increase Unclear (better , worse NSMD)
local productivity (ton/ha) All Increase Unclear (better , worse NSMD) Production Input
Farming tecnique (mulsa) All Increase Unclear (better , worse NSMD) Production Input
Farming tecnique (tumpangsari) All Increase Unclear (better , worse NSMD) Production Input
"open market" Big trader Increase Better Production input
National demand Big trader Volatile, uncertain Better Production input
gasoline price All Increase Worse Production Input
fertilizer price Farmer, Retailer Uncertain, tend to increase Worse Production Input
daily necessities price All Increase Worse Consumption
yield price All Volatile, uncertain Unclear Consumption
big trader in Jakarta Middleman Increase Better Production input
Person/inst will lend me money All Uncertain (IF) Unclear Production Input
NGO Farmer Increase Better Production Input
local image All Increase Better Production input
(news) paper All Increase Better Production Input & Consumption
television progam All Increase Better Production Input & Consumption
credit availability All Uncertain (IF) Production Input
health insurance availability Govt. Officer, Ind worker Increase Better unpredicted necessities
guaranteed pension availability Govt. Officer, Increase Better Fauture necessities
good relation with Trader Uncertain (IF) Unclear Production Input
Skil All Inccrease Valuable Production Input
Certificat (education) All Uncertain (IF) Valuable Production Input
Table 3: Kinds of Assets Perceived Influence People‟s Quality of Life
NOTE: If, in the „unclear statement‟ is indicated that people did not mention the existence of that asset, they do expect its presence.
From the analysis of factors pertaining to perception it emerges that to achieve a better quality of living people need the “things” mentioned. Apparently, concept of
“benefit” embedded in „things‟ is very important. The „things‟ mentioned by he interviewees actually correspond to the definition of an asset as discussed in chapter 2.
Therefore these „things‟ will be called “assets”. Only because of considering present „things‟ considered as assets, people have opportunities to attain their current and future necessities, either for direct consumption or for the production of commodities. Table 3.2 depicts the functions/benefits of assets mentioned by the people interviewed.
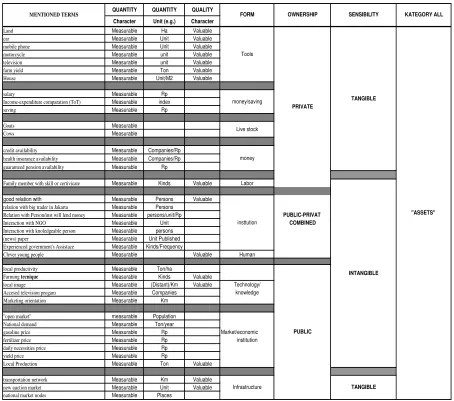
Economists are the most familiar with the concept of „assets‟. In the System of
main categories: financial usually tangible assets, and non-financial tangible as well as intangible assets. While abstracted from people perceptual evaluation on their current living situation, an asset is a concept that includes elements considered to have provided current necessities and some time also opportunities to add new kinds of future necessities. Assets for current necessities for instance are food, housing, health,
children‟s education, leisure/recreation time, or money to purchase those commodities, while future necessities are those not yet available or affordable. First, all terms mentioned by people were collected then classified. Secondly, their reasoning were classified to whether they are measured quantitatively or valued qualitatively. It was also found that most terms have measurable and valuable characteristics. The next step is to classify those characteristics based on our ability to sense if those terms are tangible or intangible. The tangible assets are those, which have physical attributes such as land, goods or livestock, or other physical entities such as infrastructure and tools. Meanwhile, intangible assets are those which do not possess a clear physical dimension such as human knowledge and skills and other kinds of abilities, such as human‟s cognition or perception of objects and events, the way and structure of human interactions, languages of human interaction such as price, and the law of demand and supply.
There are two kinds of intangible assets: Intangible Individual Assets, attached to a human individual, and Intangible Institutional assets, which are attached to a social context. Institutional assets include interpersonal or inter-group relations/interactions such as trust, solidarity, or interpersonal relationships such as kinship, business relations,
QUANTITY QUANTITY QUALITY
Family member with skill or certivicate Measurable Kinds Valuable Labor
good relation with Measurable Persons Valuable
relation with big trader in Jakarta Measurable Persons
Relation with Person/inst will lend money Measurable persons/unit/Rp PUBLIC-PRIVAT
Interaction with NGO Measurable Unit COMBINED
To check the generality of perceived assets, which determine community‟s quality
of life, the research continue to test through quantitative survey. The test is mainly directed to assess if:
1. inventoried assets in this chapter are relevant for well-being/quality of life evaluation (by testing whether there is consistency of the relation between perception on assets with perception on quality of life or not);
2. The evaluation of well-being is relative, contextual, and idiosyncratic.
For this examination, the test has used questionnaires to ask community number of some villages, which were selected to represent:
1. Villages experiencing economic growth due to agriculture modernization and commercialization;
2. Villages that have footloose industrial area;
3. Villages that perform as rural service growth center;
5. Villages that are experiencing agricultural diversification (also other business diversification) because of a nearby tourism attraction;
6. Villages, that are dominated by small industry with simple technology
Figur 2: Locations of Sample Villages
Random sampling was done to 10% of the households in every village, resulting in 340 household respondents. A local development facilitator, who has been in practice on the villages for several years, did the survey. Respondents were selected randomly from the list provided by the village administrator. The survey was taken about February 2009.
The first qustion is similar to the qustion asked to the respondents in the snowballing survey: to give an evaluation whether their current quality of life is better, worse, or not so much different compared to previous days. Secondly, they were asked to give similar statements (better, worse, or not so much different) to the assetslisted. For
the analysis, the “better” answers scored 2, “worse” -2, and “not much different” scored as 0.
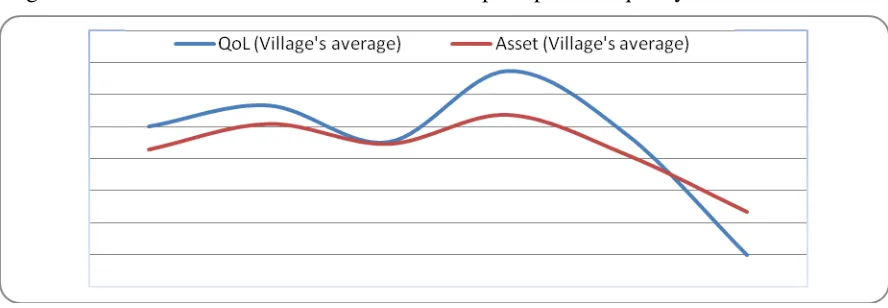
checked atthe community level (villages), the consistency is still maintained. Figure 4.. shows the pattern of agregated scoring of community‟s perception on quality of life, which is similar to the pattern of agregated score of community‟s perception on assets. These give evidents that the level of well-being is equal to the improvement or decrease of assets (WB= d Assets).
Figure 3: Patternal corelation between individual perception on quality of life and assets
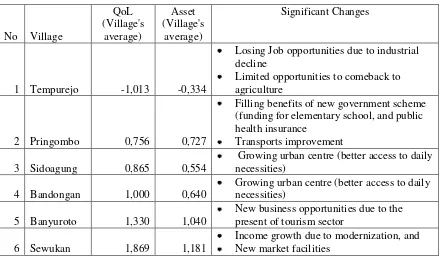
The gradation of perception on well-being among villages is shown in Figure 5. Findings from this survey show that the perception on quality of life is more related to the situational changes that happened, rather than to actual levels of assets and to past experiences. Tempurejo, for instance, which is more urbanized than Prinombo and has high level of infrastructure, but because its community has just experienced economic decrease, theirperception of quality of life is the lowest. IN contrast, in Pringombo, that is relatively isolated, although some infrastructure and facilities have just developed but are also far below the quantity and quality in Tempurejo, their perception upon well-being is better. These facts provide evidence that perception about well-being is relative and contextual. Table 5. gives an explanation about the relation between pereptions on well-being (general quality of life) with changes.
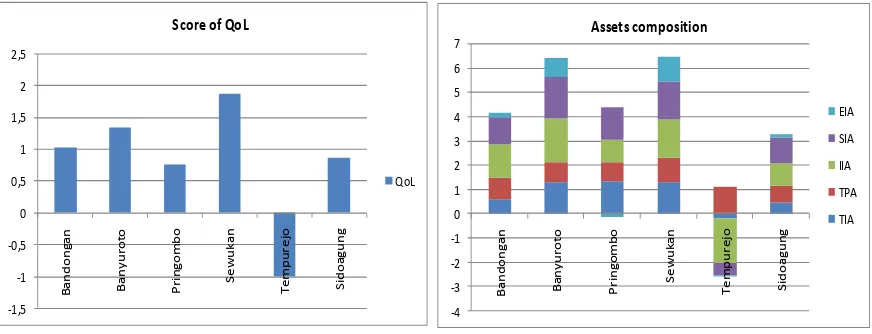
Figure 5. Score of community‟s perception on quality of life
No Village
QoL (Village's
average)
Asset (Village's
average)
Significant Changes
1 Tempurejo -1,013 -0,334
Losing Job opportunities due to industrial decline
Limited opportunities to comeback to agriculture
2 Pringombo 0,756 0,727
Filling benefits of new government scheme (funding for elementary school, and public health insurance
Transports improvement
3 Sidoagung 0,865 0,554
Growing urban centre (better access to daily necessities)
4 Bandongan 1,000 0,640
Growing urban centre (better access to daily necessities)
5 Banyuroto 1,330 1,040
New business opportunities due to the present of tourism sector
6 Sewukan 1,869 1,181
Income growth due to modernization, and New market facilities
Table 5. the relation between perception on quality of life and changes
different. On this basis it can be postulated that well-being is idiosyncratic. Every
Figure 6: the Unique Composition of Assets
Both qualitative nd quantitative survey in this case study highlights two concept.
First is that people‟s ealuation on well-g is relative and idyosyncratic. These concepts shows the relevancy of CA to evaluate well-being. The second is that assets are important determining factors for self-evaluation on well-being. This
gives fundament to the idea to use the concepts of assets as indicating factors. The
logic relationship among well-being, capabilityand assets is as follows.
Available and accessible assets give opportunities to community to “functioning”. „Real functionings‟ are actions that have been done by people,
while „real capabilities‟ refer to a set of „available functionings‟ that could have been
employed by people. Capabilities can be measured by identifying various functionings, which were already available or have already been performed. The basic proposition of the idea to integrate asset and capability is that the level of capability correlates to
available/accessible “assets” according to the following logic:
– For a person, assets can be material or non-material to be directly consumed, as well as material or non-material to be invested in production enhancement.
– For production, assets are seen as resources or capital. Assets can be input or a catalyst in production processes.
– The outputs or revenues from production can be material as well as non-material. The outputs, then, become new assets.
– Using assets in consumption or in production activities is defined as functioning.
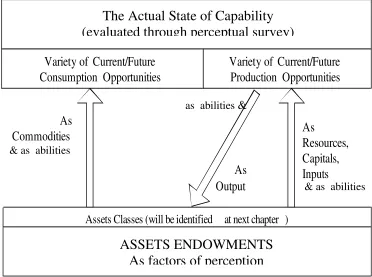
Figure 7: Asset-Capabilities Relationship
„Functioning‟, the ability to „do‟ or to „be‟, can be either classified for
consumption or production activities. It can be attained only if people have both pertinent
„abilities‟, i.e. owning or having access to relevant commodities/capital/resources/input,
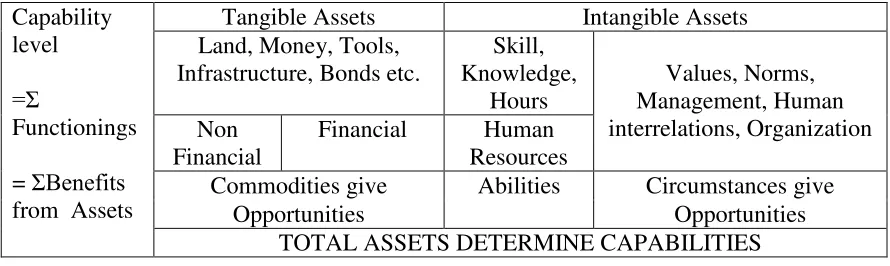
and supportive circumstances in their environment. Commodities, abilities, and circumstances are classified as assets. Therefore, functioningis is a function of ability (abilities), commodity (commodities), and circumstances that make achievement of certain functionings possible. The quantity and variety of assets determine the variety of available functionings, or capabilities. Because commodities and circumstances provide opportunities to people and their abilities, it also can be said that capabilities represent the sum of opportunities and abilities, as listed in Table 6.
C = Σ Functionings
Functionings = f (available assets) C = Σ f (available assets)
C = Σ f (commodities, abilities, circumstances)
C = Σ f (Tangible-Non-financial assets, Tangiblefinancial assets, Intangible human-attached assets, Intangible sociallydetermined assets)
As Commodities
As Output
THE ŌACTUAL STATEÕ OF CAPABILITIES
Evaluated through Perceptual Survey
Variety of Current/Future Consumption Opportunities
Variety of Current/Future Production Opportunities
ASSETS ENDOWMENT (AS FACTOR OF PERCEPTION )
Assets Classes (will be identified at next chapter )
As
Resources, Capitals, Inputs & as abilities
as abilities &
& as abilities
The Actual State of Capability
(evaluated through perceptual survey)
Capability
Commodities give Abilities Circumstances give
Opportunities Opportunities
TOTAL ASSETS DETERMINE CAPABILITIES Table 6. Assets Classification as Sources of Capabilities
Above scheme depicts the integration of terms and the classification logic within the literature on CA and assets. It shows the relationship between terms and provides a basis to integrate both concepts. Classified assets as described in literature on asset may be categorized into three main concepts in CA, which make functionings possible. Material assets, such as land, money, tools, infrastructure and bonds are financial and non-financial commodities. Intangible assets such as values, norms, management, human interrelations, organization, are classified under circumstances. Human resources assets such as skills, knowledge, hours, which are also intangible, are in the CA classified under abilities. Commodities and circumstances give opportunities to persons having abilities to select and achieve functionings.
Based on above logical relationship between assets and capability and the acceptance of the capability approach to well-being, this paper develop so called
“Capability Index” (CI) to be indicator in evaluating development success. A higher index implies that a community has experienced a higher improvement on their capability level, i.e. their state of freedom to choose. Because the level of freedom to choose indicates the level of well-being, which includes happiness, a higher CI may also indicate a higher level of happiness.
Basically, the formula to calculate CI is developed based on the
following insight, which are gained from the case study.
1. Happiness due to higher quality of life, or the level of well-being is determined by higher level of freedom to choose, or referred to as capability level. Positive changes are more strongly perceived and significantly improve the feeling of happiness
2. The capability level is determined by the variety of possible functionings provided by assets
3. The variety of possible functionings is determined by the level of availability and accessibily of assets, and the level of opportunities or constraint given by them 4. The level of availability and accessibily of assets may be improved or decreased,
and so are functionings, which are facilitated or constrainted by assets.
5. Functionings, besides as a process of using particular assets, which may be also facilitated or constrained by other assets, is actually also a process of producing and reproducing new additional assets
Based on these assumptions, the relationship between capability level, functionings, and assets are expressed as follows:
Capability level is equal to the sum of possible functionings
Current capability level = the level of available functionings, which is determined by the degree of opportunities/help/contraints given by the current level of
availability and accessibility of assets
In relation to the way people make evaluation, the following are principles to be used in the CI formula:
The degree of opportunities/help/contraints given by assets is evaluated by people by saying whether assets give facilitation (or help) or constrains to them to choose and perform functionings.
The level of current assets availability and accessibility of assets is evaluated by people by saying better, worse, or not so much different.
To get these two variables, practically in the survey, the community is asked to evaluate whether the current condition of listed assets is getting better, worse, or does not change compared3 to their previous condition. Further, the community is asked to evaluate the level of opportunities given by current assets for them to achieve certain preferred functionings: they asked to answer whether assets give opportunities/help, or
even constraints. People‟s perceptions on assets availability/accessibility as well as their
perception on the benefits giving by assets are scored.
Three-points scale is used to evaluate the current level of assets availability and accessibility. Only three points (better, worse, and not so much different) are decided to
elicit respondents‟ evaluation of their assets condition. But for functionings, unlike assets, because, it is not only observed and perceived by people but may also be created in people‟s mind, the perceptual scale used is broadened in order to give a larger spectrum of answer, which include moderate answers. A five-point scale is used to evaluate the level of opportunities given by current assets to choose and perform a particular functioning (Very helpful, helpful, un-clear, constraining, and very constraining).
Scoring is needed to convert people‟s perceptual evaluation to be quantitatively measurable. A range between -2 to 2 is proposed to convert the qualitative scale to the quantitative score. The range between -2 to 2 is decided to make the computation and interpreation of index simple, while still able to represent the contrasting answers of people‟s evaluation. The „better‟ statement for assets availability and accessibility is scored as 2, worse as -2, and not so much different (no change) as 0. For the evaluation on the level of opprtunities given by assets, score 2 is given for very helpful answer, 1 for helpful answer, -1 for contraining answer, and -2 for very constraining answer (see Table 7.).
Perceptual evaluation scale of assets availability and
accessibility
Perceptual evaluation scale of opportunities or constraints given
by assets to perform or create functionings
BETTER (score 2)
WORSE (score 0)
NSMD (not so much a Different) (score -2)
VH = Very Helpful (score 2)
H = Helpful (score 1)
UC = Unclear (score 0)
C = Constraining (score -1)
VC=Very Constraining (score -2)
Table1 7: Proposed perceptual evaluation scale
Based on all the above principles, the formula to compute CI is as follows =
LAF + ABS (LAF)
X
(AIM
–
100)%
+ 800 /300 -2
EI =
Notation:
CI = Capability Index= the extension of freedom to choose LAF = The average Level of Opportunities given by Assets AIM = The average Level of Assets Improvement
ABS = absolute value
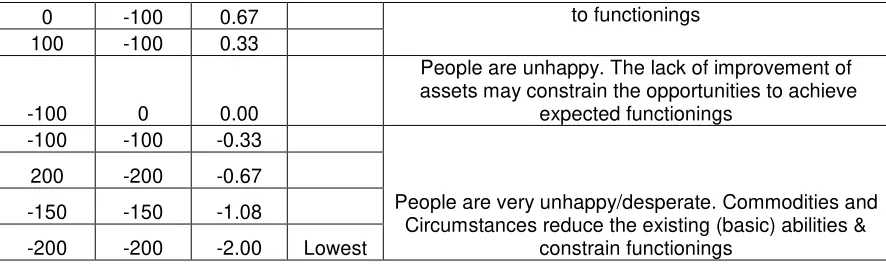
When CI formula is simulated, it gives consistent results to measure well-being and happiness based on CA, as shown in Table 8.
LAF AIM CI RANK MEANINGS, for instance
200 200 2.00 Highest People is experiencing a perfectly happy situation.. Commodities and Circumstances optimize, even improve the existing basic abilities and give a great
opportunities to a variety of functionings 100 100 1.00
50 50 0.75 -200 200 0.67
The improvement of assets do not facilitate expected functionings, in fact,its constrains
0 100 0.67
100 0 0.67 -100 100 0.33 -50 50 0.42
0 0 0.67 The situation is acceptable. Assets may not be improved, but their existance still gives opportunities 50 -50 0.58
0 -100 0.67 to functionings 100 -100 0.33
-100 0 0.00
People are unhappy. The lack of improvement of assets may constrain the opportunities to achieve
expected functionings -100 -100 -0.33
People are very unhappy/desperate. Commodities and Circumstances reduce the existing (basic) abilities &
constrain functionings 200 -200 -0.67
-150 -150 -1.08
-200 -200 -2.00 Lowest
Table 8: Simulation of CI Formula on Extreme or Specific Situations
To analyse the applicability of the framework, the paper conducts an empirical testing. The testing is aimed to test whether the formula included in the framework is able to maintain the concept of in CA that sees well-being evaluation as relative, contextual, and idiosyncratic. The main tool (kit) used in the survey is quisionare, which is provided for people to evaluate the available assets. The quisionare guides people to state their evaluation of the level of assets availability and accessibility, and the level of opportunities given by assets, which may make them able to choose or perform particular/preferred functionings. Assets to be evaluated are categorized to be: Tangible Individual Assets (X1), Tangible Public Assets (X2), Intangible Individual Human Assets (X3), Social Institutional Assets (X4), and Economic Institutional Assets (X5). Table 9 is the basic form of quisionaire.
The principles of using quisionaire are as follows :
*) Filled by comparing the current situation to the past in the same place, or, especially for individual capability, assets to the current place to the previous place (origin) in case of migrants or travelers
**) N = number of respondents
***) n = number of kinds of assets in the same class ****)% = (frequency of answer/n)100 %
*****) value = BETTER (score 2), WORSE (score 0), NSMD (not so much different) (score -2), VH = Very Helpful (score 2); H = Helpful (score 1), UC = Un Clear (score 0), C = Constraining (score -1), VC=Very Constraining (score -2)
better worse NSMD VH H UC C VC
1 Space (land) to stay X1 0 0 1 1 0 0 0 0
2 Space (land) to generate income X1 0 1 0 0 0 0 1 0
3 transport Tools (Bike, Car, Motorcycle) X1 1 0 0 1 0 0 0 0
4 Information Tools (Radio, TV, News paper) X1 0 0 1 0 1 0 0 0
5 Comunication Tools (Telephone, Comp-Net) X1 1 0 0 1 0 0 0 0
6 Income/material for daily Necesities X1 0 0 1 0 0 1 0 0
7 Saving X1 0 1 0 0 0 0 1 0
n 2 2 3 3 1 1 2 0
% 28.57143 28.57 42.86 42.86 14.29 14.29 28.57 0.00
Value 2 -2.00 0.00 2.00 2.00 1.00 -1.00 -2.00
Score 57.14286 -57.14 0.00 85.71 28.57 14.29 -28.57 0.00 X1 0.00 100.00
8 environment Quality (landscape, water, air, built env) X2 1 0 0 0 1 0 0 0
9 Land productivity X2 0 1 0 0 0 0 1 0
% 35.00 5.00 25.00 20.00 10.00 30.00 5.00 0.00
Value 2 -2 0 2 1 0 -1 -2
Score 70.00 -10.00 0.00 40.00 10.00 0.00 -5.00 0.00 X2 60.00 45.00
21 Self/CommEducation Level X3 1 0 0 0 0 1 0 0
22 Self/CommHealth Quality X3 0 0 1 0 1 0 0 0
23 Communication Skill/Ability X3 0 0 1 0 0 1 0 0
24 Creativity/Innovation Skill X3 1 0 0 0 1 0 0 0
25 Strugling Spirit/Survival Power X3 0 1 0 0 0 0 1 0
n 2 1 2 0 2 2 1 0
% 8.00 4.00 8.00 0.00 8.00 8.00 4.00 0.00
Value 2 -2 0 2 1 0 -1 -2
Score 16 -8 0 0 8 0 -4 0 X3 8 4
26 Community Membership/Kindship/Identity X4 0 0 1 0 1 0 0 0
27 Trust X4 0 1 0 0 0 0 1 0
Score 0 -6.666667 0 0 6.666667 0 -3.333333 0 X4-6.666667 3.333333
31 Access to Credits X5 1 0 0 1 0 0 0 0
32 Access to Job X5 0 1 0 0 0 0 1 0
33 Opportunity to Set Up Bussiness X5 1 0 0 0 1 0 0 0
34 Opportunity to Aspirate in Public Decision X5 1 0 0 0 0 1 0 0
35 Access to Material Consumption X5 1 0 0 1 0 0 0 0
36 Access to Material Input (for ec. production) X5 1 0 0 0 1 0 0 0
37 Opportunity to Product Marketing X5 0 0 1 0 1 0 0 0
38 Affordability to Health Cost/Acces to Gov's suport program X5 1 0 0 0 1 0 0 0
39 Access to Health Insurance X5 0 0 1 0 0 1 0 0
40 Affordability to Education Cost/Acces to Gov's suport program X5 1 0 0 0 1 0 0 0
41 Affordability to Housing Cost/Acces toGov's suport program X5 0 0 1 0 0 1 0 0
42 Affordability to Transport cost X5 0 1 0 0 0 0 1 0
n 7 2 3 2 5 3 2 0
% 16.67 4.76 7.14 4.76 11.90 7.14 4.76 0.00
Value 2 -2 0 2 1 0 -1 -2
Score 33.33 -9.52 0.00 9.52 11.90 0.00 -4.76 0.00 X5 23.81 16.67
*) Added Hyphotetically, not really expresed by informant during fieldwork SUM 85.14 169.00
X AVARAGE 17.03 33.80
CI can be used to assess:
iCI = individual Capability Index: the level of freedom to choose by a person at a certain time and place
aiCI = Aggregated Individual Capability Index: the average level of freedom to choose by a community at a certain time and place
pCI = Place’s Capability Index: the level of opportunity provided by place at a certain time due to the existence of assets at the place
Procedure to employ CI for each purpose is as follows: 1. Assessing Individual well-being/happiness (iCI) to:
a. Show the development of self and place (periodic development in the same place) through computing:
i. AIM by filling the perception of current-actual assets at a place by comparing it to similar assets at the previous time (BETTER, WORSE, NSMD/not so much different)
ii. LAF by filling perception of the level of function provided by assets at the current place currently (VH, H, UC, C, VC) b. Show self well-being/happiness in a new place (migrants, temporary
residents) through computing:
i. AIM: filling perception of assets at the current place by comparing it to assets at the previous place (BETTER, WORSE, NSMD/not so much different)
ii. LAF: filling perception of the level of function provided by assets at the current place (VH, H, UC, C, VC)
2. Assessing Average Individual well-being/happiness (aiCI) to
a. Show Aggregated individual well-being/happiness (aiCI) through computing the sum of individual capability per total respondents b. Indicating Disparity among individuals through calculating Standard
Deviation
3. Assessing Place‟s determination to community‟s well-being/happiness (pCI) to a. Show Place‟s determination to community‟s well-being/happiness
=opportunities provided by place due to the existence of assets to the population/group of population through computing:
i. AIM: filling proportion of (BETTER, WORSE, NSMD/not so much different) perception of current-actual assets at a place by comparing it to similar assets at the previous time.
ii. LAF: filling proportion of (VH, H, UC, C, VC) perception of the level of function provided by assets at the current place.
b. Indicating (AVAILABILITY AND ACCESSIBILITY) to give
opportunity to population/group to “functioning” of assets at the place and
The interpretation of CI result is that HIGHER INDEX= HIGHER CAPABIITY= HIGHER FREEDOM TO CHOOSE VARIETY OF FUNCTIONING=HIGHER
QUALLITY OF LIVING=HIGHER LEVEL OF HAPPINESS. Specifically, the resultant score can be interpreted as (or see table 8.2) :
Highest = 2 : respondent experiencing very perfect happy situation
because his “FUNCTIONING”is becoming higher. The IMPROVEMENT is, for instance, at least 200 % or even more. Beyond respondent
expectation
1 = respondent experiencing happy situation because his
“”FUNCTIONING”is becoming higher, The IMPROVEMENMT is, for instance, at least 100 % (doubled).
-1 = respondent experiencing desperate situation because his
“FUNCTIONING”is becoming lower, The reduction is, for instance, at least 100 % (almost diminishing).
Lowest = 2 : respondent experiencing totally unhappy (totally desperate) situation because his “FUNCTIONING”is becoming minus. The reduction of assets is, for instance, at least 200 % or even more.
To test the applicability and consistency of the formula to the principle of CA in evaluating well-being, the CI framework is tested through quantitative survey. The empirical testing is done in 15 villages within a subdistrict (Tempuran). The selection considers that villages in the subdistrict are rich in variation; ranging from a village which is quite urbanized and industrialized to a relatively isolated village. There are also villages which are economically based on home industry as well as agriculture. Random sampling is employed to 10% households in every village. Total respondents then are 450 households. A local development facilitator who has practiced for several years in the villages does the survey. Respondents are selected randomly from the list provided by the village administrator.
Basically respondents are asked to answer two questions. The first is similar to the question to the respondents in the snowballing survey: they are asked to give an evaluation whether their current quallity of life is better,worse, or not so much different compared to the previous days. In the scond question, the are asked to evaluate assets in terms of their availability/accessibiity and in terms of the level of opportunities or constraints they give to people. The evaluation is done by filling a form (survey kits).
-2.50
Figure 8: Graph Showing Correlation between iCI and
Score of Perception of Quality of Life
The relativeness of the concept of well-being is maintained when it is evaluated using the proposed framework. The relativeness is apparent when giving attention to the composition of assets. As shown in figure 9, every community needs almost the same level of assets in agregate to achieve the same score of CI, but the composition of assets is contextual.
Figure 9: The Unique Composition of Assets in relation to the score of CI
villages (see figure 11). In this sub district case, for instance, a change of only a group of assets (e.g. tangible assets: private and public) is not a determinant. A village has experienced a highly positive change in private tangible assets (Pringombo) but it evaluates that this group of assets has not provided enough functionings opportunities. The Other community in a village (e.g. Tempurejo) perceive that their private tangible assets decrease, but they feel that functionings opportunities provided by this group of assets is still relatively higher than the first village.
TIA = tangible individual assets; FTIA= functionings provided by TA TPA= tangible public assets ; FTPA = functionings provided by TPA IIA = individual intangible assets; FIIA = functionings provided by IIA SIA=social institutional assets; FSIA = functionings provided by SIA EIA =economic institutional assets; FEIA = functionings provided by EIA
Figure 11. Graphs showing unique composititon of assets determining capabilities
When placed to show the spatial variation, the data from the testing that shows the variation of the village‟s capability index (CI) becomes a capability map. Figure 12.is an example of a capability map that shows the variation of CI of 15 villages in the subdistrict of Tempuran. This capability map resulting from framework testing shows consistency to the conclusions argued in this paper that well being, as showen by CI, is relative and idiosyncratic.
TEMPUREJO (Cip = 0.61)
-2,00 -1,00 0,00 1,00 2,00
TIA FTIA TPAFTPA IIA FIIA SIAFSIA EIA FEIA
PRINGOMBO (Cip = 0.81)
-1,00 -0,50 0,00 0,50 1,00 1,50 2,00