THE BOGOR BUS STATION RELOCATION IMPACT ANALYSIS TO
THE BOGOR OUTER RING ROAD (BORR) AND
PANGERAN SOGIRI STREET PERFORMANCE
Tri Sudibyo
Graduate Student of Master Programme on Transport System and Engineering, Gadjah Mada University E-mail: [email protected]
Imam Muthohar
Department of Civil and Environmental Engineering, Universitas Gadjah Mada Email: [email protected]
ABSTRACT
As the main bus station in Bogor, West Java, Baranangsiang bus station is currently located in the crowded city centre, near many offices, campuses and department stores. There is a plan of Bogor’s Dinas Perhubungan Komunikasi dan Informasi (Diskominfo) to relocate the bus station to the new location in the Pangeran Sogiri Street in Tanah Baru area, near the newly built toll road, the Bogor Outer Ring Road (BORR).This research is conducted to analyze the traffic performance impact of the relocation plan of the bus station to the BORR network and the Pangeran Sogiri Street.
The traffic data is obtained from the field survey in the Baranangsiang bus station and the BORR network. Some other secondary data are obtained from the Dinas Lalu Lintas and Angkutan Jalan (DLLAJ) Bogor city. Based on the obtained data, a micro simulation model is built by using Aimsun traffic micro simulation program. The analysis is conducted in three traffic performance parameters; the traffic density, speed, and vehicles queue length.
With respect to the analysis result, the relocation causes a serious traffic problem to the BORR network and the P. Sogiri Street. To minimize the problem caused by the relocation, three scenarios are proposed and thus simulated based on the findings and observed traffic problems. The first proposed scenario is conducted by widening the P. Sogiri Street and providing a 4-4 toll payment gate system to the BORR. This first scenario is able to reduce traffic problem in some sections, but the average network density, speed and queue length are still high by 132%, -54%, and 200% respectively compared to the existing condition. The second scenario is conducted by widening the P. Sogiri Street and providing a 5-3 toll gate system. This second scenario is also able to reduce traffic problem in most sections, but the average network density, speed and queue length are still high by 248%, -70%, and 95% respectively compared to the main bus station before the relocation. The third scenario is conducted by widening the P. Sogiri into 4 lanes, providing a 4-3 toll gate system, and providing a new access from/to P. Sogiri Street to Bogor city direction. The simulation result shows that the third scenario is considered as the best scenario since in this scenario, the density, speed and queue length are relatively similar compared to the existing condition.
Keywords: Toll road, micro-simulation, traffic performance.
1 INTRODUCTION
Baranangsiang bus station is the main bus station in the Bogor city located in the crowded city center, near many department stores, campuses, and offices. There
is a plan of Bogor’s Dinas Perhubungan Komunikasi dan Informasi (Diskominfo) to relocate the bus station to the new location in the Pangeran Sogiri Street in Tanah Baru area, near the newly built toll road, the Bogor Outer Ring Road (BORR). This research is conducted to analyze the traffic performance impact of the relocation plan of the bus station to the BORR network
The objectives of this research are described below:
a.Simulating in a micro level, the traffic flow in the Bogor Outer Ring Road (BORR) using AIMSUN software,
b.Simulating the bus flow from the planned new bus station in Tanah Baru, Bogor Utara, and analyzing its impact to the BORR network,
c.Analyzing the performance of the BORR before and after the planned bus station, in term of speed, queue length, and travel time,
The scopes of this research are as the following:
a.The analysis is focused on the new traffic generation of busses and angkutan kota (local public transport) in the new established bus station. The traffic generation of private vehicles that may occur in the surrounding area of the new bus station are not considered in this research.
b.The counted vehicles are the four wheels (or more) only, as in Indonesian regulation four wheel (or more) vehicles is the vehicle type allowed to enter the toll road,
c.The survey was conducted only in the morning peak hour (06.00-08.00) by using video recorder and some survey forms if necessary.
d.The buses’ flow from the Baranangsiang bus station is not collected from the related representatives, but from real survey by video recording.
e.The transportation simulation model is built by using micro simulation software, TSS AIMSUN version 6.1.
f.The paying method in the toll gate is modeled based on the current real condition in the field, which is one gate receives payment from both directions.
By accomplishing this research, the authors expect some conclusion about the performance of the Bogor Outer Ring Road (BORR), before and after the construction of planned new Bogor bus station. The performance parameters include the density, travel time/speed, and queue length, as obtained from the simulation model in AIMSUN software. Furthermore, this research may be useful for the related representatives in the Bogor city, especially Local Transport Agency of Bogor city, with respect to the plan of the establishment of the new Bogor bus station in the Tanah Baru area.
2 LITERATURE REVIEW
2.1 Toll Road
Toll road is a road designed with some points of controlled vehicle entrances where only some types of vehicles are allowed to enter. Generally, toll road has a similar geometrical characteristic, which means that it has no significant difference of design for several long of its segments. This similar geometrical design (called segment), has different characteristic for intra city and inner city, where the segment for intra city is generally longer compared to the inner city toll road (Department of Public Works, 1997, Kurniadi, 2002).
In the design process of the cross section of a highway, the considered factors are including the volume, character and speed of traffic, and the characteristics of motor vehicles and their operators.
The numbers of lanes are also designed based on the traffic for designed year (Oglesby, 1975; O’Flaherty et.al, 1997)
2.2 Bus Station
The bus station has to be planned to be able to accommodate the travelers, where the construction location of the bus station will influence the whole
Different types of traffic data are needed for different purposes of research. The data can be obtained from the real field survey or secondary data from related representatives. The observation detailed observation data are described in the following chapter IV.
3 THEORETICAL BASE
3.1 The Road Performance Parameter
In this research, the road performance of BORR toll road is analyzed by using the speed, the queue length, and the traffic density as in the following description:
a) Vehicle Speed (km/hour)
The speed value will be obtained from the travel time data which is gathered from the field surveys.
(1)
where: V = Speed (km/hour) ;S = Distance (km); Tt = Travel time (hour)
b) Traffic Density (vehicles / km)
d) Traffic flows (vehicles / hour)
Traffic count data is the most important observations for understanding the state of a traffic system, which should always be expressed as flow rate, i.e. the number of traffic units per unit of time. (NAASRA, 1988)
3.2 Calibration of Simulation Model
The statistical method is used to check the calibration changed value whether it is appropriate or not. The statistical calculation procedures including mean value, standard deviation, and statistical tests which are used in this step are (FHWA US DOT, 2004):
(3)
(4)
(5)
where:
= standard deviation of data in simulation = mean of data in simulation
= t value for normal distribution = the average value of data in simulation
= the number of data in simulation = the value of ith data in simulation
3.3 Validation of Simulation Model
The validation is the post step after the model is good in representing the real world based on the calibration
adjustment. The validation is conducted to ensure the simulation is appropriate and reliable to use, and is the best in representing the real world according to the obtained field data. Based on the FHWA US DOT (2004), the equations of the test in the validation procedures are as follows:
(6)
(7)
The Ttable for the statistical test can be determined
based on the significance level and the number of sample, both for the proposed scenario model data ( ) and validated existing model data ( ).
In the hypothesis test, the significance of the improvement of certain parameter in the new scenario ( ) will be tested. The will be tested, based on the comparison of Tstatistic< -Ttable or Tstatistic>Ttable
4 RESEARCH METHODOLOGY
4.1 Research Location
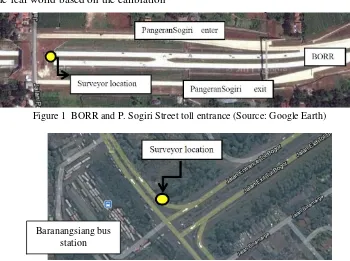
The locations for this research are in two places in the Bogor city, West Java. The traffic survey for the BORR was held in the side of the Pangeran Sogiri toll entrance/exit, while the traffic survey for the Baranangsiang bus station’s travel was held in the Baranangsiang toll road entrance/exit.
The research location of these two areas are shown in Figure 1 and Figure 2.
Figure 1 BORR and P. Sogiri Street toll entrance (Source: Google Earth)
Figure 2 Baranangsiang bus station and Jagorawi toll road entrance/exit (Source: Google Earth) Baranangsiang bus
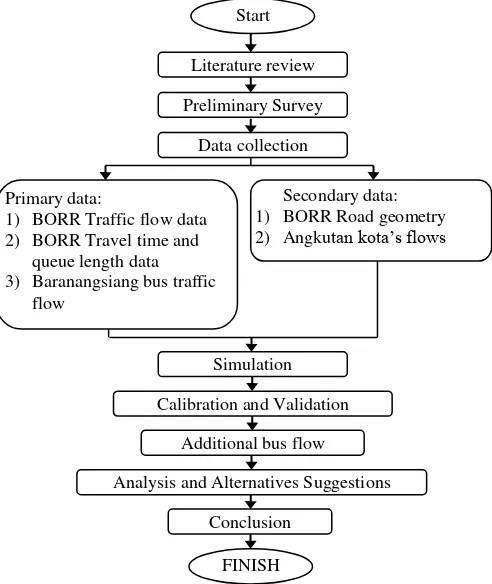
4.2 Research Procedures
The model was built based on the current situation in the real condition, where the additional bus flow was added based on the obtained survey data from the Baranangsiang bus station. The analyses of the new traffic flow in the BORR after the additional bus flow will result in a conclusion about the BORR performance and the Pangeran Sogiri entrance road.
Figure 3 Research Procedures 4.3 Data Collection
The data types and descriptions about the items to be collected are described below:
3) Travel time and queue length c. Secondary Data
1) Traffic flows of Baranangsiang bus station 2) Geometric layout Tools
The tools used in this research are including:
a. Video cameras and additional survey forms for the field observation,
b. AutoCAD for drawing program,
c. Microsoft Office Excel, Word and Access for the data calculation, analysis, and presentation,
d. AIMSUN 6.1 as the main traffic micro-simulation and analysis software.
5 RESULT AND DISCUSSION
5.1 Data Collection
The real traffic flow in the BORR network, coming from two directions (Bogor to Jakarta and Jakarta to Bogor), are collected to develop the simulation in the Aimsun software. The new traffic generation of bus and angkutan kota which will come from the new bus station is generated based on the data from the old Baranangsiang bus station.
The angkutan kota’s flow in the new bus station in
Tanah Baru area is assumed to be the same with the current operating angkutan kota in the Baranangsiang bus station although the new bus station will obviously operate a new origin-destination lane of angkutan kota which needs to be specifically observed in a separate study and research. This simplification is made due to the limitation of time and resources in this study.
5.2 Traffic Micro-Simulation
After the preliminary model is constructed, the traffic flow and vehicles behavior are visually tested in the checking test step. The finished step of error-checking is then followed by the parameters adjustment in the calibration step. The calibration step is conducted to improve the current error-checked model to be as good as possible representing the real traffic condition in the research area.
Table 1 Calculation table of prediction interval of the calibration step validation process. This is the final step to ensure the current model is as close as possible in representing the real condition in the field.
Start
1) BORR Traffic flow data 2) BORR Travel time and
queue length data 2) Angkutan kota’s flows
Analysis and Alternatives Suggestions
Conclusion
Table 2 Calculation table of prediction interval of the representing the real condition in the research location based on the obtained field data observation. From the Table 1 and Table 2, it is shown that the value of the field observation (Measurement 1, 2 and 3) is within the maximum and minimum value of prediction interval of the simulation replications. This result gives the conclusion that the simulation model is good in representing the real traffic condition and ready to be used in the next step of analyzing
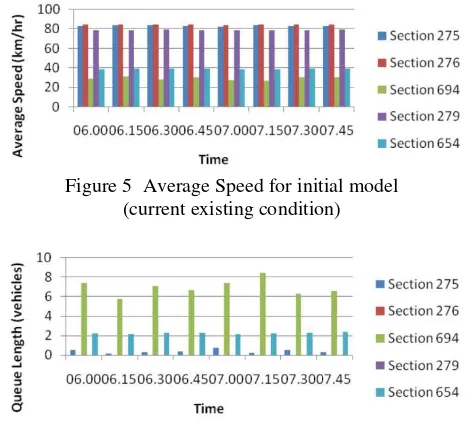
5.3 Initial Model Result
In line with the conclusion that the initial model is good in representing the current condition in the BORR network and P. Sogiri Street, the Figures 4,
Figures 5, and Figures 6 show that the traffic in this
area is considered in a good performance. To identify the real performance of the road network, some considered sections are become the focus in this analysis that are including:
a. Section 275, is the section direction to Jakarta, near P. Sogiri street
b. Section 276, is the section direction to Jakarta, approaching toll gate
c. Section 694, is the section direction to Jakarta, in front of the toll gate
d. Section 279, is the section direction to Bogor, approaching the toll gate
e. Section 654, is the section direction to Bogor, in front of the toll gate.
Figure 5 Average Speed for initial model (current existing condition)
Figure 6 Vehicles queue length for initial model (current condition)
The current traffic condition in the observation area (the BORR network and the P. Sogiri Street) is considered in a good or in ideal performance since the maximum queue length are 8 vehicles, the average speed is approximately 80km/hours and the density is averagely 6 veh/km/lane, except for the paying toll is applied in the Aimsun simulation model.
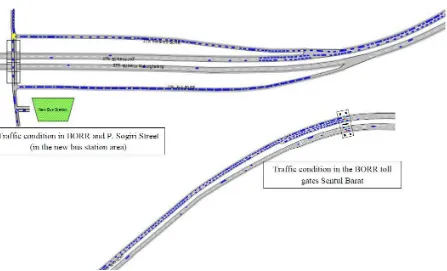
The new bus station comes with the entrance and exit road of the bus and angkutan kota in the P. Sogiri Street as shown in the Figure 7. The limited available toll gate which is only one, forcing the vehicles from P. Sogiri Street to enter and pay the toll in the Sentul Barat direction and turn back in Sentul Selatan area as described in the figure. After the new traffic of bus and angkutan kota is generated in the BORR network, the traffic in this area is totally jammed. In the early morning with the assumption of the buses and angkutan kota are start operating at 06.00, the traffic density is rapidly raising.
condition is understandable since in the current real observation area, the P. Sogiri Street width is only 4.4 meters, which is almost impossible for busses to
operate in two way direction roads in this area, while the busses width in Aimsun are defined randomly from 1.9 meters until 3 meters
Figure 7 The new bus station with the enter/exit access, and the traffic flows direction in the BORR network
5.5 Proposed Problem Solving Scenarios
With respect to the findings obtained from the previous chapter, three scenarios are proposed as following descriptions:
(1) Scenario 1
a. Widening P. Sogiri Street
The current P. Sogiri Street width which is averagely 2.2 meters per lane or 4.4 meters of total road width is improved to become 3.8 meters per lane and total 7.6 meters in 2 lanes of road.
b. Provide 4-4 gates in Sentul Barat toll gates Provide additional 1 road lane and toll gate in the BORR for Bogor-Jakarta direction, and 1 for Jakarta-Bogor direction so the total road lanes and payment gates will be 4-4. By providing these 4-4 gates, the paying queue length in Sentul Barat is expected to decrease and therefore, the total vehicles queue and density in the section 654 and 275 will decrease.
(2) Scenario 2
a. Widening P. Sogiri Street
Similar to the Scenario 1, the current P. Sogiri Street width which is averagely 2.2 meters per lane or 4.4 meters of total road width is improved to become 3.8 meters per lane and total 7.6 meters in 2 lanes of road.
b. Provide 5-3 gates in Sentul Barat toll gates The Scenario 1 results that still show the high vehicles queue in the paying toll gates of Bogor-Jakarta direction becomes the base consideration of providing 1 more gate in this direction. However, Scenario 1 also gives the result of low vehicles queue in the Jakarta-Bogor payment direction, and these 4 gates seem too many or inefficient compared to the number of passing vehicles. Therefore, the Jakarta-Bogor direction gates are set to remains 3 gates as in the previous condition.
(3) Scenario 3
a. Widening P. Sogiri Street
Similar to the Scenario 1 and 2, the current P. Sogiri Street width is improved to become 3.8 meters per lane but the number of lane is also added to become 4 lanes. These additional lanes are provided regarding the probable increase number of vehicles coming from the new access of BORR and the fact that the exit BORR section (section 278) is very high in the queue length value. The new access of BORR is as described in the point 2 of this scenario below.
b. Provide additional access in P. Sogiri Street to BORR from/to Bogor direction
The first and the second scenario which show the insignificant traffic density reduction and the high total travel time of the vehicles, become the base consideration in proposing this new access. With the exit and enter toll gate in the P. Sogiri Street, the bus, angkutan kota and the private vehicles are expected to
leave the BORR network quickly and efficiently, and the BORR density are able to be decreased rapidly.
c. Provide 4-3 gates in Sentul Barat toll gates The additional access to the BORR as in the point 2 above is expected to give the advantages in the BORR traffic flow, in terms of quickly reducing the traffic density. Therefore, the toll gates in Bogor-Jakarta direction are set to remains 4, and Jakarta-Bogor set to 3, so the number of gates and lanes in the Sentul Barat is 4-3.
Figure 9 The average traffic density comparison in every section
Figure 10 The average speed comparison in every section
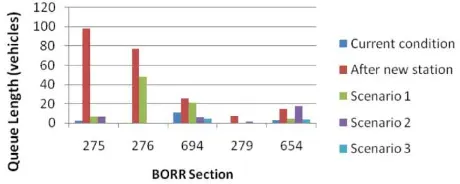
Figure 11 The average queue length comparison in every section
6 CONCLUSION AND RECOMMENDATION
6.1 Conclusion
With respect to the analysis results obtained in this study, some conclusions can be presented as following descriptions:
a. Currently, the traffic condition in the BORR network is in a good performance referring to the average traffic density (7,9 vehicles/km/lane), the high travel speed (63 km/hour), and very low queue length (averagely 0 vehicles).
is in the Pangeran Sogiri Street area beside the BORR network, the traffic performance in the BORR network and P. Sogiri Street will be directly affected.
c. With the assumption of the same amount of relocated bus and angkutan kota, the bus station relocation will produce a large number of new traffic generation and significantly reduce the traffic performance in the BORR network and P.
e. The proposed Scenario 1, which is widening the P. Sogiri Street and building additional 1 lane (with toll payment gate) for Bogor to Jakarta and Jakarta to Bogor direction (so the gates become 4 in and 4 out) will improve the BORR network performance. The density, speed and queue length for Bogor to Jakarta direction still high by 248%, -70%, and 95% respectively, compared to the before the relocation.
f. The proposed Scenario 2, which is the same with the scenario 1 with the difference is the number of lanes and gates (become 5 out, 3 in), the density, speed and queue length will still high by 132%, -54%, and 200% compared to the before the relocation.
g. The proposed Scenario 3, which the main purpose is efficiently move as soon as possible the large number of traffic flow from the BORR network to the P. Sogiri Street and to the Bogor/Jakarta direction, are able to significantly improve the overall traffic performance in the observation road network. With this scenario, the after relocation traffic performance in terms of density, speed and queue, will be relatively the same compared to the current condition.
6.2 Recommendation
Regarding to the findings and obtained results of traffic simulation of the BORR network and the new planned bus station, and regarding the difficulties that the researcher experience, some recommendation are proposed as follows:
a. If the planned relocation of the Baranangsiang bus station to the Tanah Baru area as studied in this research is realized, regarding the traffic performance aspect, it is important to improve the current P. Sogiri Street, the BORR toll payment gates system, and the access system from the P. Sogiri Street to the BORR. The proposed Scenario
no 3 as described in the analyses of this study is expected to be able to solve the traffic problem that will occurs in this condition.
b. This study of simulation is conducted based on the traffic flows data of Baranangsiang station’s bus flow from the morning peak hour survey, and from the related representative data of angkutan kota. A
detailed further study of angkutan kota’s origin and
destination (OD) in the new planned bus station scenario which mainly provide the new access (and payment gates) in the P. Sogiri street to the Bogor direction are considered the best scenario,
e. A further benefit and cost ratio study, including the economic and social aspect might need to conduct to ensure the best alternative in the bus station relocation problem that occurs.
REFERENCES
Chu, Lianyu, et al. (2004). A Calibration Procedure for Microscopic Traffic Simulation. 2004 TRB Annual Meeting, California, U.S.
Department of Public Works. (1997). Manual Kapasitas Jalan Indonesia. Jakarta, Indonesia.
Federal Highway Administration US Department of Transportation (FHWA). (2004). Traffic Analysis Toolbox Volume III: Guidelines for Applying Traffic Micro simulation Modelling Software. Washington DC, U.S.
Kurniadi, Boris. (2002). Analisis Kemampuan Pelayanan Jalan Tol dengan Optimasi Jumlah Pintu Tol (Studi Kasus Jalan Tol Semarang).MSTT, GadjahMada University. Yogyakarta, Indonesia.
Ilyas, Asep. (2009). The Analysis of Sudirman Bus Station Performance in Sukabumi West Java. MSTT, GadjahMada University – Asian Institute of Technology. Yogyakarta, Indonesia.
Oglesby, Clarkson Hill. (1975). Highway Engineering. John Wiley & Sons, Inc. Canada.
O’Flaherty, C.A., Bell, M.G.H, Bonsall, P.W., Leake,
G.R, May, A.D., Nash, C.A. (1997). Transport Planning and Traffic Engineering. John Wiley & Sons, Inc. New York.
Park, Byungkyu, Ph.D. (2006). Tutorial of Microscopic Traffic Simulation Model Calibration and Validation. University of Virginia, US.
Transport Simulation System (TSS). (2010). Aimsun 6.1 Users Manual.TSS, Barcelona, Spain.
Transport Simulation System (TSS). (2010).Microsimulator and Mesosimulator Aimsun 6.1.TSS, Barcelona, Spain.