PDBe: Protein Data Bank in Europe
S. Velankar, Y. Alhroub, C. Best, S. Caboche, M. J. Conroy, J. M. Dana,
M. A. Fernandez Montecelo, G. van Ginkel, A. Golovin, S. P. Gore, A. Gutmanas,
P. Haslam, P. M. S. Hendrickx, E. Heuson, M. Hirshberg, M. John, I. Lagerstedt, S. Mir,
L. E. Newman, T. J. Oldfield, A. Patwardhan, L. Rinaldi, G. Sahni, E. Sanz-Garcı´a,
S. Sen, R. Slowley, A. Suarez-Uruena, G. J. Swaminathan, M. F. Symmons,
W. F. Vranken, M. Wainwright and G. J. Kleywegt*
Protein Data Bank in Europe, EMBL-EBI, Wellcome Trust Genome Campus, Hinxton, Cambridge CB10 1SD, UK
Received September 23, 2011; Accepted October 18, 2011
ABSTRACT
The Protein Data Bank in Europe (PDBe; pdbe.org) is a partner in the Worldwide PDB organization (wwPDB; wwpdb.org) and as such actively involved in managing the single global archive of biomacro-molecular structure data, the PDB. In addition, PDBe develops tools, services and resources to make structure-related data more accessible to the bio-medical community. Here we describe recently developed, extended or improved services, includ-ing an animated structure-presentation widget (PDBportfolio), a widget to graphically display the coverage of any UniProt sequence in the PDB
(UniPDB), chemistry- and taxonomy-based
PDB-archive browsers (PDBeXplore), and a tool for interactive visualization of NMR structures, corres-ponding experimental data as well as validation and analysis results (Vivaldi).
INTRODUCTION
Since the early 1970s, the Protein Data Bank (PDB) has been the single global archive in which 3D structure infor-mation about biomacromolecules (including complexes) is archived (1,2). Since 2003, the PDB archive has been managed by an international organization called the Worldwide PDB (wwPDB; wwpdb.org) (3,4). It consists of the Research Collaboratory for Structural Bioinformatics (RCSB) (5) and the BioMagResBank (BMRB) (6) in the USA, the Protein Data Bank Japan (PDBj) (7) and the Protein Data Bank in Europe (PDBe; pdbe.org) (8,9). The four wwPDB partners accept and process depositions of new structures and supporting ex-perimental data and jointly curate, remediate and
distribute the PDB archive. They also work together (often in consultation with the community) to define de-position and annotation policies and procedures, file formats, descriptions of chemical compounds and polymer components, and validation standards for struc-tural data. In addition, each of the partners offers inde-pendent services to users of structural information. PDBe aims to develop tools, services and resources that help make the wealth of data about biomacromolecular struc-ture and function more easily accessible to the wider bio-medical community (10). Many of these tools have been described recently (8,9). In this article, we briefly describe several recently developed or enhanced services provided by PDBe.
PDBportfolio: HIGHLIGHTING SALIENT FEATURES OF A PDB ENTRY
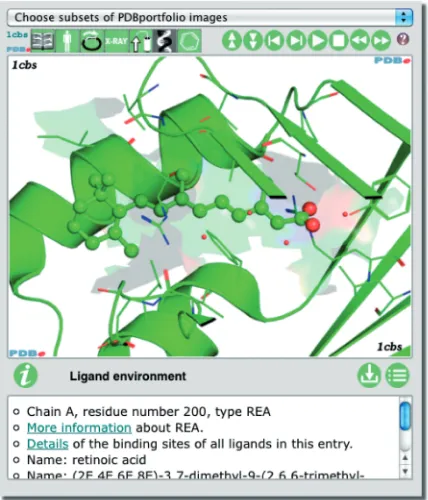
In order to convey salient features and annotation in the context of 3D structure, PDBe has de-veloped an animated widget called PDBportfolio (pdbe.org/portfolio), Figure 1. It presents a slide show of images that convey important information and value-added annotation about a selected PDB entry or entries. The legend of each image contains more details as well as links to relevant web pages at PDBe or external resources. The slide show covers:
. Quaternary structure—the largest assembly identified by the depositors or PISA (11).
. Deposited model—a cartoon and a surface representa-tion are shown separately. The cartoon is coloured by polymer chain and shown with non-polymeric entities as space-filling (CPK) models. The surface is coloured by atomic properties using some simple rules as defined in PyMol (pymol.org) (12). In the case of
*To whom correspondence should be addressed. Tel: +44 1223 492698; Fax: +44 1223 494487; Email: [email protected]
Published online 21 November 2011 Nucleic Acids Research, 2012, Vol. 40, Database issue D445–D452
doi:10.1093/nar/gkr998
ßThe Author(s) 2011. Published by Oxford University Press.
protein–DNA/RNA complexes, the image shows only the protein surface for clarity.
. Domain structure—separate images show SCOP (13), CATH (14) and Pfam (15) domains as annotated by the SIFTS resource (16). Each domain is highlighted using a coloured cartoon and its boundaries are further highlighted by a semi-transparent surface of the same colour. Different surface styles are used to dis-tinguish multiple occurrences of the same domain type.
. Ligands—the binding environment of at most three bound chemical compounds is shown. Compounds that are most likely crystallization agents (such as glycerol) are ignored.
. Experiment-dependent information—for X-ray crystal structures, temperature-factor information is shown on the structure and red surface patches indicate where crystal contacts occur. For NMR entries, the entire ensemble of models is shown. For 3DEM entries, the
Figure 1. The PDBportfolio widget provides images and annotation about important aspects of one or more PDB entries, including the quaternary structure, domains and bound ligands. Refer to the text and pdbe.org/portfolio for more information, or see pdbe.org/1fcc for a live animated example.
EMDB (17,18) map is shown if available, with the PDB entry fitted into it.
PDBportfolio is used to display information about every PDB entry on its PDBe Atlas page (e.g. pdbe.org/ 1cbs). The widget can also be used freely in external web pages to convey key information about one or more PDB entries. The control buttons on the interface allow users to manipulate the slide show. They may also download an archive with all the PDBportfolio images of an entry (as well as the PyMol scripts used to generate them), or view all images and legends in one web page.
UniPDB: UniProt-PDB SEQUENCE COVERAGE
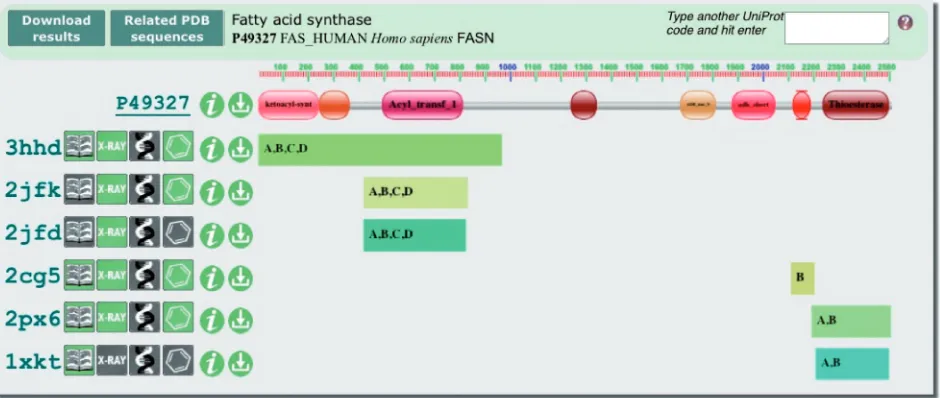
UniPDB is a widget that provides a graphical display of the sequence coverage in the PDB of any UniProt (19) entry (pdbe.org/unipdb), Figure 2. Proteins encountered in PDB entries may contain partial sequences (e.g. one or more stably folded domains), chimeric sequences, fusions with other proteins and all manner of modifications to the wild-type sequence. Some modifications occur naturally, whereas others are introduced by experimenters to facili-tate purification or crystallization, or to allow investiga-tion of the effect of a mutainvestiga-tion on the behaviour of the protein (such as catalytic activity or ligand-binding speci-ficity). In addition, the structure of a protein may have been determined many times, e.g. in different laboratories, using different techniques, under different conditions, or in complex with different ligands or other biomacromolecules. UniPDB provides an intuitive, graph-ical overview of the structural information available for a particular UniProt entry, based on mapping data provided by the SIFTS resource (16). It also provides annotation of the Pfam (15) domains occurring in the sequence.
For every PDB entry that contains (a part of) the select UniProt sequence, PDBlogos (9) instantly reveal if it is an X-ray, NMR or EM structure, if it contains DNA or ligands, etc. From the UniPDB widget, a FASTA search of the PDB for related sequences can be launched; the results of this search are presented in the PDBeXplore browser (9).
PDBeXpress: PDB ANALYSIS TOOLS
PDBeXpress (pdbe.org/express) is an umbrella name for a collection of easy-to-use and powerful PDB analysis tools. Most of these use the PDBeMotif (20) web service as the underlying tool, while others access the PDBe search database directly. At present, there are two PDBeXpress modules in production and several others are under devel-opment. The first two modules can be used to answer the following common questions:
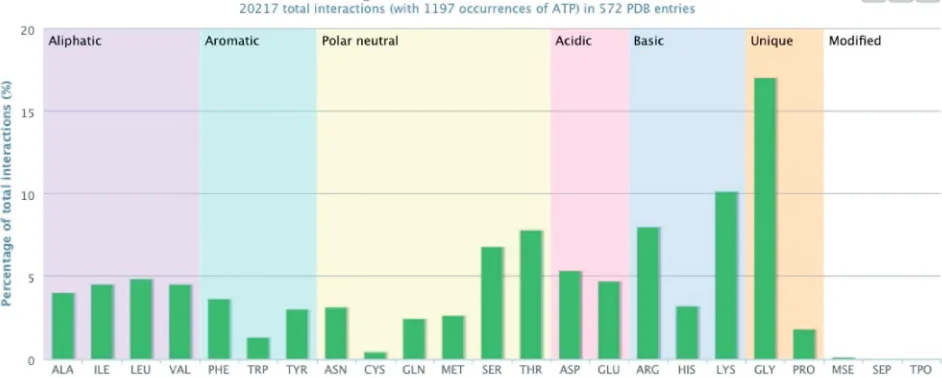
. What residues are found in the binding sites of a given compound? Using PDBeMotif, PDBeXpress retrieves the residues with which a ligand interacts as observed in current PDB entries. A ligand can be selected by providing its name or three-character PDB identifier. The results are presented as a graph that shows the relative occurrence of the amino acids in the binding sites of the compound (extracted from the PDBeMotif database), Figure 3. There are options to view the PDB entries in which these inter-actions occur, or to perform further analyses using PDBeMotif. The graphs and the data can be downloaded.
. What compounds are known to bind a given set of residues? PDBeMotif is used to retrieve all ligands observed in the PDB to interact with a given set of amino acids and the results are again shown in an
Figure 2. The UniPDB widget provides a graphical overview of the sequence coverage of any UniProt entry in the PDB. This example (pdbe.org/ unipdb?uniprot=FAS_HUMAN) shows the domain architecture of human fatty acid synthase (FAS), a multi-enzyme assembly line of fatty acids. Pfam identifies eight domains in human FAS, five of which have structural coverage in the PDB. Salient features of the relevant PDB entries are depicted using PDBlogos. Refer to the text and pdbe.org/unipdb for more information.
interactive graph. This tool can be used to generate hypotheses about the type of compounds that could conceivably bind in a pocket or cavity, given the nature of the residues that line it.
EM-RELATED RESOURCES
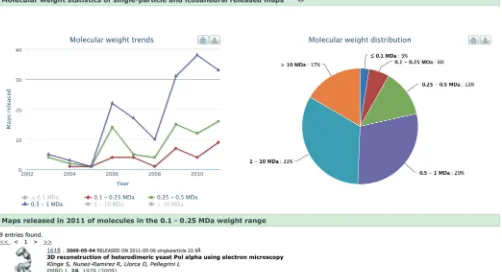
The Electron Microscopy Data Bank (EMDB) was estab-lished at the EBI in 2002 (17) and is now managed and developed in collaboration with the RCSB and Baylor College of Medicine (18). In addition to the joint EMDB portal (EMDataBank.org), there are some EM-related resources at PDBe as well, which have recently been reorganized, restyled and expanded (pdbe.org/ emdb). The data held in EMDB constitute a treasure trove of information on the state of, and trends in, the 3DEM field. Examples of interesting information that can be mined from the archive include trends in the reso-lution of EM studies and the size of the structures that have been deposited. Specialist users may also be inter-ested in comparisons of the relative popularity of micro-scopes and software packages. EMstats (pdbe.org/ emstats) is a new service that mines the database for such information and presents the results as interactive charts that are generated dynamically and represent the current state of the information in the database. The graphical elements of the charts (pie diagrams, histo-grams, etc.) are active, which means that clicking on them results in a query to the database, the results of which are shown below the chart,Figure 4.
NMR-RELATED RESOURCES
PDBe provides a variety of NMR-related data to the sci-entific community (pdbe.org/nmr) (8,9). A statistics page
listing the number of NMR entries in the PDB for which additional information is held at PDBe or elsewhere is now available and updated weekly. In the past year, we have added access to the logRECOORD database (22) that contains recalculated structures (using a log-normal potential for interpreting NOEs) for more than 300 NMR entries in the PDB.
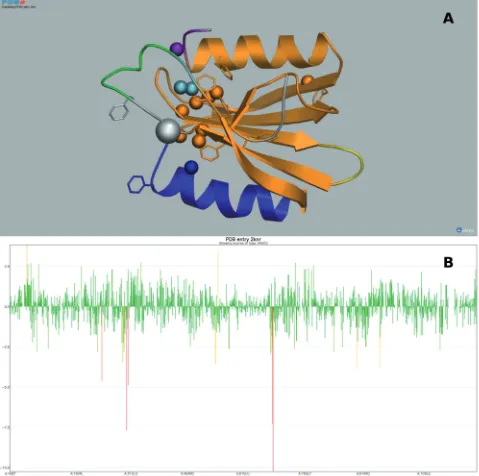
Vivaldi (Hendrickxet al., manuscript in preparation) is an interactive graphical web tool aimed at both expert and non-expert users of NMR structural data (pdbe.org/ vivaldi),Figure 5. It allows visualization of NMR ensem-bles and individual structures together with associated ex-perimental data (such as chemical shifts, distance restraints and residual dipolar couplings, RDCs) and derived validation-related information. The latter is partly generated using the PDBe services OLDERADO (23) and VASCO (24) and partly extracted from the external NRG-CING database (nmr.cmbi.ru.nl/ NRG-CING). Vivaldi uses the OpenAstexViewer (25) to present 3D displays of one or more models from the ensemble, Figure 5A. By default, the most representative model as identified by OLDERADO is shown. A separate interactive 1D graph displays any of a variety of valid-ation scores or counts, such as the number of distance-restraint violations per residue, deviations of the chemical shift values from statistical averages as reported by VASCO,Figure 5B, or the fit between calculated and de-posited RDCs. The 1D and 3D displays are coupled, which means that analysis and validation results can be inspected simultaneously as a function of residue number and in the context of the 3D model. Both the 3D structure views and the 1D graphs can be saved as high-resolution images for use in publications or presentations. In addition, an information panel offers explanations of the different views in plain English text as well as detailed residue-specific information. Vivaldi also has a user-friendly ‘wizard’ option to help users obtain a particular
Figure 3. PDBeXpress (pdbe.org/express) can be used to find out which residues are observed to interact with a certain ligand in entries in the PDB. The graph shown here is for ATP and shows a preponderance of Gly, Lys, Ser and Thr residues, as expected in the Walker ATP-binding motif (21). The graph also shows other commonly observed residues in ATP binding sites such as Arg, Asp and Glu.
view, subject to data availability. Some of these views are also accessible directly from the PDBe Atlas pages of NMR entries as well as from OLDERADO and VASCO report pages.
OTHER NEW OR IMPROVED SERVICES
Chemistry and taxonomy-based structure browsers
PDBeXplore (pdbe.org/explore) is a browsing interface for retrieving and analysing information on subsets of structures in the PDB using various biological and chemical classifications (9). Previously released PDBeXplore modules enable browsing of the contents of the PDB based on Enzyme Class (26) (pdbe.org/ec), CATH domains (14) (pdbe.org/cath), Pfam families (15) (pdbe.org/pfam) or FASTA-based (27) sequence-similarity searches (pdbe.org/fasta). These browser modules retrieve results much faster than before and they have all been updated to include clickable pie charts that allow further refinement of the queries. In addition, two new browser modules have been released. A chemistry-based module (pdbe.org/compounds) enables analysis of all PDB entries that contain a chemical compound, while a taxonomy-based module (pdbe.org/ taxonomy) allows users to retrieve and analyse all protein structures in the PDB for any taxonomy level. Taxonomy information is taken from the well-established
NCBI taxonomy database (28,29). The browser module also provides easy access to the top 15 species present in the largest number of PDB entries.
Atlas entry pages
PDBe Atlas pages provide a summary of a PDB entry in a user-friendly lay-out and serve as a starting point for further exploration of sequence, structure, chemistry and function information related to that entry. The summary Atlas pages have been improved with several ‘action buttons’ that allow one-click access to commonly used functionality [e.g. downloading the PDB file, viewing the structure in 3D, launching PDBeFold (30) to find similar structures in the PDB, or accessing the PISA (11) results]. The summary Atlas pages now also contain a table that lists all UniProt entries contained in the entry and action buttons to launch either a sequence search of the entire PDB or the UniPDB widget (see above) for each of these UniProt entries. The ligand Atlas pages now provide links to the ChEMBL (bioactivity data; https://www.ebi.ac.uk/ chembldb/) (31) and ChEBI (chemical annotation; www. ebi.ac.uk/chebi/) (32) resources at the EBI. Finally, the experiment-related Atlas pages for NMR entries now contain links to any NMR-related resources at PDBe and BMRB as well as to the Vivaldi viewer for interactive analysis of the structure in the light of experimental and validation-related data (see above).
Figure 4. Molecular weight (MW) distribution and MW trends of the assemblies (single-particle and icosahedral) whose EM maps have been deposited in the EMDB archive, as generated with EMstats (pdbe.org/emstats). The distribution chart shows that only 22% of the studies are of assemblies with MW<0.5 MDa. This is a consequence of the technical difficulties encountered when using the single-particle technique to study
low-molecular-weight molecules or complexes. However, the trend charts show that the number of such studies is gradually increasing, which suggests that the field is learning how to overcome the experimental difficulties.
Miscellaneous features
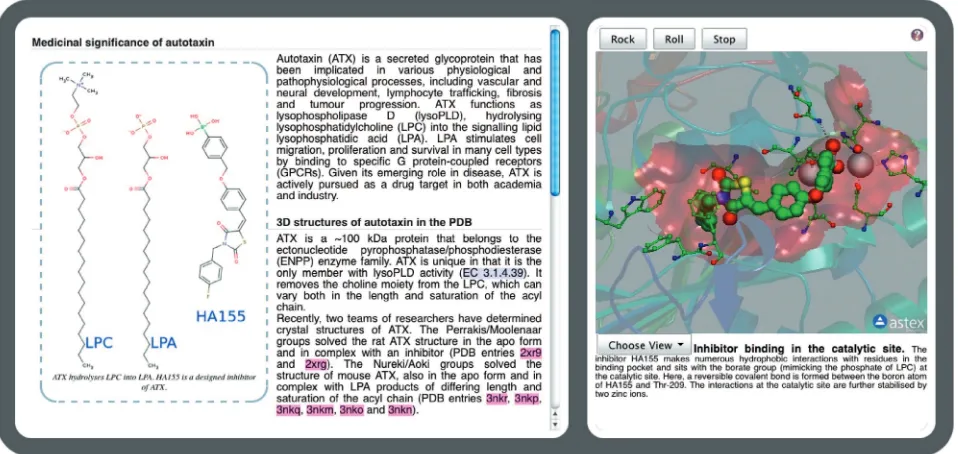
Quips (‘Quite Interesting Pdb Structures’; pdbe.org/quips) are short stories about one or more interesting or topical structures, coupled with an interactive viewer and, often, a tutorial that allows the reader to carry out more detailed
exploration of a structure using PDBe resources,Figure 6. The interactive structure displays comprise a number of predefined (often animated) views to highlight concepts explained in the text. The tutorials assume that the reader has a background in biology, chemistry or medicine and an interest in proteins, nucleic acids and
Figure 5. Use of Vivaldi to display and analyse PDB data about NMR entries [in this example, entry 2KNR which has been discussed by Lemak
et al.(33): pdbe.org/vivaldi/2knr]. (A) Results of OLDERADO (22) and VASCO (23) analysis of the 2KNR ensemble presented in a 3D structure display. OLDERADO clusters the members of an ensemble of NMR models. The representative model of the largest cluster is shown as a cartoon. The colouring of the models signifies the various structural domains indentified by OLDERADO. This analysis indicates that while the central
b-sheet and the N-terminal a-helix (all in orange) are rigid with respect to each other, the seconda-helix (blue) forms a separate rigid body or ‘domain’. Atoms with unusual chemical shifts as identified by VASCO are shown as van der Waals spheres. In addition, aromatic residues are shown as sticks. This structure exhibits a number of chemical shift outliers that cluster together. However, many of these outliers are near aromatic rings, which are known to strongly affect the chemical shifts values of neighbouring atoms due to ring currents. (B) 1D graph of the deviation of chemical shift values from statistical averages as judged by VASCO as a function of residue number. The height and colour of the bars convey the extent of the deviation. This graph shows that most deviations are within usual bounds (green), but some of the outliers (yellow and red) are severe (up to 10 SD) and require a plausible explanation, such as the presence of a nearby aromatic ring.
ligand interactions. New Quips articles are added about once a month.
PDB highlights pages (pdbe.org/highlights) reveal PDB entries that are extreme in one sense or another, such as their age, their resolution, the number or length of the macromolecules contained in them, etc. Extreme entries can be listed separately for X-ray, NMR and EM struc-tures or for the entire PDB archive.
Weekly updates of the PDB and EMDB archives can be monitored conveniently at pdbe.org/latest. This service provides lists of new, modified and removed PDB entries, of new and modified chemical compounds in the PDB, and of newly released and modified EMDB maps or summary files (‘headers’). Every entry is shown in a panel with core information and an image; the panels can be expanded to reveal more information as well as action buttons to access commonly used services or files. Result lists can be downloaded as easily parsable text files, and new RSS feeds provide similar information (see pdbe.org/ rss for a list of available feeds).
ACKNOWLEDGEMENTS
The authors wish to thank all collaborators and partners in the EBI, EMBL, wwPDB, EMDB, BMRB, CCPN, CCP4, CCDC and other collaborative efforts, as well as the structural biology community for depositing its struc-tures and experimental data in the PDB, BMRB and EMDB.
FUNDING
European Molecular Biology Laboratory (EMBL); Wellcome Trust (grant number 088944); European
Union (226073); UK Biotechnology and Biological Sciences Research Council (BB/G022577/1 and BB/ E007511/1); the National Institutes of Health (R01GM079429-01A1). Funding for open access charge: The Wellcome Trust.
Conflict of interest statement. None declared.
REFERENCES
1. Bernstein,F.C., Koetzle,T.F., Williams,G.J., Meyer,E.F. Jr, Brice,M.D., Rodgers,J.R., Kennard,O., Shimanouchi,T. and Tasumi,M. (1977) The Protein Data Bank: a computer-based archival file for macromolecular structures.J. Mol. Biol.,112, 535–542.
2. Berman,H.M. (2008) The Protein Data Bank: a historical perspective.Acta Crystallogr.,A64, 88–95.
3. Berman,H., Henrick,K. and Nakamura,H. (2003) Announcing the worldwide Protein Data Bank.Nat. Struct. Biol.,10, 980. 4. Berman,H., Henrick,K., Nakamura,H. and Markley,J.L. (2007)
The worldwide Protein Data Bank (wwPDB): ensuring a single, uniform archive of PDB data.Nucleic Acids Res.,35,
D301–D303.
5. Rose,P.W., Beran,B., Bi,C., Bluhm,W.F., Dimitropoulos,D., GoodsellD,S., Prlic,A., Quesada,M., Quinn,G.B., Westbrook,J.D.
et al. (2011) The RCSB Protein Data Bank: redesigned web site and web services.Nucleic Acids Res.,39, D392–D401.
6. Ulrich,E.L., Akutsu,H., Doreleijers,J.F., Harano,Y.,
Ioannidis,Y.E., Lin,J., Livny,M., Mading,S., Maziuk,D., Miller,Z.
et al. (2008) BioMagResBank.Nucleic Acids Res.,36, D402–D408.
7. Kinjo,A.R., Suzuki,H., Yamashita,R., Ikegawa,I., Kudou,T., Igarashi,R., Kengaku,Y., Cho,H., Standley,D.M., Nakagawa,A.
et al. (2011) Protein Data Bank Japan (PDBj): maintaining a structural data archive and resource description framework format.Nucleic Acids Res.,40, D453–D460.
8. Velankar,S., Best,C., Beuth,B., Boutselakis,C.H., Cobley,N., Sousa Da Silva,A.W., Dimitropoulos,D., Golovin,A.,
Figure 6. Quips (pdbe.org/quips) is an interactive medium to develop stories about biomacromolecular structures. A Quips article contains links that activate the OpenAstexViewer applet to highlight and animate important facets of 3D structures. The text contains marked-up links to relevant literature, PDB entries, ligands, glossary terms, tutorials, further exploration options, etc. The example shown here (pdbe.org/ quips?story=Autotaxin) accompanies a review on autotaxin structure and function (34). The review along with the interactive Quips provides users with better understanding of the topic when compared to static images.
Hirshberg,M., John,M.et al. (2010) PDBe: Protein Data Bank in Europe.Nucleic Acids Res.,38, D308–D317.
9. Velankar,S., Alhroub,Y., Alili,A., Best,C., Boutselakis,H.C., Caboche,S., Conroy,M.J., Dana,J.M., van Ginkel,G., Golovin,A.
et al. (2011) PDBe: Protein Data Bank in Europe.Nucleic Acids Res.,39, D402–D410.
10. Velankar,S. and Kleywegt,G.J. (2011) The Protein Data Bank in Europe (PDBe): bringing structure to biology.Acta Crystallogr.,
D67, 324–330.
11. Krissinel,E. and Henrick,K. (2007) Inference of macromolecular assemblies from crystalline state.J. Mol. Biol.,372, 774–797. 12. The PyMOL Molecular Graphics System, Version 1.3,
Schro¨dinger, LLC.
13. Andreeva,A., Howorth,D., Chandonia,J.M., Brenner,S.E., Hubbard,T.J., Chothia,C. and Murzin,A.G. (2008) Data growth and its impact on the SCOP database: new developments.
Nucleic Acids Res.,36, D419–D425.
14. Cuff,A.L., Sillitoe,I., Lewis,T., Clegg,A.B., Rentzsch,R., Furnham,N., Pellegrini-Calace,M., Jones,D., Thornton,J. and Orengo,C.A. (2011) Extending CATH: increasing coverage of the protein structure universe and linking structure with function.
Nucleic Acids Res.,39, D420–D426.
15. Finn,R.D., Mistry,J., Tate,J., Coggill,P.C., Heger,A., Pollington,J.E., Gavin,O.L., Gunesekaran,P., Ceric,G., Forslund,K.et al. (2010) The Pfam protein families database.
Nucleic Acids Res.,38, D211–D222.
16. Velankar,S., McNeil,P., Mittard-Runte,V., Suarez,A., Barrell,D., Apweiler,R. and Henrick,K. (2005) E-MSD: an integrated data resource for bioinformatics.Nucleic Acids Res.,33, D262–D265. 17. Tagari,M., Newman,R., Chagoyen,M., Carazo,J. and Henrick,K.
(2002) New electron microscopy database and deposition system.
Trends Biochem. Sci.,27, 589.
18. Lawson,C.L., Baker,M.L., Best,C., Bi,C., Dougherty,M., Feng,P., van Ginkel,G., Devkota,B., Lagerstedt,I., Ludtke,S.J.et al. (2011) EMDataBank.org: unified data resource for CryoEM.Nucleic Acids Res.,39, D456–D464.
19. UniProt Consortium. (2011) Ongoing and future developments at the Universal Protein Resource.Nucleic Acids Res.,39, D214–D219.
20. Golovin,A. and Henrick,K. (2008) MSDmotif: exploring protein sites and motifs.BMC Bioinformatics,9, 312.
21. Walker,J.E., Saraste,M., Runswick,M.J. and Gay,N.J. (1982) Distantly related sequences in the alpha- and beta-subunits of ATP synthase, myosin, kinases and other ATP-requiring enzymes and a common nucleotide binding fold.EMBO J.,1, 945–951.
22. Bernard,A., Vranken,W.F., Bardiaux,B., Nilges,M. and Malliavin,T.E. (2011) Bayesian estimation of NMR restraint potential and weight: A validation on a representative set of protein structures.Proteins,79, 1525–1537.
23. Kelley,L.A. and Sutcliffe,M.J. (1997) OLDERADO: on-line database of ensemble representatives and domains. On Line Database of Ensemble Representatives And DOmains.
Protein Sci.,6, 2628–2630.
24. Rieping,W. and Vranken,W.F. (2010) Validation of archived chemical shifts through atomic coordinates.Proteins,78, 2482–2489.
25. Hartshorn,M.J. (2002) AstexViewer: a visualisation aid for structure-based drug design.J. Comput. Aided Mol. Des.,16, 871–881.
26. Enzyme Nomenclature 1992 [Academic Press, San Diego, California, ISBN 0-12-227164-5 (hardback), 0-12-227165-3 (paperback)]. This supplement is as close as possible to the published version [seeEur. J. Biochem., 1999,264, 610–650]. 27. Lipman,D.J. and Pearson,W.R. (1985) Rapid and sensitive
protein similarity searches.Science,227, 1435–1441.
28. Sayers,E.W., Barrett,T., Benson,D.A., Bryant,S.H., Canese,K., Chetvernin,V., Church,D.M., DiCuccio,M., Edgar,R., Federhen,S.
et al. (2009) Database resources of the National Center for Biotechnology Information.Nucleic Acids Res.,37, D5–D15. 29. Benson,D.A., Karsch-Mizrachi,I., Lipman,D.J., Ostell,J. and
Sayers,E.W. (2009) GenBank.Nucleic Acids Res.,37, D26–D31. 30. Krissinel,E. and Henrick,K. (2004) Secondary-structure matching
(SSM), a new tool for fast protein structure alignment in three dimensions.Acta Crystallogr.,D60, 2256–2268.
31. Gaulton,A., Bellis,L.J., Bento,A.P., Chambers,J., Davies,M., Hersey,A., Light,Y., McGlinchey,S., Michalovich,D., Al-Lazikani,B.et al. (2012) ChEMBL: a large-scale bioactivity database for drug discovery.Nucleic Acids Res.,40, D1100–D1107.
32. De Matos,P., Alcantara,R., Dekker,A., Ennis,M., Hastings,J., Haug,K., Spiteri,I., Turner,S. and Steinbeck,C. (2010) Chemical Entities of Biological Interest: an update.Nucleic Acids Res.,38, D249–D254.
33. Lemak,A., Gutmanas,A., Chitayat,S., Karra,M., Fare`s,C., Sunnerhagen,M. and Arrowsmith,C.H. (2011) A novel strategy for NMR resonance assignment and protein structure determination.J. Biomol. NMR,49, 27–38.
34. Moolenaar,W.H. and Perrakis,A. (2011) Insights into autotaxin: how to produce and present a lipid mediator.Nat. Rev. Mol. Cell Biol.,12, 674–679.