AN
AN
AN
AN IMPROVED
IMPROVED
IMPROVED
IMPROVED HIGH
HIGH
HIGH
HIGH FREQUENCY
FREQUENCY
FREQUENCY
FREQUENCY MODULATING
MODULATING
MODULATING
MODULATING FUSION
FUSION
FUSION
FUSION
METHOD
METHOD
METHOD
METHOD BASED
BASED
BASED
BASED ON
ON
ON
ON MODULATION
MODULATION
MODULATION
MODULATION TRANSFER
TRANSFER
TRANSFER
TRANSFER FUNCTION
FUNCTION
FUNCTION
FUNCTION FFFFILTER
ILTER
ILTER
ILTERSSSS
Jia Yonghong1,2Wu Meng1*Zhang Xiaoping1
(1 School of Remote Sensing and Information Engineering, Wuhan University, 430079, China)
(2 State Key Laboratory for Information Engineering in Surveying, Mapping and Remote Sensing, Wuhan University, 430079, China)
Commission Commission Commission
Commission VVVVIIIII,I,I,I, WGWGWGWG VIVIVIVIIIII////6666
KEY KEY
KEYKEY WORDS:WORDS:WORDS:WORDS: GeoEye-1 image, Resolution degradation, Modulation transfer function, Image fusion.
ABSTRACT: ABSTRACT: ABSTRACT:ABSTRACT:
GeoEye-1 is the most advanced and highest resolution commercial earth imaging satellite in the world today. It provides multispectral images (MS) and Panchromatic image (PAN) with spatial resolutions of 2.0m and 0.5m respectively. Image fusion is very important for mapping and image interpretation because it can take advantage of the complementary spatial/spectral resolution characteristics of remote sensing imagery. So an improved high frequency modulation fusion method based on MTF is proposed. Modulation transfer functions (MTF) are firstly measured from GeoEye-1 images, and then the degraded images based on MTF filters are obtained. Secondly, modulating parameter is obtained based on Minimum Mean Square Error, and image fusion is performed and measured in the degraded version. Finally, fused images with the high spatial resolution are produced by using the proposed method. Compared with fusion methods of weighted high passing filtering(w-HPF) in ERDAS IMAGINE and general image fusion based on MTF( MTF-GIF), The results of fused GeoEye-1 images show that the proposed method is an efficient way for GeoEye-1 image fusion, which can keep spectral information with the high spatial resolution.
1.
1.1.1. INTRODUCTIONINTRODUCTIONINTRODUCTIONINTRODUCTION
With the development of remote sensing, many high resolution satellites, such as Ikonos, Quickbird, Worldview and GeoEye-1 offer high resolution PAN image and low resolution MS images. To meet the user’s need of spectral remote sensing images with high resolution, fusing the high resolution Pan image and the coregistered low resolution MS images is of great significance in theory and application (Chavez et al.,1991). In recent 10 years , a variety of image fusion techniques are devoted to fuse MS and Pan images which exhibit complementary characteristics of spatial and spectral resolutions.Such as hue-intensity-saturation(HIS), principal component analysis(PCA), Brovey transfer(BT), and ratio fusion methods. Multiresolution analysis, based on undecimated wavelet decompositions and Laplacian pyramids, have been proven effective to implement fusion at different resolutions (Aiazzi et al.,2006). However, most of them are data type dependent. For instance, HIS fusion method requires that the images to be fused are in the same spectral domain. Furthermore, this fusion method does not properly preserve the spectral information of the input images because it is mainly concerned with the visual enhancement of the images. High frequency modulation fusion is a useful way in image fusion, which means obtaining the high frequency part of PAN image and putting it into the resampled MS images. But this method still has two issues to be deal with: (1) How to get the high frequency details from the high resolution image; (2) How to put the details into the resampled MS images. It is clear that approaching the optimization problem of High frequency modulation fusion is very attractive (Garzelli et al., 2008).
The goal of this paper is to make the fused bands the most similar to the same spatial resolution as Pan Image. An algorithm of high frequency modulation fusion based on MTF is proposed in the minimum mean square error sense. A modulation transfer function (MTF) is firstly measured from the
satellite image. Secondly, modulating parameter is obtained based on the minimum mean square error, and image fusion is performed and measured in the degraded version. Finally, fused images with the high spatial resolution are produced by using the proposed method.
2. 2. 2.
2. HIGHHIGHHIGHHIGH FREQUENCYFREQUENCYFREQUENCYFREQUENCY MODULATIONMODULATIONMODULATIONMODULATION FUSIONFUSIONFUSIONFUSION METHOD
METHOD METHOD
METHOD BASEDBASEDBASEDBASED ONONONON MTFMTFMTFMTF
High frequency modulation fusion method means the high frequency detail is obtained from the PAN image and put it into the upsampled MS images. The fused lth MS band can be computed as follow(Garzelli et al., 2008):
D
B is the fused image, B~ is the MS image upsampledl
to PAN image resolution,
γ
lis a modulation coefficient,lis the number of the spectral band, D is the high frequency detail from the PAN image.The key to the high frequency modulation fusion method is to design a perfect low-pass filter. Gaussian low-pass filter is generally used to differentiate between the high frequency part and the low frequency part of the high resolution image. For ignoring the spatial imaging features,
γ
l is not the perfectestimation with Gaussian low-pass filter. So the high frequency modulation fusion method based on MTF is proposed.
The process of the proposed fusion method is follow. MTF is firstly measured from the satellite image. Secondly, by assuming that the modulation coefficient is approximately constant across scales, the modulating parameter
γ
l can be replaced byγ
ld . γld is a degraded modulation coefficientis performed and measured in the degraded version. Finally, the same parameters are successively used to perform the injection at full resolution, the fusion image is obtained by high frequency modulated fusion based on equation (1). The key to handle this problem is how to obtain the modulation transform function and the modulation parameter
γ
ld.2.1. 2.1.
2.1.2.1. MeasuringMeasuringMeasuringMeasuring modulationmodulationmodulationmodulation transformtransformtransformtransform functionfunctionfunctionfunction
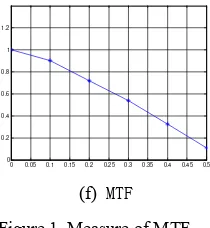
MTF is a spatial frequency response function of a sensor. Considering all the surroundings, MTF of a remote sensor is difficult to obtain. so far MTF is mainly got from the RS image. Here is used edge method to calculate MTFs of different bands. The edge curve from a RS image is firstly selected, then the line spread function (LSF) is got from differentiating edge curve, MTF is obtained by Fourier transform of LSF. In order to obtain precise location of the edge points, the subpixel edge points are fitted with the least square method.
(a) An image
(b) Selected edge image (c) Fitted edge point
-8 -6 -4 -2 0 2 4 6 8 10
(e) Line sprea function
0 0.05 0.1 0.15 0.2 0.25 0.3 0.35 0.4 0.45 0.5
Figure 1.Measure of MTF
Supposing the GeoEye-1 to be invariant system of linear displacement, the filter kernels of different band based on MTF are three-dimensionality shown from figure 2 (a) to figure 2 (d).
-1
(a) The filter kernel of Pan image
-1
(b) The filter kernel of blue band
-1
(c) The filter kernel of green band
-1
(d) The filter kernel of red band
2.2 2.2
2.22.2 OptimizationOptimizationOptimizationOptimization ofofofof parameterparameterparameterparameter
γ
ld inininin degradeddegradeddegradeddegraded scalescalescalescaleThe difficulty of degrading the image spatial resolution is how to define the high and low frequencies of an image. The spatial resolution degradation was obtained by measuring MTF of each band as low pass filters ( Junli et al., 2004).
Assuming ∧
ld
B is the
l
th band of fusion image in degradedscale; B~ld means the
l
th band up-sampled of degraded MSimage by MTF filter; γld is optimized parameter based on
Minimum Mean Square Error;
D
d is the high frequency part obtained from degraded PAN image. Equation (2) is the high frequency modulation image fusion formula in reduced scale:d ld ld
ld
B
D
B
∧=
~
+
γ
l
=
1,...,
N
(2)Referred by original MS image, parameter γld is optimized
based on Minimum Mean Square Error in degraded scale as follow(Garzelli et al., 2008).
(
l ld)
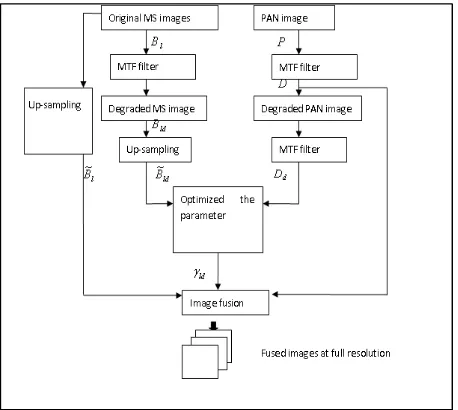
Figure 3 is flow chart of the improved high frequency modified fusion method.
Figure 3. Flow chart of the improved high frequency modulating fusion method
3333 ....EXPERIMENTALEXPERIMENTALEXPERIMENTALEXPERIMENTAL RESULTSRESULTSRESULTSRESULTS ANDANDANDAND ANALYSISANALYSISANALYSISANALYSIS
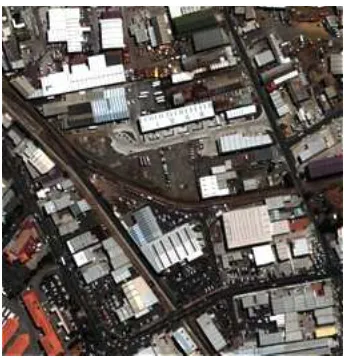
A set of GeoEye-1 data has been used to test the proposed fusion algorithm. The GeoEye-1 data was radiometrically calibrated from digital counts, geocoded and registered. Figure 4(a) is a GeoEye-1 PAN image with 0.5m spatial resolution. Fiure 4 (b) is GeoEye-1 MS images registered to the PAN image. The parameter driving the fusion process for the GeoEye-1 image is optimized at 2m resolution degraded by 4 scale ratio. It means GeoEye-1 PAN image is reduced to 2m resolution, MS degradation with 8m resolution as Figure 4(c)and Figure (d) shown. Figure 5(b), (c) and (d) were Fused images of Figure 4(c) and 4(d) with the method of weighted highpass filtering (w-HPF), general image fusion based on
modulation transfer function(MTF-GIF) (Ying et al. ,2009) and the improved method respectively.
Visual comparison from figure 5 (b), (c) and (d),reveals that the fused images by the three methods have greatly improved in the spatial resolution. Figure 4(d) is the clearest and has the highest resolution among of them. Viewing the color of Figure 5(a), (b), (c) and (d), they are very similar in color. These indicate that the fused images have little loss of spectral information.
Taking the original multi-spectral image as a reference image, an objective quantitative analysis of the fused images was performed in the scale of degradation. Deviation index, correlation coefficient, entropy and relative dimensionless global error (ERGAS) ( Zhijun et al., 2005) were calculated, shown in Table 1. Comparing the results of Table1, the deviation index of the improved method is the smallest, and its correlation coefficient is the biggest, even it has the minimum ERGAS values. This indicates that the fused image is closest to the original multi-spectral image, and it maintains the maximum spectral information of multispectral image. The method of w-HPF follows, and the worst is the MTF-GIF.
Image band Difference
Index CorrelationCoefficiententropy ERGAS
Referred
MTF-GIF R 0.37 0.97 6.8
9.10
Table 1.Comparison of three fusion methods in degrade scale
Figure 6(a), (b), (c) are the fused images with the three methods at full scale. Comparing with Figure 4(b), these three methods can significantly improve the spatial resolution of the original multi-spectral images, the fused images by the method of the w-HPF and the improved method are better than those fused by the method of the MTF-GIF,and the improved method keeps the spectral information best.
(b) Registered MS image
(c) Pan image in degrade scale
(d) Registered MS image in degrade scale
Figure4.GeoEye-1 images and their degraded image
(a) MS image
(b) Fused image with w-HPF
(d) Fused image with the new method
Figure5.MS image and Fused image in degrade scale
(a) Fused image with the w-HPF
(b) Fused image with the MTF-GIF
(c) Fused image with the proposed method
Figure 6. Fused images at full scale
In summary, the improved high frequency modulating fusion method based on modulation transfer function filters can improve the spatial resolution and keep the spectral information well.
4. 4. 4.
4. CCCCONCLUSIONONCLUSIONONCLUSIONONCLUSION
An improved high frequency modulation fusion method based on modulation transfer function Filters is proposed. Compared to the w-HPF and the MTF-GIF,the experimental results show the proposed method is best both in improving resolution of MS images and protecting spectral information of MS images among them. There's no doubt that it can improve the potential of high-resolution satellite images in practical applications.
References References References References
Aiazzi, B. Alparone, L., Baronti, S., Garzelli, A., Selva M., 2006.MTF-tailored multiscale fusion of high resolution MS and Pan Imagery. Photogrammetry Engineering and Remote
Sensing, 72(5), pp.591-596.
Chavez,P.S., Sides, S.C., Anderson, J.A., 1991. Comparison of three different methods to merge multiresolution and multispectral data: Landsat TM and SPOT. Photogrammetry
Engineering and Remote Sensing, 57(3), pp.295-303.
Garzelli, A., Nencinif, Capobianco, L., 2008.Optimal MMSE Pan sharpening of very high resolution multispectral images.IEEE Transactions on Geoscience and Remote Sensing,
46(1), pp.228-236.
Junli L., Yonghong J., 2004.New fusion method based on resolution degradation model for panchromatic and multi-spetral images.Journal of Wuhan University, 29(4), pp.302-306.
Zhijun W., Djemel, Z., Armenakis C.A., 2005. Comparative Analysis of image fusion methods.IEEE Transactions on
Geoscience and Remote Sensing, 43(6), pp.1391-1402.
Ying Z., Binbin H., Xiaowen L., 2009.Remote sensing image fusion of Beijing-1 DMC+4 microsatellites based on MTF filter.
Journal of Acta Geodaetica ET Cartographica Sinica, 3838(3),
Yonghong J., 2005.Data fusion technique for multisouce
remotely sensed images, Sinomaps Press. Beijing, pp2-10.
Acknowledgements Acknowledgements AcknowledgementsAcknowledgements