Afghanistan
AFGHANISTAN
DEMOGRAPHIC AND HEALTH SURVEY
2015
Central Statistics Organization
Ansari Watt, Kabul, Afghanistan
Ministry of Public Health
Wazir Akbar Khan, Kabul, Afghanistan
The DHS Program
ICF
Rockville, Maryland, USA
The 2015 Afghanistan Demographic and Health Survey (2015 AfDHS) was implemented by the Central Statistics
Organization and the Ministry of Public Health from 15 June, 2015, to 23 February, 2016. The funding for the
AfDHS was provided by the United States Agency for International Development (USAID). ICF provided
technical assistance through The DHS Program, a USAID-funded project providing support and technical
assistance in the implementation of population and health surveys in countries worldwide.
Additional information about the 2015 AfDHS may be obtained from the Central Statistics Organization, Ansari
Watt, Kabul, Afghanistan; Telephone: (+93) 0202104338; Internet: http://cso.gov.af and the Ministry of Public
Health, Great Masoud Road, Wazir Akbar Khan area, Kabul, Afghanistan; Internet: http://moph.gov.af.
Information about The DHS Program may be obtained from ICF, 530 Gaither Road, Suite 500, Rockville, MD
20850, USA; Telephone: +1-301-407-6500; Fax: +1-301-407-6501; E-mail: [email protected]; Internet:
www.DHSprogram.com.
CONTENTS
TABLES AND FIGURES ... vii
FOREWORD...xv
CONTRIBUTORS TO THE REPORT ... xvii
READING AND UNDERSTANDING TABLES FROM THE 2015 AFDHS ... xix
ADDITIONAL DHS PROGRAM RESOURCES ... xxvii
ACRONYMS AND ABBREVIATIONS ... xxix
MAP OF AFGHANISTAN ... xxxii
1
INTRODUCTION AND SURVEY METHODOLOGY ...1
1.1
Survey Objectives ...1
1.2
Sample Design ...1
1.3
Questionnaires...2
1.4
Pretest ...3
1.5
Training of Trainers ...3
1.6
Training of Field Staff ...3
1.7
Fieldwork ...4
1.7.1 Fieldwork Challenges ...4
1.8
Data Processing ...4
1.9
Response Rates ...5
2
HOUSING CHARACTERISTICS AND HOUSEHOLD POPULATION ...7
2.1
Drinking Water Sources and Treatment ...7
2.2
Sanitation ...8
2.3
Other Household Characteristics ...9
2.4
Household Wealth ...9
2.5
Hand Washing ...10
2.6
Household Population and Composition ...10
2.7
Birth Registration ...11
2.8
Children’s Living Arrangements and Parental Survival ...11
2.9
Education ...12
2.9.1 Educational Attainment ...12
2.9.2 School Attendance ...12
2.9.3 Reasons for Not Attending School ...13
3
CHARACTERISTICS OF RESPONDENTS ...31
3.1
Basic Characteristics of Survey Respondents ...31
3.2
Education and Literacy ...31
3.3
Mass Media Exposure ...33
3.4
Employment ...34
3.5
Occupation ...34
3.10 Cancer Prevalence and Deaths Related to Cancer ...37
4
MARRIAGE AND SEXUAL ACTIVITY ...61
4.1
Marital Status ...61
4.2
Polygyny ...62
4.3
Age at First Marriage ...63
4.4
Age at First Sexual Intercourse ...64
4.5
Recent Sexual Activity ...65
5
FERTILITY...77
5.1
Current Fertility ...77
5.2
Children Ever Born and Living...79
5.3
Birth Intervals ...79
5.4
Insusceptibility to Pregnancy ...80
5.5
Age at First Birth ...80
5.6
Teenage Childbearing ...81
6
FERTILITY PREFERENCES ...91
6.1
Desire for Another Child ...91
6.2
Ideal Family Size ...92
6.3
Fertility Planning Status ...93
6.4
Wanted Fertility Rates ...94
7
FAMILY PLANNING ...103
7.1
Contraceptive Knowledge and Use ...104
7.2
Source of Modern Contraceptive Methods ...106
7.3
Informed Choice ...107
7.4
Discontinuation of Contraceptives ...107
7.5
Demand for Family Planning ...108
7.6
Contact of Nonusers with Family Planning Providers ...110
8
INFANT AND CHILD MORTALITY ...127
8.1
Early Childhood Mortality ...128
8.2
Biodemographic Risk Factors ...129
8.3
Perinatal Mortality ...130
9
MATERNAL HEALTH CARE ...135
9.1
Antenatal Care Coverage and Content ...136
9.1.1 Skilled Providers ...136
9.1.2 Timing and Number of ANC Visits ...136
9.2
Components of ANC Visits ...137
9.3
Protection against Neonatal Tetanus ...137
9.4
Delivery Services ...138
9.4.1 Institutional Deliveries ...138
10
CHILD HEALTH ...159
10.1 Birth Weight...159
10.2 Vaccination of Children ...160
10.3 Symptoms of Acute Respiratory Infection ...162
10.4 Fever ...162
10.5 Diarrheal Disease ...163
10.5.1 Prevalence of Diarrhea ...163
10.5.2 Treatment of Diarrhea ...163
10.5.3 Feeding Practices ...164
10.5.4 Knowledge of ORS Packets ...165
10.6 Disposal of Children’s Stools ...165
11
NUTRITION OF CHILDREN AND WOMEN ...185
11.1 Infant and Young Child Feeding Practices ...185
11.1.1 Breastfeeding ...185
11.1.2 Exclusive Breastfeeding...186
11.1.3 Median Duration of Breastfeeding...187
11.1.4 Complementary Feeding ...187
11.1.5 Minimum Acceptable Diet ...188
11.2 Micronutrient Intake and Supplementation among Children...189
11.3 Presence of Iodized Salt in Households ...190
11.4 Micronutrient Intake among Mothers ...190
12
MALARIA ...201
12.1 Ownership of Insecticide-Treated Nets ...202
12.2 Household Access and Use of ITNs ...203
12.3 Use of ITNs by Children and Pregnant Women ...204
12.4 Case Management of Malaria in Children ...204
13
HIV/AIDS-RELATED KNOWLEDGE, ATTITUDES, AND BEHAVIOR ...215
13.1 HIV/AIDS Knowledge, Transmission, and Prevention Methods ...216
13.2 Knowledge about Mother-to-Child Transmission ...218
13.3 HIV/AIDS Attitudes ...218
13.3.1 Attitudes toward People Living with HIV/AIDS ...218
13.3.2 Attitudes toward Negotiating Safer Sexual Relations with
Husbands ...219
13.3.3 Attitudes toward Condom Education for Young People ...219
13.4 Coverage of HIV Testing Services ...220
13.5 Male Circumcision ...220
13.6 Self-reporting of Sexually Transmitted Infections ...220
13.7 Injections ...221
13.8 HIV/AIDS-Related Knowledge and Behavior among Young People ...221
13.8.1 Knowledge ...221
13.8.2 First Sex ...222
13.8.3 Coverage of HIV Testing Services ...222
14
ADULT AND MATERNAL MORTALITY ...245
14.1 Data ...245
15
WOMEN’S EMPOWERMENT ...251
15.1 Married Women’s and Men’s Employment ...251
15.2 Control over Women’s Earnings ...252
15.3 Control over Men’s Earnings ...253
15.4 Women’s and Men’s Ownership of Assets ...253
15.5 Women’s Participation in Decision Making ...254
15.6 Attitudes toward Wife Beating ...255
16
DOMESTIC VIOLENCE ...273
16.1 Measurement of Violence ...274
16.2 Experience of Physical Violence from Anyone ...274
16.2.1 Prevalence of Physical Violence ...274
16.2.2 Perpetrators of Physical Violence ...275
16.3 Marital Control...275
16.4 Spousal Violence ...276
16.4.1 Prevalence of Spousal Violence...276
16.4.2 Onset of Spousal Violence ...279
16.5 Injuries due to Spousal Violence ...279
16.6 Violence Initiated by Women against Husbands ...280
16.7 Response to Violence ...280
16.7.1 Help Seeking Behavior to Stop the Violence ...280
16.7.2 Sources for Help ...280
17
FISTULA ...299
17.1 Womens’ Knowledge of Fistula ...299
17.2 Self-Reported Symptoms and Treatment ...300
17.2.1 Self-reported Fistula Symptoms ...300
17.2.2 Treatment Seeking for Fistula ...300
REFERENCES ...307
APPENDIX A
SAMPLE DESIGN...309
APPENDIX B
ESTIMATES OF SAMPLING ERRORS ...319
APPENDIX C
DATA QUALITY TABLES ...359
TABLES AND FIGURES
INTRODUCTION AND SURVEY METHODOLOGY ...1
Table 1.1
Results of the household and individual interviews ... 5
HOUSING CHARACTERISTICS AND HOUSEHOLD POPULATION ...7
Table 2.1
Household drinking water ... 15
Table 2.2
Household sanitation facilities ... 16
Table 2.3
Household characteristics ... 17
Table 2.4
Household possessions ... 18
Table 2.5
Wealth quintiles ... 19
Table 2.6
Hand washing ... 20
Table 2.7
Household population by age, sex, and residence ... 21
Table 2.8
Household composition ... 21
Table 2.9
Birth registration of children under age 5 ... 22
Table 2.10
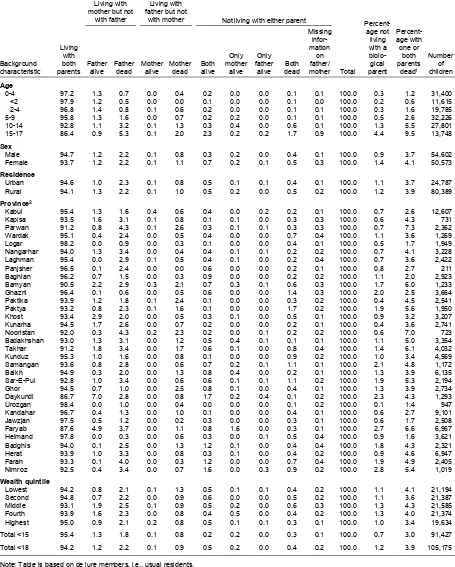
Children’s living arrangements and orphanhood ... 23
Table 2.11
School attendance by survivorship of parents ... 24
Table 2.12.1
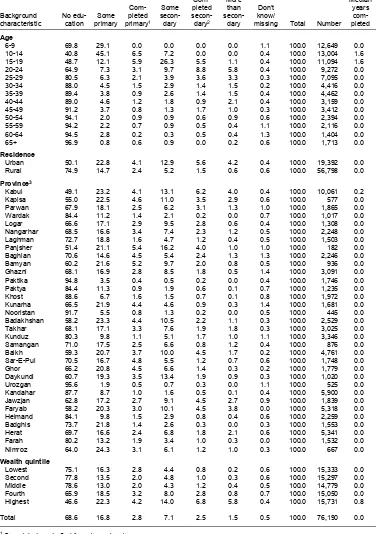
Educational attainment of the female household population ... 25
Table 2.12.2
Educational attainment of the male household population ... 26
Table 2.13
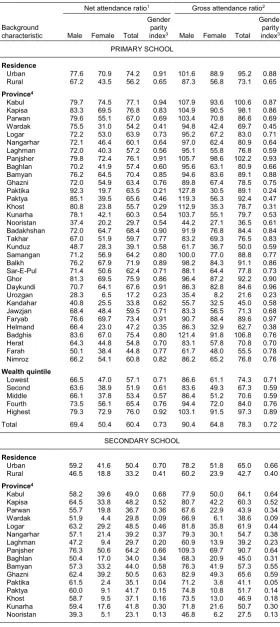
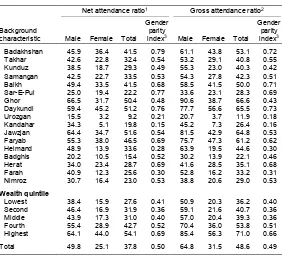
School attendance ratios ... 27
Table 2.14
Reasons for children never attending school ... 28
Table 2.15
Reasons for children dropping out of school ... 29
Figure 2.1
Households with improved water sources ... 8
Figure 2.2
Household drinking water by residence ... 8
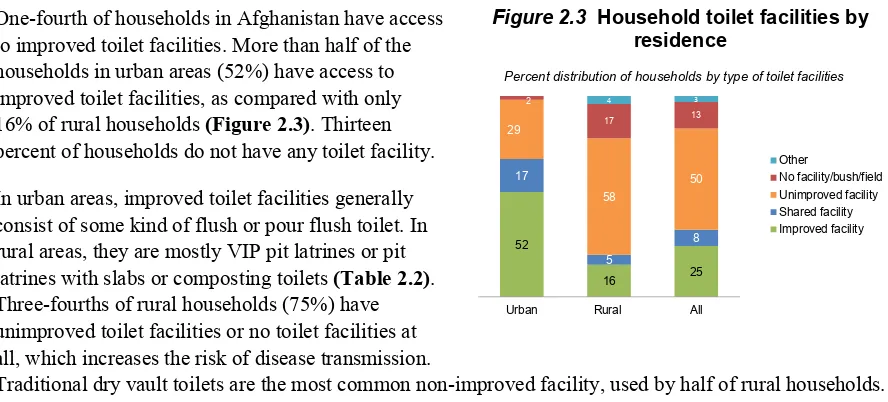
Figure 2.3
Household toilet facilities by residence ... 9
Figure 2.4
Household wealth by residence ... 10
Figure 2.5
Population pyramid ... 11
Figure 2.6
Birth registration by wealth ... 11
Figure 2.7
Orphanhood by age ... 12
Figure 2.8
Secondary school attendance by wealth ... 13
CHARACTERISTICS OF RESPONDENTS ...31
Table 3.1
Background characteristics of respondents ... 39
Table 3.2.1
Educational attainment: Women ... 40
Table 3.2.2
Educational attainment: Men ... 41
Table 3.3.1
Literacy: Women ... 42
Table 3.3.2
Literacy: Men ... 43
Table 3.4.1
Exposure to mass media: Women... 44
Table 3.4.2
Exposure to mass media: Men ... 45
Table 3.5.1
Employment status: Women ... 46
Table 3.5.2
Employment status: Men ... 47
Table 3.6.1
Occupation: Women ... 48
Table 3.6.2
Occupation: Men ... 49
Table 3.7
Type of employment: Women ... 50
Table 3.10.2
Knowledge concerning tuberculosis: Men ... 55
Table 3.11.1
Knowledge concerning hepatitis: Women ... 56
Table 3.11.2
Knowledge concerning hepatitis: Men ... 57
Table 3.12.1
Reported prevalence of hepatitis: Women ... 58
Table 3.12.2
Reported prevalence of hepatitis: Men ... 59
Table 3.13
Households with members diagnosed with cancer ... 60
Table 3.14
Deaths of household members diagnosed with cancer ... 60
Figure 3.1
Education of survey respondents ... 32
Figure 3.2
Women with more than a secondary education ... 33
Figure 3.3
Exposure to mass media ... 33
Figure 3.4.
Employment by education ... 34
Figure 3.5
Occupation ... 35
Figure 3.6
Use of tobacco ... 36
MARRIAGE AND SEXUAL ACTIVITY ...61
Table 4.1
Current marital status... 66
Table 4.2.1
Number of women's co-wives ... 67
Table 4.2.2
Number of men's wives ... 68
Table 4.3
Age at first marriage ... 69
Table 4.4
Median age at first marriage by background characteristics ... 70
Table 4.5
Age at first sexual intercourse ... 71
Table 4.6
Median age at first sexual intercourse by background characteristics ... 72
Table 4.7.1
Recent sexual activity: Women ... 73
Table 4.7.2
Recent sexual activity: Men ... 75
Figure 4.1
Marital status ... 62
Figure 4.2
Polygyny ... 63
Figure 4.3
Median age at first marriage by education ... 64
Figure 4.4
Median age at first sexual intercourse and first marriage among women and men ... 64
FERTILITY...77
Table 5.1
Current fertility ... 83
Table 5.2
Fertility by background characteristics ... 84
Table 5.3
Trends in age-specific fertility rates ... 85
Table 5.4
Children ever born and living ... 85
Table 5.5
Birth intervals ... 86
Table 5.6
Postpartum amenorrhea, abstinence, and insusceptibility ... 87
Table 5.7
Median duration of amenorrhea, postpartum abstinence, and postpartum
insusceptibility ... 87
Table 5.8
Menopause ... 88
Table 5.9
Age at first birth ... 88
Table 5.10
Median age at first birth... 89
FERTILITY PREFERENCES ...91
Table 6.1
Fertility preferences by number of living children ... 95
Table 6.2.1
Desire to limit childbearing: Women ... 96
Table 6.2.2
Desire to limit childbearing: Men ... 97
Table 6.3
Ideal number of children by number of living children ... 98
Table 6.4
Mean ideal number of children by background characteristics ... 99
Table 6.5
Fertility planning status ... 100
Table 6.6
Wanted fertility rates ... 101
Figure 6.1
Desire to limit childbearing ... 92
Figure 6.2
Ideal family size ... 92
Figure 6.3
Ideal family size by number of living children ... 93
Figure 6.4
Fertility planning status ... 93
Figure 6.5
Wanted and Actual Fertility ... 94
FAMILY PLANNING ...103
Table 7.1
Knowledge of contraceptive methods ... 112
Table 7.2
Knowledge of contraceptive methods by background characteristics ... 113
Table 7.3
Current use of contraception by age ... 114
Table 7.4
Current use of contraception by background characteristics ... 115
Table 7.5
Timing of sterilization ... 116
Table 7.6
Source of modern contraception methods ... 116
Table 7.7
Use of social marketing brand pills and condoms ... 117
Table 7.8
Informed choice ... 118
Table 7.9
Twelve-month contraceptive discontinuation rates ... 118
Table 7.10
Reasons for discontinuation ... 119
Table 7.11
Knowledge of fertile period ... 119
Table 7.12.1
Need and demand for family planning among currently married women ... 120
Table 7.12.2
Need and demand for family planning among ever-married women ... 121
Table 7.13
Future use of contraception ... 122
Table 7.14.1
Exposure to family planning messages: Women ... 123
Table 7.14.2
Exposure to family planning messages: Men ... 124
Table 7.15
Contact of nonusers with family planning providers ... 125
Figure 7.1
Knowledge of contraceptive methods ... 104
Figure 7.2
Contraceptive use ... 104
Figure 7.3
Use of modern methods by education ... 105
Figure 7.4
Modern contraceptive use by province ... 106
Figure 7.5
Source of modern contraceptive methods ... 106
Figure 7.6
Demand for family planning ... 108
Figure 7.7
Unmet need for family planning by province ... 109
INFANT AND CHILD MORTALITY ...127
Table 8.1
Early childhood mortality rates ... 131
Table 8.2
Early childhood mortality rates by socioeconomic characteristics ... 131
Table 8.3
Early childhood mortality rates by demographic characteristics ... 132
Table 8.4
Perinatal mortality ... 133
Table 8.5
High-risk fertility behavior ... 134
MATERNAL HEALTH CARE ...135
Table 9.1
Antenatal care ... 144
Table 9.2
Number of antenatal care visits and timing of first visit ... 145
Table 9.3
Components of antenatal care ... 146
Table 9.4
Knowledge of symptoms of pregnancy complications ... 147
Table 9.5
Men's participation during ANC visits ... 148
Table 9.6
Tetanus toxoid injections ... 149
Table 9.7
Place of delivery ... 150
Table 9.8
Assistance during delivery ... 151
Table 9.9
Timing of first postnatal checkup for the mother ... 153
Table 9.10
Type of provider of first postnatal checkup for the mother ... 154
Table 9.11
Timing of first postnatal checkup for the newborn ... 155
Table 9.12
Type of provider of first postnatal checkup for the newborn ... 156
Table 9.13
Problems in accessing health care ... 157
Figure 9.1
Antenatal care coverage ... 136
Figure 9.2
Components of antenatal care ... 137
Figure 9.3
Institutional deliveries by education ... 138
Figure 9.4
Institutional deliveries by province ... 139
Figure 9.5
Delivery assistance ... 139
Figure 9.6
Delivery assistance by wealth ... 140
Figure 9.7
Postnatal care by place of delivery ... 141
Figure 9.8
Women with at least one problem in accessing health care by education ... 142
CHILD HEALTH ...159
Table 10.1
Child’s size and weight at birth ... 167
Table 10.2
Vaccinations by source of information ... 168
Table 10.3
Vaccinations by background characteristics ... 169
Table 10.4
Vaccinations in first year of life ... 171
Table 10.5
Prevalence and treatment of symptoms of ARI ... 172
Table 10.6
Prevalence and treatment of fever ... 174
Table 10.7
Prevalence of diarrhea ... 175
Table 10.8
Diarrhea treatment ... 177
Table 10.9
Feeding practices during diarrhea ... 179
Table 10.10
Knowledge of ORS packets or ORS pre-packaged liquids ... 181
Table 10.11
Disposal of children’s stools ... 182
Table 10.12
Knowledge of childhood illness ... 183
Figure 10.1
Childhood vaccinations ... 160
Figure 10.2
Vaccination coverage by province ... 161
Figure 10.3
Vaccinations in first year of life ... 162
Figure 10.4
Diarrhea prevalence by age ... 163
Figure 10.5
Treatment of diarrhea ... 164
Figure 10.6
Feeding practices during diarrhea ... 165
Table 11.7
Presence of iodized salt in household ... 199
Table 11.8
Micronutrient intake among mothers... 200
Figure 11.1
Breastfeeding practices by age ... 186
Figure 11.2
IYCF breastfeeding indicators ... 187
Figure 11.3
IYCF indicators on minimum acceptable diet ... 189
MALARIA ...201
Table 12.1
Household possession of mosquito nets ... 206
Table 12.2
Access to an insecticide-treated net (ITN) ... 207
Table 12.3
Use of mosquito nets by persons in the household ... 208
Table 12.4
Use of existing ITNs ... 209
Table 12.5
Use of mosquito nets by children ... 210
Table 12.6
Use of mosquito nets by pregnant women ... 211
Table 12.7
Prevalence, diagnosis, and prompt treatment of children with fever ... 212
Table 12.8
Source of advice or treatment for children with fever ... 213
Table 12.9
Type of antimalarial drugs used ... 214
Figure 12.1
Household Ownership of ITNs ... 202
Figure 12.2
ITN Ownership by household wealth ... 203
Figure 12.3
Access to ITNs ... 203
Figure 12.4
Use of ITNs ... 204
HIV/AIDS-RELATED KNOWLEDGE, ATTITUDES, AND BEHAVIOR ...215
Table 13.1
Knowledge of AIDS ... 224
Table 13.2.1
Source of knowledge on HIV/AIDS: Women ... 225
Table 13.2.2
Source of knowledge on HIV/AIDS: Men ... 226
Table 13.3
Knowledge of HIV prevention methods ... 227
Table 13.4.1
Comprehensive knowledge about HIV/AIDS: Women ... 228
Table 13.4.2
Comprehensive knowledge about HIV/AIDS: Men ... 229
Table 13.5
Knowledge of prevention of mother to child transmission of HIV ... 230
Table 13.6.1
Accepting attitudes toward those living with HIV/AIDS: Women ... 231
Table 13.6.2
Accepting attitudes toward those living with HIV/AIDS: Men ... 232
Table 13.7
Attitudes toward negotiating safer sexual relations with husband ... 233
Table 13.8
Adult support of education about condom use to prevent AIDS ... 234
Table 13.9.1
Coverage of prior HIV testing: Women ... 235
Table 13.9.2
Coverage of prior HIV testing: Men ... 236
Table 13.10
Male circumcision ... 237
Table 13.11
Place of circumcision... 238
Table 13.12
Age at circumcision ... 239
Table 13.13
Self-reported prevalence of sexually-transmitted infections (STIs) and STI symptoms . 240
Table 13.14
Prevalence of medical injections ... 241
Table 13.15
Comprehensive knowledge about AIDS and of a source of condoms among young
people ... 242
Table 13.16
Age at first sexual intercourse among young people ... 243
Table 13.17
Recent HIV tests among youth ... 244
Figure 13.1
Knowledge of AIDS by wealth status ... 216
Figure 13.2
Comprehensive knowledge of HIV ... 216
Figure 13.7
Early Sexual Initiation ... 222
ADULT AND MATERNAL MORTALITY ...245
Table 14.1
Completeness of information on siblings ... 249
Table 14.2
Adult mortality rates ... 249
Table 14.3
Adult mortality probabilities ... 249
Table 14.4
Pregnancy-related mortality rates ... 250
WOMEN’S EMPOWERMENT ...251
Table 15.1
Employment and cash earnings of currently married women and men ... 257
Table 15.2.1
Control over women's cash earnings and relative magnitude of women's cash earnings 258
Table 15.2.2
Control over men's cash earnings ... 259
Table 15.3
Women's control over their own earnings and over those of their husbands ... 260
Table 15.4.1
Ownership of assets: Women ... 261
Table 15.4.2
Ownership of assets: Men ... 262
Table 15.5
Participation in decision making ... 263
Table 15.6.1
Women's participation in decision making by background characteristics ... 264
Table 15.6.2
Men's participation in decision making by background characteristics ... 265
Table 15.7.1
Attitude toward wife beating: Women ... 266
Table 15.7.2
Attitude toward wife beating: Men ... 268
Table 15.8
Indicators of women's empowerment ... 269
Table 15.9
Current use of contraception by women's empowerment ... 270
Table 15.10
Ideal number of children and unmet need for family planning by women's
empowerment ... 270
Table 15.11
Reproductive health care by women's empowerment... 271
Table 15.12
Early childhood mortality rates by women's status ... 271
Figure 15.1
Women's and men's employment by age ... 252
Figure 15.2
Control over women's earnings ... 252
Figure 15.3
Ownership of assets ... 253
Figure 15.4
Women's participation in decision making ... 254
Figure 15.5
Attitudes towards wife beating ... 255
DOMESTIC VIOLENCE ...273
Table 16.1
Experience of physical violence ... 282
Table 16.2
Experience of violence during pregnancy ... 284
Table 16.3
Persons committing physical violence ... 285
Table 16.4
Marital control exercised by husbands ... 286
Table 16.5
Forms of spousal violence ... 287
Table 16.6
Spousal violence by background characteristics ... 288
Table 16.7
Spousal violence by husband's characteristics and empowerment indicators... 290
Table 16.8
Physical or sexual violence in the past 12 months by any husband ... 291
Table 16.9
Experience of spousal violence by duration of marriage ... 292
Table 16.10
Injuries to women due to spousal violence ... 293
Figure 16.4
Spousal violence by subnational unit ... 279
Figure 16.5
Help seeking by type of violence experienced ... 280
FISTULA ...299
Table 17.1
Fistula ... 302
Table 17.2
Characteristics of labor reported as cause of fistula symptoms ... 303
Table 17.3
Type of provider for treatment of fistula ... 304
Table 17.4
Outcome of treatment of fistula ... 304
Table 17.5
Reasons for not seeking treatment for fistula symptoms ... 305
Figure 17.1
Knowledge of fistula by age ... 299
Figure 17.2
Reported cause of fistula ... 300
Figure 17.3
Outcome of fistula treatment ... 301
FOREWORD
he Afghanistan Demographic and Health Survey (AfDHS) 2015 is the first survey of its kind to be
implemented in the country as part of the worldwide Demographic and Health Surveys (DHS)
Program. It was implemented by the joint effort of the Central Statistical Organization (CSO) and
the Ministry of Public Health (MoPH), with the objective of providing reliable, accurate, and
up-to-date data for the country. We hope that information contained in this report will assist policymakers and
program managers in monitoring and designing programs and strategies for improving maternal and child
health and family planning services in Afghanistan. This report presents comprehensive, final outcomes of
the findings of the survey. Users will find the information useful for program planning and evaluation.
The 2015 AfDHS is a national sample survey that provides up-to-date information on fertility levels;
marriage; fertility preferences; awareness and use of family planning methods; child feeding practices;
nutrition, adult, and childhood mortality; awareness and attitudes regarding HIV/AIDS; women’s
empowerment; and domestic violence. The target groups were women and men age 15-49 in randomly
selected households across Afghanistan. In addition to presenting national estimates, the report provides
estimates of key indicators for both the urban and rural areas in Afghanistan and the provinces.
The success of the 2015 AfDHS was made possible by a number of organizations and individuals.
In this regard, we appreciate the support of the United States Agency for International Development in
Afghanistan (USAID) for funding the survey. We would like to extend our gratitude to the United Nations
Children’s Fund (UNICEF) for providing technical support during the training. We also appreciate the
valuable technical input provided by the Technical Committee and the Steering Committee during the
different phases of the survey; these contributed to its successful implementation. Furthermore, the support
and collaboration witnessed from the national and provincial administration, nongovernmental and
international development organizations, and other major stakeholders is highly acknowledged.
We are grateful to the 2015 AfDHS core team for managing technical, administrative, and logistical
aspects of the survey; the master trainers, for their support in training and monitoring the fieldwork; the
field staff, for data collection; the data processing team; and, in particular, the survey respondents.
Similarly, we wish to express our appreciation to ICF for its technical assistance in all stages of the survey.
We wish to also acknowledge Avais Hyder Liaquat Nauman (AHLN) Chartered Accountants for providing
accounting and disbursement services that allowed for the timely and efficient transfer of project funds
throughout the survey period.
CONTRIBUTORS TO THE REPORT
Dr. Sayed Ataullah Saeedzai, General Director, Evaluation and Health Information System General
Directorate, MoPH
Dr. Said Iftekhar Sadaat, EHIS Advisor, Evaluation and Health Information System General Directorate,
MoPH
Sayed Ali Aqa Hashimi, Deputy Director of Field Operation, CSO
Dr. Edris Ayazi, DHS Survey Manager, MoPH
Ataullah Serajy, Health Statistics Manager, Demography Department, CSO
Dr. Abdul Nasir Ikram, Project Management Specialist-Health, Office of Health and Nutrition, USAID
Dr. Hafez Rasooli, National Influenza & Zoonotic Surveillance Manager, Surveillance Department, MoPH
Dr Roqia Naser, Training officer, National EPI, MoPH
Dr. Zohra Shamszai, MNH Manager, Reproductive Health Directorate, MoPH
Dr. Samim Soroush, M&E and Research Coordinator, Reproductive Health Directorate, MoPH
Dr. Nezamuddin Jalil, Learning & Coordination Manager, Reproductive Health Directorate, MoPH
Dr. Rangina Aziz, RH Morbidity Officer, Reproductive Health Directorate, MoPH
Dr. Naziha Ahmadi, FP Public Officer, Reproductive Health Directorate, MoPH
Dr. Muhammad Naeem Habib, Malaria program coordinator, National Malaria & Leishmaniosis Control
Program (NMLCP), MoPH
Ahmad Fahim Haidari, Member of Population Research, Demography Department, CSO
Dr. Abdul Baseer Sardar Qureshi, National Nutrition Surveillance Coordinator, Public Nutrition
Department
Dr. Younas Bargami, Program technical coordinator, National AIDS Control Program, MoPH
Bahar Rasoly, EHIS officer, Evaluation and Health Information System General Directorate, MoPH
Fatima Arifi, EHIS officer, Evaluation and Health Information System General Directorate, MoPH
READING AND UNDERSTANDING THE 2015 AFDHS
In 2016, The DHS Program began producing final
reports with a new format and style. The new style
features about 90 figures to highlight trends,
subnational patterns, and background
characteristics. The text has been simplified to
highlight key points in bullets and to clearly
identify indicator definitions in boxes.
All of the standard tables that have historically
been included in the DHS continue to be
included in this new style.
They are located at the
end of each chapter. Each DHS final report is
based on approximately 200 tables of data. While
the text and figures featured in each chapter
highlight some of the most important findings
from the tables, not every finding can be discussed
or displayed graphically. For this reason, DHS
data users should be comfortable reading and
interpreting tables.
The following pages provide an introduction to the
organization of DHS tables, the presentation of
background characteristics, and a brief summary
of sampling and understanding denominators. In
addition, this section provides some exercises for
Example 1: Exposure to Mass Media
A Question Asked of All Survey Respondents
Table 3.4.1 Exposure to mass media: Women
Percentage of ever-married women age 15-49 who are exposed to specific media on a weekly basis, by background characteristics, Afghanistan 2015
Background characteristic
Reads a news-paper at least once a week
Watches tele-vision at least once a week
Listens to radio at least once a
week
Accesses all three media at
least once a week
Accesses none of the three media at least
once a week Number of women
Age
15-19 4.3 36.7 23.5 1.5 47.9 1,825
20-24 3.5 37.6 27.0 1.1 46.4 6,089
25-29 2.7 38.8 25.3 1.2 46.2 6,299
30-34 1.4 40.3 23.1 0.4 47.2 4,302
35-39 2.7 41.8 21.4 1.5 47.5 4,463
40-44 1.7 38.5 23.2 0.9 47.6 3,113
45-49 1.4 40.2 21.3 0.9 48.5 3,369
Residence
Urban 7.6 71.1 26.3 3.2 20.7 6,870
Rural 1.0 29.6 23.2 0.4 55.1 22,591
Province1
Kabul 9.2 70.4 27.1 4.0 21.2 3,658
Kapisa 6.5 41.6 47.0 4.2 37.9 205
Parwan 1.8 20.5 36.0 0.2 50.9 625
Wardak 0.0 16.9 10.1 0.0 76.1 382
Logar 5.9 15.1 52.1 1.6 41.9 472
Nangarhar 2.3 31.2 18.6 1.0 59.0 794
Laghman 1.4 14.2 36.5 0.4 59.9 583
Panjsher 4.8 52.3 10.4 0.6 42.9 54
Baghlan 3.8 51.3 11.1 1.2 43.0 839
Bamyan 1.8 38.6 10.8 0.6 56.0 303
Ghazni 1.8 31.8 34.1 0.5 48.1 1,328
Paktika 0.0 7.2 40.4 0.0 55.5 792
Paktya 0.1 20.6 60.4 0.1 37.4 542
Khost 0.2 33.6 55.6 0.1 38.8 851
Kunarha 1.5 6.1 13.7 0.7 83.2 559
Nooristan 0.6 0.1 2.0 0.0 97.9 222
Badakhshan 1.0 12.8 5.5 0.8 85.7 1,004
Takhar 0.5 22.3 19.7 0.2 70.4 1,105
Kunduz 1.9 49.1 23.9 1.2 46.0 1,232
Samangan 1.3 20.3 6.8 0.8 77.4 330
Balkh 2.1 53.2 7.2 0.7 44.0 1,781
Sar-E-Pul 1.2 26.6 2.1 0.4 72.5 654
Ghor 0.5 39.3 16.5 0.3 55.9 715
Daykundi 0.3 11.9 1.2 0.2 87.2 329
Urozgan 0.0 5.7 20.8 0.0 77.4 230
Kandahar 0.8 16.2 55.8 0.2 40.0 2,227
Jawzjan 5.1 54.0 22.8 3.3 42.5 614
Faryab 2.5 76.8 5.9 1.3 20.9 2,114
Helmand 0.8 23.2 40.8 0.4 46.7 875
Badghis 0.3 6.8 2.4 0.2 92.1 650
Herat 1.9 55.6 12.5 0.7 37.7 2,316
Farah 0.2 38.6 28.9 0.1 46.6 777
Nimroz 1.4 57.3 1.1 0.0 42.3 278
Education
No education 0.2 33.2 24.1 0.0 51.8 24,604
Primary 3.8 64.7 20.5 1.9 28.0 2,330
Secondary 18.4 70.2 22.0 6.3 21.7 1,971
More than secondary 43.4 89.1 40.4 24.9 6.1 556
Wealth quintile
Lowest 0.3 22.1 10.9 0.1 71.0 5,904
Second 0.5 24.1 22.3 0.2 59.5 6,001
Middle 0.7 26.4 27.2 0.3 53.3 5,888
Fourth 1.9 48.2 30.7 0.6 34.8 6,010
Highest 9.6 77.0 28.8 4.3 15.4 5,657
Total 2.5 39.2 24.0 1.1 47.1 29,461
1
3
2
Step 1:
Read the title and subtitle. They tell you the topic and the specific population group being
described. In this case, the table is about ever-married women age 15-49 and their exposure to different
types of media. All eligible ever-married female respondents age 15-49 were asked these questions.
Step 2:
Scan the column headings—highlighted in green in Example 1.They describe how the information
is categorized. In this table, the first three columns of data show different types of media that ever-married
women access at least once a week. The fourth column shows ever-married women who access all three
media, while the fifth column is ever-married women who do not access any of the three types of media at
least once a week. The last column lists the number of ever-married women interviewed in the survey.
Step 3:
Scan the row headings—the first vertical column highlighted in blue in Example 1. These show the
different ways the data are divided into categories based on population characteristics. In this case, the
table presents ever-married women’s exposure to media by age, urban-rural residence, province,
educational level, and wealth quintile. Most of the tables in the AfDHS report will be divided into these
same categories.
Step 4:
Look at the row at the bottom of the table highlighted in red. These percentages represent the totals
of all ever-married women age 15-49 and their access to different types of media. In this case, 2.5%* of
ever-married women age 15-49 read a newspaper at least once a week, 39.2% watch television weekly, and
24.0% listen to the radio weekly.
Step 5: To find out what percentage of ever-married women with more than secondary education access all
three media weekly, draw two imaginary lines, as shown on the table. This shows that 24.9% of
ever-married women age 15-49 with more than secondary education access all three types of media weekly.
Step 6: By looking at patterns by background characteristics, we can see how exposure to mass media
varies across Afghanistan. Mass media are often used to communicate health messages. Knowing how
mass media exposure varies among different groups can help program planners and policy makers
determine how to most effectively reach their target populations.
*For the purpose of this document data are presented exactly as they appear in the table including decimal places. However,
the text in the remainder of this report rounds data to the nearest whole percentage point.
Practice:
Use the table in Example 1 to answer the following questions:
a) What percentage of ever-married women in Afghanistan do not access any of the three media at least once
a week?
b) What age group of ever-married women are most likely to watch television weekly?
c) Compare ever-married women in urban areas to ever-married women in rural areas—which group is more
likely to read the newspaper weekly?
d) What are the lowest and highest percentages (range) of ever-married women who do not access any of the
three media at least once a week by province?
e) Is there a clear pattern in exposure to television on a weekly basis by education level?
f) Is there a clear pattern in exposure to radio on a weekly basis by wealth quintile?
b) Ev
er-marr
ied
w
ome
n a
ge
35-39:
41
.8%
of e
ver
-marr
ied
w
om
en
in
thi
s age
gr
oup
w
atc
h te
lev
isi
on
wee
kly
c) Ev
er-marr
ied
w
ome
n in
ur
ban
ar
eas,
7.6
% lis
ten
to
th
e ra
dio
w
eek
ly,
co
mpar
ed
to
1.0
% of
ev
er-marr
ied
w
om
en
in
rur
al a
rea
s
d) 2
0.9
% of
ev
er-marr
ied
w
ome
n in
th
e F
ary
ab
pro
vin
ce
do
not
ac
cess a
ny
of t
he
thr
ee
medi
a a
t le
ast
on
ce
a w
eek
, c
omp
are
d to
an.
rist
Noo
in
en
om
d w
marrie
ver-
of e
9%
97.
e) Ex
posu
re
to
tel
evi
sion
on
a
wee
kly
ba
sis i
ncr
ease
s as a
w
oman
’s l
eve
l o
f e
duc
atio
n in
cre
ase
s; 3
3.2
% o
f e
ver
-m
arr
ied
w
ome
n w
ith
n.
atio
duc
y e
dar
con
n se
tha
re
mo
with
en
om
d w
marrie
ver-
of e
.1%
89
d to
are
omp
, c
kly
wee
on
isi
lev
h te
atc
w
ion
cat
edu
no
f) T
her
e is n
o c
lea
r p
atte
rn
in
exp
osu
re
to
rad
io
on
a w
eek
ly
basi
s by
wea
lth
qu
int
ile
. Ev
er-marrie
d w
om
en
in
the
lo
west
w
eal
th
e a
ntil
qui
th
eal
w
urth
e fo
th
n in
ome
w
ied
er-marr
ev
and
9%)
10.
sis (
ba
kly
wee
a
on
dio
ra
the
to
en
list
y to
kel
st li
lea
re
e a
ntil
qui
re
Example 2 Prevalence and Treatment of Symptoms of ARI
A Question Asked of a Subgroup of Survey Respondents
Table 10.5 Prevalence and treatment of symptoms of ARI
Among children under age 5, the percentage who had symptoms of acute respiratory infection (ARI) in the 2 weeks preceding the survey and among children with symptoms of ARI, the percentage for whom advice or treatment was sought from a health facility or provider and the percentage who received antibiotics as treatment, according to background characteristics, Afghanistan 2015
Among children under age 5 Among children under age 5 with symptoms of ARI:
Background
characteristic symptoms of ARIPercentage with 1 Number of children
Percentage for whom advice or treatment was
sought from a health
facility or provider2 received antibiotics Percentage who Number of children
Age in months
<6 10.0 3,095 71.1 49.8 308
6-11 14.7 2,720 64.0 60.7 400
12-23 13.9 5,708 67.3 61.5 792
24-35 14.8 6,598 54.5 52.1 977
36-47 11.3 6,282 61.4 53.5 708
48-59 10.7 5,902 58.5 48.1 631
Sex
Male 12.9 15,605 62.4 55.2 2,017
Female 12.2 14,699 60.4 53.4 1,800
Mother’s smoking status
Smokes cigarettes/tobacco 13.2 769 61.2 60.3 101
Does not smoke 12.6 29,460 61.5 54.2 3,715
Missing 0.3 75 * * 0
Cooking fuel
Electricity or gas 9.9 9,089 70.7 55.8 904
Kerosene * 1 * * 0
Coal/lignite 14.5 99 * * 14
Charcoal 4.5 176 * * 8
Wood/straw3 13.7 15,015 60.2 50.9 2,052
Animal dung 14.1 5,751 55.4 61.7 814
Other fuel 17.9 130 (41.9) (68.9) 23
No food cooked in household (4.0) 20 * * 1
Missing (1.0) 22 * * 0
Residence
Urban 11.8 7,040 65.1 50.7 834
Rural 12.8 23,264 60.4 55.4 2,983
Province4
Kabul 6.9 3,677 52.8 47.4 252
Kapisa 15.8 211 50.7 54.2 33
Parwan 2.6 688 * * 18
Wardak 17.3 329 57.1 50.8 57
Logar 1.4 417 * * 6
Nangarhar 18.2 972 68.6 56.8 177
Laghman 16.0 770 76.3 58.5 124
Panjsher 0.9 39 * * 0
Baghlan 26.3 700 37.8 36.2 184
Bamyan 9.3 314 51.3 57.3 29
Ghazni 0.4 778 * * 3
Paktika 2.5 856 (93.0) (86.2) 21
Paktya 7.7 578 75.5 30.0 44
Khost 7.8 991 46.8 93.4 78
Kunarha 4.3 704 (49.4) (70.0) 31
Nooristan 9.1 303 47.1 49.0 28
Badakhshan 17.6 870 22.9 26.0 153
Takhar 9.2 1,187 34.2 65.9 110
Kunduz 9.4 1,177 60.8 75.5 111
Samangan 5.7 345 (74.7) (48.5) 20
Balkh 15.2 1,874 63.8 67.3 285
Sar-E-Pul 3.6 596 * * 21
Ghor 28.3 846 58.2 56.6 239
Daykundi 7.5 308 (12.2) (23.8) 23
1
2
a
b
Table 10.5—Continued
Background
characteristic Among children under age five: Among children under age five with symptoms of ARI:
Percentage with
symptoms of ARI1 Number of children
Percentage for whom advice or treatment was
sought from a health
facility or provider2 received antibiotics Percentage who Number of children
Mother’s education
No education 12.9 25,261 61.1 54.0 3,256
Primary 13.1 2,429 62.1 53.0 319
Secondary 9.5 2,130 63.9 64.1 203
More than secondary 7.9 484 (77.7) (47.6) 38
Wealth quintile
Lowest 16.2 5,795 52.9 51.0 939
Second 11.9 6,185 65.6 56.4 737
Middle 12.8 6,398 56.3 51.2 821
Fourth 11.3 6,312 67.1 57.2 714
Highest 10.8 5,614 70.0 58.2 606
Total 12.6 30,304 61.5 54.4 3,817
Note: Figures in parentheses are based on 25-49 unweighted cases. An asterisk indicates that a figure is based on fewer than 25 unweighted cases and has been suppressed.
1 Symptoms of ARI consist of cough accompanied by short, rapid breathing that was chest-related and/or by difficult breathing that was chest-related. 2 Excludes pharmacy, shop, market, and traditional practitioner
3 Includes grass, shrubs, and crop residues
4 Estimates for Zabul are not presented separately due to sample coverage issues; however, they are included in the total national estimates.
Step 1:
Read the title and subtitle. In this case, the table is about two separate groups of children: all
children under age five (a) and children under age five who had symptoms of acute respiratory infection
(ARI) in the two weeks before the survey (b).
Step 2:
Identify the two panels. First, identify the columns that refer to all children under age five (a), and
then isolate the columns that refer only to those children under age five who had symptoms of ARI in the
two weeks before the survey (b).
Step 3:
Look at the first panel. What percentage of children under age five had symptoms of ARI in the
two weeks before the survey? It’s 12.6%. Now look at the second panel. How many children under age
five are there who had symptoms of ARI in the two weeks before the survey? It’s 3,817 children or 12.6%
of the 30,304 children under age five (with rounding). The second panel is a subset of the first panel.
Step 4:
Only 12.6% of children under age five had symptoms of ARI in the two weeks before the survey.
Once these children are further divided into the background characteristic categories, there may be too few
cases for the percentages to be reliable.
What percentage of children under age five in Kunarha province who had symptoms of ARI in the
two weeks before the survey received antibiotics? 70.0%. This percentage is in parentheses
because there are between 25 and 49 children (unweighted) in this category. Readers should use
this number with caution—it may not be reliable. (For more information on weighted and
unweighted numbers, see Example 4.)
What percentage of children under age five in Nimroz province who had symptoms of ARI in the
two weeks before the survey received antibiotics? There is no number in this cell—only an
asterisk. This is because fewer than 25 children under age five in Nimroz province had symptoms
of ARI in the two weeks before the survey. Results for this group are not reported. The subgroup
is too small, and therefore the data are not reliable.
Note:
When parentheses or asterisks are used in a table, the explanation will be noted under the table. If there are no
parentheses or asterisks in a table, you can proceed with confidence that enough cases were included in all categories that the
Example 3: Understanding Sampling Weights in AfDHS Tables
A sample is a group of people who have
been selected for a survey. In the AfDHS,
the sample is designed to represent the
national population age 15-49. In addition
to national data, most countries want to
collect and report data on smaller
geographical or administrative areas.
However, doing so requires a minimum
sample size per area. For the 2015 AfDHS,
the survey sample is representative at the
national and provincial levels, and for
urban and rural areas.
To generate statistics that are representative
of the country as a whole and the 33
provinces, the number of women surveyed
in each province should contribute to the
size of the total (national) sample in
proportion to size of the province.
However, if some provinces have small
populations, then a sample allocated in
proportion to each province’s population
may not include sufficient women from
each province for analysis. To solve this
problem, provinces with small populations
are oversampled. For example, let’s say
that you have enough money to interview
29,461 women and want to produce results
that are representative of Afghanistan as a
whole and its provinces (as in Table 3.1).
However, the total population of
Afghanistan is not evenly distributed among the provinces: some provinces, such as Kabul, are heavily
populated while others, such as Panjsher are not. Thus, Panjsher must be oversampled.
A sampling statistician determines how many women should be interviewed in each province in order to
get reliable statistics. The
blue column (1)
in the table at the right shows the actual number of women
interviewed in each province. Within the provinces, the number of women interviewed ranges from 652 in
Bamyan to 1,398 in Nooristan province. The number of interviews is sufficient to get reliable results in
each province.
With this distribution of interviews, some provinces are overrepresented and some provinces are
underrepresented. For example, the population in Kabul is about 12% of the population in Afghanistan,
while Panjsher’s population contributes only 0.2% of the population in Afghanistan. But as the blue
column shows, the number of women interviewed in Kabul accounts for only about 2.5% of the total
Table 3.1 Background characteristics of respondents
Percent distribution of ever-married women age 15-49 by selected background characteristics, Afghanistan 2015
Women Background
characteristic Weighted percent Weighted number Unweighted number
Province1
Kabul 12.4 3,658 755
Kapisa 0.7 205 874
Parwan 2.1 625 744
Wardak 1.3 382 870
Logar 1.6 472 915
Nangarhar 2.7 794 1,023
Laghman 2.0 583 800
Panjsher 0.2 54 681
Baghlan 2.8 839 740
Bamyan 1.0 303 652
Ghazni 4.5 1,328 1,146
Paktika 2.7 792 1,110
Paktya 1.8 542 1,174
Khost 2.9 851 1,338
Kunarha 1.9 559 734
Nooristan 0.8 222 1,398
Badakhshan 3.4 1,004 835
Takhar 3.8 1,105 819
Kunduz 4.2 1,232 839
Samangan 1.1 330 682
Balkh 6.0 1,781 909
Sar-E-Pul 2.2 654 812
Ghor 2.4 715 886
Daykundi 1.1 329 669
Urozgan 0.8 230 805
Kandahar 7.6 2,227 952
Jawzjan 2.1 614 865
Faryab 7.2 2,114 742
Helmand 3.0 875 843
Badghis 2.2 650 875
Herat 7.9 2,316 989
Farah 2.6 777 1,133
Nimroz 0.9 278 680
Total 100.0 29,461 29,461
Note: Education categories refer to the highest level of education attended.
1 Estimates for Zabul are not presented separately due to sample coverage issues;
however, they are included in the total national estimates.
total. Women from a large province, like Kabul, should contribute much more. Therefore, DHS
statisticians mathematically calculate a “weight” which is used to adjust the number of women from each
province so that each province’s contribution to the total is proportional to the actual population of the
province. The numbers in the
purple column (2)
represent the “weighted” values. The weighted values can
be smaller or larger than the unweighted values at provincial level. The total national sample size of 29,461
women has not changed after weighting, but the distribution of the women in the provinces has been
changed to represent their contribution to the total population size.
How do statisticians weight each category? They take into account the probability that a woman was
selected in the sample. If you were to compare the
red column (3)
to the actual population distribution of
Afghanistan, you would see that women in each province are contributing to the total sample with the
same weight that they contribute to the population of the country. The weighted number of women in the
survey now accurately represents the proportion of women who live in Kabul and the proportion of women
who live in Panjsher.
ADDITIONAL DHS PROGRAM RESOURCES
The DHS Program Website – Download free DHS
reports, standard documentation, key indicator data,
and training tools, and view announcements.
DHSprogram.com
STATcompiler – Build custom tables, graphs, and
maps with data from 90 countries and thousands of
indicators.
Statcompiler.com
DHS Program Mobile App – Access key DHS
indicators for 90 countries on your mobile device
(Apple, Android, or Windows).
Search DHS Program in your
iTunes or Google Play store
DHS Program User Forum – Post questions about
DHS data, and search our archive of FAQs.
userforum.DHSprogram.com
Tutorial Videos – Watch interviews with experts and
learn DHS basics, such as sampling and weighting,
downloading datasets, and How to Read DHS Tables.
www.youtube.com/DHSProgram
Datasets – Download DHS datasets for analysis.
DHSprogram.com/Data
Spatial Data Repository – Download geographically
linked health and demographic data for mapping in a
geographic information system (GIS).
spatialdata.DHSprogram.com
Social Media – Follow The DHS Program and join the conversation. Stay up to date through:
www.facebook.com/DHSprogram
www.twitter.com/
DHSprogram
www.pinterest.com/
DHSprogram
www.linkedin.com/
company/dhs-program
YouTube
www.youtube.com/DHSprogram
Blog
Blog.DHSprogram.com
ACRONYMS AND ABBREVIATIONS
ACT
artemisinin-based combination therapy
AfDHS
Afghanistan Demographic and Health Survey
AFGA
Afghan Family Guidance Association
AIDS
acquired immunodeficiency syndrome
ANC
antenatal care
ANDS
Afghanistan National Development Strategy
ARI
acute respiratory infection
ART
antiretroviral therapy
ASFR
age-specific fertility rate
BCG
Bacille-Calmette-Guerin vaccine against tuberculosis
BPHS
basic package of health services
BMI
body mass index
CBMM
community based management of malaria
CHC
comprehensive health center
CPR
contraceptive prevalence rate
CSO
Central Statistics Organization
DHS
Demographic and Health Survey
DPT
Diphtheria, pertussis, and tetanus vaccine
EA
enumeration area
EPI
Expanded Program on Immunization
EVAW
elimination of violence against women
GAR
gross attendance ratio
GFR
general fertility rate
GPI
gender parity index
HIV
human immunodeficiency virus
HMIS
health management information system
ICPD
International Conference on Population and Development
IRB
institutional review board
ITN
insecticide-treated net
IUD
intrauterine device
IYCF
infant and young child feeding
LAM
lactational amenorrhea method
LLIN
long-lasting insecticide-treated bed net
LPG
liquid petroleum gas
MTCT
mother-to-child transmission
NAPWA
National Action Plan for Women of the Afghanistan
NAR
net attendance ratio
NGO
nongovernmental organization
NMLCP
National Malaria and Leishmaniosis Control Program
NN
neonatal mortality
NNS
national nutrition survey
NTG
national treatment guideline
OPV
oral polio vaccine
ORS
oral rehydration salts
ORT
oral rehydration therapy
PAHO
Pan American Health Organization
PCV
Pneumococcal conjugate vaccine
PHD
provincial health directorate
PNN
postneonatal mortality
PSOs
provincial statistical officers
PSU
primary sampling unit
RHF
recommended homemade fluids
RMNCA
reproductive, maternal, neonatal, child, and adolescent
SP
sulfadoxine/pyrimethamine
STI
sexually transmitted infection
TB
tuberculosis
TFR
total fertility rate
TWFR
total wanted fertility rate
UN
United Nations
UNAIDS
Joint United Nations Programme on HIV/AIDS
UNDP
United Nations Development Program
UNICEF
United Nations Children’s Fund
USAID
United States Agency for International Development
VAD
vitamin A deficiency
VIP
ventilated improved pit
INTRODUCTION AND SURVEY METHODOLOGY
1
he 2015 Afghanistan Demographic and Health Survey (AfDHS) was implemented by the Central
Statistics Organization (CSO) and the Ministry of Public Health (MoPH). Data collection took
place from June 15, 2015, to February 23, 2016. ICF provided technical assistance through the
DHS Program, which is funded by the United States Agency for International Development (USAID) and
offers financial support and technical assistance for population and health surveys in countries worldwide.
The United Nations Children’s Fund (UNICEF) facilitated the successful implementation of the survey
through its technical support.
1.1 S
URVEY
O
BJECTIVES
The primary objective of the 2015 AfDHS project is to provide up-to-date estimates of basic demographic
and health indicators. Specifically, the AfDHS collected information on knowledge and practice of family
planning, fertility levels, marriage, fertility preferences, child feeding practices, nutritional status of
children and women, childhood mortality, maternal and child health, awareness and attitudes regarding
HIV/AIDS, knowledge about other illnesses (e.g., tuberculosis, hepatitis B and C), and domestic violence.
The information collected through the AfDHS is intended to assist policymakers and program managers in
evaluating and designing programs and strategies for improving the health of the country’s population.
1.2 S
AMPLE
D
ESIGN
The sampling frame used for the 2015 AfDHS is an updated version of the Household Listing Frame,
prepared in 2003-04 and updated in 2009, provided by the Central Statistics Organization (CSO). The
sampling frame had information on 25,974 enumeration areas (EAs).
An EA is a geographic area
consisting of a convenient number of dwelling units that serve as counting units for the census.
The
sampling frame contained information about the location (province, district, and control area), the type of
residence (urban or rural), and the estimated number of residential households for each of the 25,974 EAs.
Satellite maps were also available for each EA, which delimited the geographic boundaries of the area. The
sampling frame excluded institutional populations such as persons in hotels, barracks, and prisons.
The 2015 AfDHS followed a stratified two-stage sample design and was intended to allow estimates of key
indicators at the national level, in urban and rural areas, and for each of the 34 provinces of Afghanistan.
The first stage involved selecting sample points (clusters) consisting of EAs. A total of 950 clusters were
selected, 260 in urban areas and 690 in rural areas. It was recognized that some areas of the country might
be difficult to reach because of ongoing security issues. Therefore, to mitigate the situation, reserve
clusters were selected in all of the provinces to replace the inaccessible clusters. The 101 reserve clusters
that were preselected did not exceed 10% of the selected clusters in the province.
The second stage involved systematic sampling of households. A household listing operation was
undertaken in all of the selected clusters, and a fixed number of 27 households per cluster were selected
through an equal probability systematic selection process, for a total sample size of 25,650 households.
Because of the approximately equal sample size in each province, the sample is not self-weighting at the
national level, and weighting factors have been calculated, added to the data file, and applied so that results
are representative at the national level.
During the household listing operation, more than 70 selected clusters were identified as insecure.
Therefore, a decision was made to carry out the household listing operation in all of the 101 preselected
reserve clusters, which also accounted for the possibility of identifying more insecure clusters during data
collection. Household listing was successfully completed in 976 of 1,051 clusters. Overall, the survey was
successfully carried out in 956 clusters.
11.3 Q
UESTIONNAIRES
Three questionnaires were used for the 2015 AfDHS: the Household Questionnaire, the Woman’s
Questionnaire, and the Man’s Questionnaire. These questionnaires, based on the DHS Program’s standard
Demographic and Health Survey questionnaires, were adapted to reflect the population and health issues
relevant to Afghanistan. Input was solicited from various stakeholders representing government ministries
and agencies, nongovernmental organizations, and international donors. After all questionnaires were
finalized in English, the questionnaires were translated into Dari and Pashto. The survey protocol and the
questionnaires were approved by the ICF Institutional Review Board (IRB) and the Ministry of Public
Health of Afghanistan.
The Household Questionnaire listed all household members and visitors; basic information was collected
on their age, sex, education, relationship to the head of the household, marital status, and, for children
under age 18, parents’ survival status. Data on age and sex were used to identify women and men who
were eligible for individual interviews. The Household Questionnaire also collected information on the
characteristics of the household’s dwelling unit, such as water source, toilet facilities, fuel use, and flooring
materials, as well as on possessions such as durable goods and mosquito nets. In addition, a small sample
of salt was requested from each household, and the sample was tested for iodine content using a rapid test
kit.
The Woman’s Questionnaire was administered to all ever-married women age 15-49 in the selected
households. These women were asked questions on the following topics:
Background characteristics (including age, education, and media exposure)
Birth history and child mortality
Knowledge and use of family planning methods
Fertility preferences
Antenatal, delivery, and postnatal care
Breastfeeding and infant feeding practices
Vaccinations and childhood illnesses
Marriage
Women’s work and husbands’ background characteristics
Awareness and behavior regarding HIV/AIDS and other sexually transmitted infections (STIs)
Adult and maternal mortality
Knowledge, attitudes, and behavior related to other health issues (e.g., tuberculosis, hepatitis,
fistula)
Domestic violence (questions asked of one woman per household)
1.4 P
RETEST
Eleven women and 16 men participated in training to pretest the AfDHS survey protocol over a three-week
period in March 2015. The participants were staff of CSO and MoPH from various departments, including
CSO Field Operations, Database, Census, Sampling, Cartography, and Demography and MoPH
Monitoring and Evaluation. Twelve days of classroom training was provided. The training was led by The
DHS Program staff, supported by the in-country AfDHS core team that translated the sessions into Dari
and Pashto. Furthermore, resource persons from MoPH and UNICEF attended the sessions to provide
technical background on topics such as family planning, reproductive health, child health, and salt testing
for iodine.
The fieldwork for the pretest was carried out in four locations in and around Kabul. There were four teams
deployed: two teams for testing the Dari language questionnaires and two teams for testing the Pashto
language questionnaires. Following the field practice, a debriefing session was held with the pretest field
staff, and modifications to the questionnaires were made based on lessons drawn from the exercise.
1.5 T
RAINING OF
T
RAINERS
The training of trainers was conducted from May 9-13, 2015, for the master trainers, who had earlier
participated in the pretest training in March 2015. The purpose of the training was to prepare the master
trainers for the main training. Seventeen master trainers were selected, based on their performance, from
among the individuals who participated in the pretest. The DHS Program survey manager facilitated the
session, highlighting the concept of adult learning principles and guidelines on conducting effective
training. As the participants had gone through the pretest training and fieldwork, they were well versed in
the components of the AfDHS. The training focused on key components such as interview techniques and
procedures for completing the AfDHS questionnaires; birth history, family planning, and contraceptive
calendar; and completing the vaccination section. The participants worked in groups to develop
teach-backs on these topics using various training techniques. They were encouraged to develop participatory
methods for the training. Several tests were carried out, which also helped them design test questions for
the main training.
1.6 T
RAINING OF
F
IELD
S
TAFF
The CSO recruited and trained 300 people for the main fieldwork to serve as supervisors, field editors,
interviewers, and reserve interviewers. Additionally, five staff from MoPH joined the training to serve as
fieldwork monitors and secondary editors. The field staff main training took place from May 21 to June 13,
2015, at Rana University in Kabul. The training course consisted of instruction regarding interviewing
techniques and field procedures, a detailed review of questionnaire content, instruction on how to
administer the paper questionnaires, mock interviews between participants in the classroom, and practice
interviews with real respondents in areas outside the sample points selected for the survey.
The main fieldwork training was led by the master trainers and backstopped by The DHS Program trainers.
The sessions included discussing concepts, procedures, and methodology of conducting the survey.
supervisors and field editors received additional training in data quality control procedures, fieldwork
coordination, and management.
1.7 F
IELDWORK
Data collection was carried out by 33 field teams, each consisting of one team supervisor, one field editor,
three female interviewers, and three male interviewers. However, the team composition had to be adjusted