Vector AR Implementation for Rain Rate Space Time Series Modeling in Surabaya
Abstract—Site diversity is one of the Fading Mitigation Techniques (FMT) that is a base system design on the nature of rain rate that change to the time and space. However, to get appropriate site diversity needs deep knowledges about rain rate dynamic and statistical characteristic. In this research, rain rate space-time series modeling in 4 rain gauges location studied by using Vector AR (VAR) model. To validate VAR model, it used 3 methods; ecdf graphic comparison, qqplot method and model residual analysis. The result showed that VAR model is correct and appropriate model for rain rate space time series modeling in 4 rain gauges location. These VAR models have good accuracy with Spatial RMSE Mean between 0.273 - 0.763.
Index Terms—Rain rate, rain gauge, space-time series model, Vector AR.
I. INTRODUCTION
In order to countermeasure FMT, it is necessary to have deep knowledges of most dynamic and statistical characteristics of rain rate and rain-induced attenuation which is the main problem at millimeter wave [1].
Addition, to achieve a realible design of wireless communication system operating at these frequencies, it is necessary to evaluate the design in simulation against time series of rain attenuation generated from realistic model [2].
Model based on Regressive (AR) and Auto-Regressive Moving Average (ARMA) processes already have been used to model rain rate [3][4]. The both model can only be used to stasionary time series data and only for univaraite data.
This paper presents a multivariate modeling for spatial rain rate data which used 4 location of rain gauges. Multivariate time series that is suitable and appropriate for these type data is Vector AR (VAR) and Vector ARIMA (VARIMA) modeling [5]. For empirical reason, this paper uses VAR for rain rate modeling.
In order to measure the rain rate, a rain gauge network that comprised of 4 location of rain gauges were installed in the campus area of the Institut Teknologi Sepuluh Nopember in Surabaya, Indonesia. The procedure of VAR modeling was further applied on the 4 location of rain rates data. The
resulting model was tested and validated by comparing the distribution of rain rate to those obtained from measurement. Comparing distribution used 2 method such as ecdf and qqplot, due to these both methods utilize graphical method, to make sure these validation so we use residual analysis method.
Finally, the result show that VAR model is apropriate and corect model for a network of 4 rain gauges. gauges are 8” Tipping Bucket 260-2501 model with integrated HOBO data logger. Four location rain gauge were installed in campus area, the first one (rain gauge A) installed in the toproof of medical center, the second one (rain gauge B) in toproof of electrical engineering department, the third one (rain gauge C) in toproof of library building and the rest one (rain gauge D) in the EEPIS building. The distance between rain gauges listed in table I and the measurement location
All rain gauges have 0.25 mm tipping bucket with 1-minute sampling time. Rain rate measurement in these research were colected from January 2008 to February 2009. From those measurement, there was 65 rain events.
Vector AR Implementation for Rain Rate
Space Time Series Modeling in Surabaya
Sis Soesetijo1, Achmad Mauludiyanto2, Gamantyo Hendrantoro2
1Electrical Engineering Department, Universitas Surabaya
Jalan Raya Kalirungkut Surabaya 60292
E-mail : [email protected]
2Electrical Engineering Department, Institut Teknologi Sepuluh Nopember
Kampus ITS Sukolilo Surabaya 60111
Vector AR Implementation for Rain Rate Space Time Series Modeling in Surabaya
Fig 1. Rain Gauges Network Location at ITS Sukolilo Campus Surabaya
B. Vector AR Model
In its basic form, a VAR consist of a set of K variables yt = (y1t, …,ykt, …..yKt) for k = 1….K. The VAR(p) process is the
defined as
yt = A1yt-1 + … + Apyt-p + CDt + ut (2.1)
with Ai are ( K x K) coeffient matrices for i = 1,…., p and utis
K dimensional process with white noise covariance matrix E(ut u’t) = ∑u . C is coefficient matrix has dimention (K x M)
and Dt is matrix (M x 1).
Equation (2.1) can be rewrited in the lag polynomial form
A(L) = (IK – A1 - …- Ap) as follows :
A(L) yt = CDt + ut (2.2)
III. RESULT AND DISCUSSION
The result of data processing for rain events that occurred between January 2008 and february 2009 are summarized in table II. The result of VAR model on every rain event are shown in the table. It shown that most of rain event yielded an VAR(1) model with percentage of 41.54% and VAR(2) model with percentage of 21.54% . Only rain event on January 21, 2009 has VAR(7) model dan two rain event have VAR(8) model. VAR(5) only has no model for the result. VAR modeling for 65 rain events that analysed in sevent months over 1 year periode measurement exhibit that these model have good accuracy with Spatial Root MSE mean between 0.273 and 0.763. The distribution of VAR(p) model shown in Fig 2.
TABLE II
VARMODEL PERCENTAGES
VAR(p) No. of events %
VAR(1) 27 41.54
VAR(2) 14 21.54
VAR(3) 8 12.3
VAR(4) 8 12.3
VAR(6) 5 7.7
VAR(7) 1 1.54
VAR(8) 2 3.08
Fig 2. VAR(p) model distribution of 65 rain events for rain rates modeling
To prove that these VAR model is correct and appropriate model for these rain gauges network, we need to validate all of VAR model by using ecdf comparison, qqplot comparison and residual analysis. For example, we use rain event data on February 28, 2008. These rain event have 90 minutes duration. ECDF comparison validation exhibit that distribution of the VAR model and the measurement data are very close to each other as shown in Fig. 3.
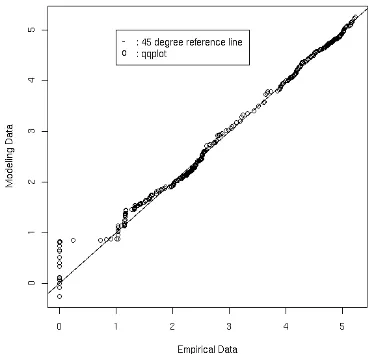
Vector AR Implementation for Rain Rate Space Time Series Modeling in Surabaya Addition, qqplot comparison validation exhibit that
distribution of the VAR model and the measurement data are very close to each other as shown in Fig. 4.
Fig. 4 QQPlot Comparison between VAR model and measurement data
Disadvantages of validation using ecdf and qqplot is that both method used graphical method only, and then to make sure that these VAR model is valid so we need to use residual model analysis. By using this analysis, we proved that the residual of VAR model have white noise properties, null mean and normal distribution. The white noise properties can be shown by using ACF and PACF test and the result shown in Fig. 5.
Fig. 5 ACF and PACF testing for Residual White Noise Properties
The residual of VAR model has approximate normal distribution which could be seen in the Fig. 6.
Model validation using 3 methods for rain event on February 28, 2008 exhibits that VAR(1) model is corect and appropriate model for rain gauge network modeling. Summary, all of VAR model had to check validation by using 3 method that explained above.
Fig. 6. Residual of VAR model has normal distribution
IV. CONCLUSION
An VAR modeling has been developed from the measurement of rain rate on 4 rain gauges network. From the evaluation and validation of the model, it could be concluded that spatial rain rate time series measured in 4 rain gauges network could be approached by the VAR model with more than possible set of parameter values p .
REFERENCES
[1] L.J. Ippolito,”Propagation Effects and System Performance consideration for satellite communications above 10 GHz”, in Proc. IEEE Global Telecommunications Conf. Dec 2-5, 1990, pp 89-91
[2] S. A. Kanellopoulos, A.D. Panagapoulus and J.D. Kanellopoulos,”Calculation of Dynamic input parameter for stochastic model simulating rain attenuation: A Novel matemathical approach”,
IEEE Trans. Antennas Propagation vol. 55 no. 11 pt. 2, pp 3257-3274, November 2007
[3] G. Hendrantoro, A. Mauludiyanto, P. Handayani,” An Auto-Regressive model for simulation of time-varying rain rate”, in Proc Symp Antenna Appl Electromagnetic/URSI Conf, Ottawa, Canada, Jul 20-23, 2004
[4] M.S. Yadnya, A. Mauludiyanto, G. Hendrantoro,” ARMA modeling from rain rate measurement to simulation communication channel modeling for millimeter wave in Surabaya”, in Proc 6th Kumamoto Univ. Forum, Surabaya, Indonesia, Nov 5-6, 2008
[5] Suhartono,”VARIMA and STAR model evaluation for Space-time series forecasting, Journal of Matemathica Alternative Vol. 3 No. 2, 2004
[6] S. Soesetijo, A. Mauludiyanto, G. Hendrantoro,”Rain Cells Size Determination Using Granger Causality Test”, 1st APTECS 2009, ITS Surabaya