An Assessment of the Benefits of
Integrating Family Planning and
Environmental Management Activities in the
Visayas Region of the Philippines
Richard B. Pollnac & Kira Dacanay
May 2011
An Assessment of the Benefits of
Integrating Family Planning and
Environmental Management Activities in the
Visayas Region of the Philippines
Richard B. Pollnac & Kira Dacanay
This document can be found at http://www.crc.uri.edu/. For more information contact:
Coastal Resources Center
University of Rhode Island Narragansett Bay Campus South Ferry Road
Narragansett, Rhode Island 02882, USA Tel: (401) 874-6224
Fax: (401) 874-6920
Email:[email protected]
March, 2011 Coastal Resources Center, University of Rhode Island
Citation:
Pollnac, R.B. and K. Dacanay. 2011. An Assessment of the Benefits of Integrating Family Planning and Environmental Management Activities in the Visayas Region of the Philippines. Coastal Resources Center,
University of Rhode Island.
Disclaimer:
“This document is made possible by the generous support of the American people through the United States Agency for International Development (USAID). The contents are the responsibility of the Coastal Resources Center at the University of Rhode Island as part of the Building Actors and Leaders for Advancing Excellence in Community Development (BALANCED) Project and do not necessarily reflect the views of the United States Government. This document is funded under Cooperative Agreement No. (GPO-A-00-08-00002-00).”
Cover Photo Caption (top): Seaweed Farming group.
Photo Credit: PATH Foundation Philippines INC.
Cover Photo Caption (lower): MPA Meeting consultation and planning
Table of Contents
Page
Coastal Resources Center... 2
Table of Contents ... i
INTRODUCTION... 1
Population and the Environment ... 1
Contextual and Project Process Variables ... 3
Research Hypotheses ... 3
METHODS ... 4
Overview of Methodological Approach ... 4
Sample... 5
Measurement of Variables ... 7
Perceptions of Family Planning and Coastal Resource Management... 7
Perceptions of Changes in Family Planning and Relationship with Resource ... 8
Family Planning Behavior ... 10
Independent Variables... 10
ANALYSIS ... 12
Individual Level Analyses ... 12
Community Level Analysis ... 18
CONCLUSIONS ... 19
INTRODUCTION
The purpose of the research presented here is to further evaluate the assumption that the integrated delivery of reproductive health and environmental management practices in one project results in added-value. Finn (2007:19-20) defines value-added as “results across two or more sectors (e.g. reproductive health and coastal environmental management) in such a way that outcomes go beyond those anticipated if the interventions had been implemented separately.”Here, value-added is defined as meaning that the integration of the reproductive health and environmental management components will enhance the levels of success of each to the extent that their levels of achievement will be greater than if the projects were delivered separately.
A recent paper testing this assumption in Palawan, the Philippines used a
quasi-experimental approach and presented findings suggesting that integrated coastal resource management and reproductive health interventions resulted in greater impacts than such interventions delivered in isolation (D’Agnes, et al. 2010). Other studies, of varying levels of methodological sophistication, have reached similar conclusions. For example, in a controlled, comparative study conducted in Ecuador, Pettit (1999) reports that in six communities with integrated population, health, environment programs (PHE), family planning acceptance more than tripled in comparison to a small (not statistically
significant) decrease in six communities receiving only family planning inputs. D’Agnes (2009) reports that in Nepal, integrated family planning and health interventions
reinforced forest management interventions and created synergistic effects that contributed to improved livelihoods. In a carefully controlled study in Madagascar, changes between baseline (2001) and post-intervention (2004) surveys indicated that in communities participating in the integrated PHE program almost two-thirds of 47 key indicators manifested clearly higher outcomes than in communities not having integrated programs (Kleinau, et al. 2005). Presenting summaries of similar findings, Oglethorpe, et al. (2008) further suggest that the level of integration in activities between sectors (e.g., between population, health, and environment/PHE) positively impacts synergies and benefits in the included sectors. The research presented in the current paper further tests these findings with regard to integrated population and environment programs (IPEP) in the Visayas area of the Philippines.
Population and the Environment
The two primary dependent variables in the research presented here are population and environment; hence, it is important to carefully examine what we know about their interrelationships. The relationship between population growth and marine resource degradation has long been discussed as an issue in the Philippines (Pauly and Chua 1988; Pauly, et al 1989; Pauly 1994), and the negative impacts of population size and density on the environment are widely discussed in the literature (e.g., Cinner, et al. 2009;
Stallings 2009; Cincotta and Engelman 2000; Cincotta, et al. 2000). Nevertheless, there is some controversy concerning these relationships. For example, some research has
relationships between population density and resource conditions. In a previous study in the Philippines, Pollnac and others (2000) found a positive relationship between coral health, as measured by a mortality index, and fisher density and the rate of increase in population density. These surprising findings were explained by Philippine fisher
migration patterns, which show that fishers were migrating from areas with damaged and over-fished reefs to areas with more intact reefs and better fishing; therefore, increasing the population densities in their destinations. Hence, one-time relationships between population density and resource health inside and outside marine protected areas (MPAs) may be misleading due to the dynamic nature of this variable in regions where people are migrating in an attempt to maximize their natural resource harvest.
Additionally, population size needs to be distinguished from population density, since the impacts may vary. With regard to population density, Cinner et al. (2009) found a
negative relationship between fish biomass (a measure of protected area success) and population density. Another study (Pollnac et al. 2010) finds conflicting results with regard to the impact of population density on MPA effectiveness. In the West Indian Ocean sample they found a positive relationship, in the Caribbean a negative relationship, and no relationship in the Philippines. Pollnac and Seara (2010) find no relationship between village population density and MPA success in the Visayas. They report that this could be the result of differences in measurement of the variable. Pollnac and Seara’s interest lies in the density of population within the village—the basic political unit interacting with the MPA. Hence, their measure of population density is village
population divided by village area (in ha). Pollnac, et al. (2010) and Cinner, et al. (2009) use data from the Socioeconomic Data and Applications Center (SEDAC) gridded population of the world database http://sedac.ciesin.org/gpw/global.jsp. The geographic coordinates of field sites in the two studies were overlaid on the gridded population database. The grid cells are 4.66 km2—a size larger than some of the communities in the Visayas and/or the small islands on which they are located. Since Pollnac and Seara (2010) were interested in the density of humans within a village—the density which impacts their interaction behavior—the technique used by Pollnac, et al. (2010) and Cinner, et al. (2009) is not appropriate for their research.
Pollnac and Seara (2010) conclude that some aspect of community population size— beyond its relationship with other variables in the model—has a negative impact on MPA performance. Part of this relationship may be due to overall impacts of population size on coral reefs, fish populations and other marine resources (Stallings 2009; Mora 2008). Although Cinner and McClanahan (2006) find no statistically significant relationships between catch characteristics and population size, McClanahan, et al. (2006), find a negative relationship between population size and ecological outcomes of protected areas in Papua New Guinea and Indonesia. Similarly, Pollnac and Seara’s findings indicate a relatively strong, statistically significant, negative correlation between village population and the biological component of their MPA success measure. They also find that
community members to work together than it is with smaller populations (Agrawal 2001; Baland and Platteau 1996; Wade 1988). The MPAs in their sample are all community-based MPAs which require a relatively high degree of cooperation between community members to function properly. Community members must agree to obey the rules associated with the MPA as well as observe activities around and in the MPA, report violations, and maintain the boundary markers—well defined boundaries being a characteristic associated with effective governing of the commons (Ostrom 1990).
Clearly, the larger the population, the more difficult it will be to get community members to cooperate in such activities.
The complexity of the interrelationships between population and environmental health suggest that factors other than integrated delivery of programs can influence project impacts. As noted above, population can influence the success of initiatives through its influence on the environment as well as participant cooperation in project activities. Hence, we must examine other variables related to project success if we are to separate out the relative influence of integrated initiatives.
Contextual and Project Process Variables
There are a number of variables that can influence a project’s impact and sustainability. Aspects of environmental management and reproductive health can be conceptualized as innovations in impacted communities, whether they be changes in technology, behavior, attitudes, beliefs or values—they are new (changed, introduced) attributes of community life (Rogers 1996). Recent research on coastal environmental management has indicated that these changes can be influenced by a number of factors which can be classified into two broad categories: contextual and project. Contextual factors include demographic, social, cultural, political, and economic aspects impacting project implementation at the lowest levels of political organization (usually the village and the town where the project is located) where project activities are carried out, here the village (barangay) and its municipal context. Project factors include aspects of project implementation (e.g.,
strategies and tactics) and post-implementation activities (Pollnac, et al. 2010; Christie, et al. 2009; Pollnac, et al. 2005, Pollnac, et al. 2001). Interrelationships between these variables and project impacts and sustainability are usually complex and require multivariate techniques to explore their separate and combined effects (Pollnac, et al. 2010).
Research Hypotheses
Primary hypotheses to be tested are: a) that integration of the reproductive health and environmental management components in a project (Integrated Population Environment Project/IPEP) will enhance the levels of success of each to the extent that their levels of achievement on appropriate indicators will be greater than if the projects were delivered separately; and b) that the degree of integration will positively impact success levels.
METHODS
Overview of Methodological Approach
Ideally, evaluation should take place well after project completion. Evaluations
performed at or immediately after the end of a project are impacted by the recent funding of project activities and provision of inputs, many of which maintain villagers’
enthusiastic participation and perceptions for a short period of time. The ultimate goal of any foreign assistance project should be sustainability of behaviors reflecting project inputs; hence, evaluations should take place at least several years after project completion. The evaluation presented here took place approximately three years following completion of an integrated population and environment project (IPEP).
In the most general sense, the methodological approach involves IPEP villages with non-IPEP villages in terms of changes and differences in selected reproductive health and environmental indicators. The non-IPEP villages, all located in the same general regions of the Visayas as the IPEP villages, can thus be used as controls.
NATURAL
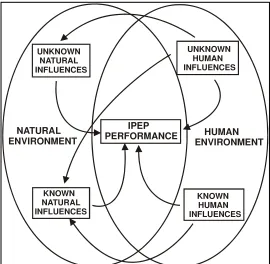
Figure 1. Relationships between variables in evaluation. It is obvious that the project
performance variables
investigated can be influenced by a host of other contextual (both in the human and natural environment) and project variables (a part of the human environment). The method also assessed many of th variables in order to evaluate their individual and combined effects on the performance variables as well as the sustainability of these performance variables (the primary dependent variables, which are the IPEP
performance measures used here). The generalized relationships between these variables are diagrammed in Figure 1.
ese
as possible of these variables should be evaluated to determine their independent and combined effects on project performance measures. Of course, we do not know
everything; that is why both unknown human and natural environmental influences are included in Figure 1 as well as accounted for in the evaluation methodology. The methodology used (statistical) assumes that with a large enough random sample, the effects of the unknowns will be randomized, thus allowing us to determine the effects of the known variables.
Analysis of data will take place at two levels—the individual and the village. At the individual level, we assess numerous aspects of individual knowledge, attitudes, beliefs, values, age, education, family size and
IPEP project participation. This was accomplished using traditional face-to-face survey methodology. At the village level, a number of contextual variables were assessed through interviews of village officials and individuals
associated with the IPEP project and/or those involved in reproductive health and coastal environmental project activities. Some of the analyses will take place using the individual level data and others will focus on the village level data. The village level data will also include summary statistics of the individual survey data (e.g., means, medians, modes as appropriate).
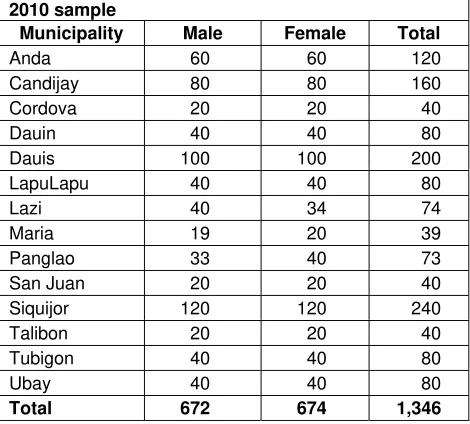
Table 1. Municipalities containing project villages in 2010 sample
Municipality Male Female Total
Anda 60 60 120
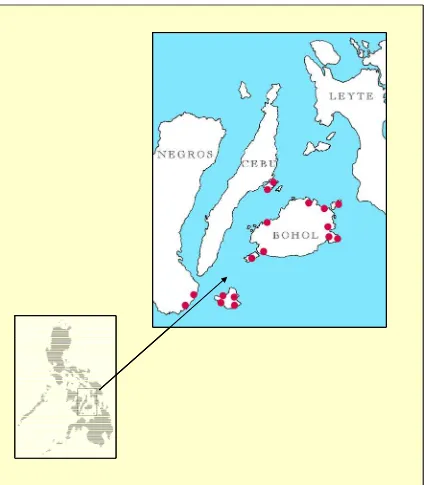
Data is derived from 34 randomly selected IPEP project villages and 18 non-IPEP villages within 14 and nine municipalities, respectively, in the Visayas. Distribution of samples by municipality can be found in Tables 1 and 2. Data for the 2010 sample was collected from January through mid-May 2010, and final coding of the 12 forms was accomplished in late June 2010. Location of municipalities within the Philippines can be seen in Figure 2.
Table 2. Municipalities containing non-IPOPCORM villages in 2010 sample
Municipality Male Female Total
Measurement of Variables
Perceptions of Family Planning and Coastal Resource Management
Perceptions of family planning (FP) and coastal resource management (CRM) are based on earlier program monitoring surveys
conducted by the IPEP implementers in 2003-2004. In the 2003-2004 surveys, 13 statements were read to adult respondents who were requested to agree, agree strongly, disagree or disagree strongly. These items formed part of a Behavioral
Monitoring Survey (BMS, see PATH Foundation Philippines 2004). Eleven of these statements are used in
this report. The process was altered for the 2010 research by adding a middle category of “neither” (see questions in Box 1). Box 1 also includes coding values (in square brackets following response category). These questions will be referred to as BMS scale items.
Box 1. Format of questions concerning respondent perceptions of reproductive health and resource management issues
‐‐The condition of the reefs is still very good in your area and there are still plenty of fish
Disagree strongly[1] Disagree[2] Neither[3] Agree[4] Agree strongly[5]
‐‐Sometimes your family does not have enough food
Disagree strongly[5] Disagree[4] Neither[3] Agree[2] Agree strongly[1]
‐‐Over the past years there has been a decline in fish catch
Disagree strongly[5] Disagree[4] Neither[3] Agree[2] Agree strongly[1]
‐‐Aside from the sea you have other resources to turn to for income Disagree strongly[1] Disagree[2] Neither[3] Agree[4] Agree strongly[5]
‐‐Men need not be involved in family planning
Disagree strongly[5] Disagree[4] Neither[3] Agree[2] Agree strongly[1]
‐‐Your community is helpless in protecting its resources
Disagree strongly[5] Disagree[4] Neither[3] Agree[2] Agree strongly[1]
‐‐Families with more children are better off than families with only a few children
Disagree strongly[5] Disagree[4] Neither[3] Agree[2] Agree strongly[1] ‐‐Adolescents should not have access to family planning information Disagree strongly[5] Disagree[4] Neither[3] Agree[2] Agree strongly[1]
‐‐Your community may soon face a crisis because there are too many people and not enough fish to go around
Disagree strongly[1] Disagree[2] Neither[3] Agree[4] Agree strongly[5] ‐‐Number of children affects your community’s coastal marine resource Disagree strongly[1] Disagree[2] Neither[3] Agree[4] Agree strongly[5]
‐‐Overpopulation is one of the causes of declining fish catch
Disagree strongly[1] Disagree[2] Neither[3] Agree[4] Agree strongly[5]
Although it is possible to analyze responses to these BMS scale items individually, it is more revealing and less tedious to determine if there are underlying dimensions of meaning that could be summarized into meaningful scales. Previous analyses of these types of measures concerning project impacts have indicated that there are
interrelationships between sets of these types of variables that are suggestive of
underlying dimensions of project impact. These dimensions of impact are more general than the individual scales and provide a more efficient and revealing analysis of the data than comparing differences on the numerous individual measures. As a means of
discovering these more general factors, principal component analysis with varimax rotation was used to elucidate patterns of relationships between the 11 indicators in Box 1. The scree test was used to determine the number of components, resulting in three components, which account for a total of 44 percent of the variance in the data set.
planning
individual on each component were created for each individual. The component scores are the sum of the component coefficients times the sample standardized variables. These coefficients are proportional to the component loadings. Hence, items with high positive loadings contribute more strongly to a positive component score than those with low or negative loadings. Nevertheless, all items contribute to (or subtract from) the score; hence, items with moderately high loadings on more than one component (e.g., “Community not helpless to protect resources” in the analysis presented here) will contribute at a moderate level, although differently, to the component scores associated with both components. This type of component score provides the best representation of the data. These component scores are the measures of perceptions of family planning and coastal resource management used in this paper.
Table 3. Principal component analysis of BMS scale items.
1 2 3
Soon too many people for amount of fish 0.734 -0.024 -0.031
Overpopulation is a cause of declining fish catch 0.700 0.080 -0.019
Number of children affects marine resource 0.533 0.153 -0.128
Sometimes family lacks enough food -0.469 -0.112 0.257
Decline in fish catch -0.637 0.012 -0.231
Adolescents should not have access to FP information 0.064 0.686 0.078
Men need not be involved in family planning 0.056 0.653 0.079
Families with more children are better off 0.093 0.604 -0.260
Have resources other than the sea 0.045 0.087 0.694
Marine resource condition good -0.367 -0.183 0.540
Community not helpless to protect resources 0.048 0.449 0.442
Percent variance 19.023 14.068 10.765
Perceptions of Changes in Family Planning and Relationship with Resource
IPEP project. This form of question, a self
anchoring scale, has been found to be valuable in conducing baseline-free post-evaluations of projects (e.g., Pollnac and Pomeroy 2005). In this report, we will refer to these scales as “self-anchoring ladder scales.” The scales used are in Box 2.
Once again, principal component analysis was used to construct scales from these items. In this case, the resource (first three items) and family planning variables (last four items) were analyzed separately since only fishermen responded to the former and women to the latter. Both sets of items resulted in one component for each set.
The results of these analyses are in Tables 4 and 5.
Table 4 indicates that the first and only component accounts for 74 percent of the variance in the resource-related data set. Once
again, factor scores were calculated and these scores are the measures for perceptions of changes in relationships with the resource. Table 5 also indicates only one component which accounts for 61 percent of
the variance in the change in the family planning-related data set. Factor scores for this data set are the measures for changes in family planning.
Table 4. Principal component analysis of CRM changes. 1
Change in empowerment over resources 0.862
Change in fishery compliance 0.841
Change in knowledge of fisher impacts on resource 0.833
Percent variance 71.47
Table 5. Principal component analysis of FP changes. 1
Change in empowerment of women 0.824
Change in availability of contraceptivemethods 0.786
Change in family planning empowerment 0.770
Change in knowledge about family planning 0.750
Percent variance 61.31
Box 2. Descriptions of self-anchoring scale variables
Compliance [1] Fishermen do what they want. No one follows any regulations. [15]
All fishers respect rules and regulations regarding fishing. No one breaks the law.
Empowerment over resources [1] Fishermen have no control over the resources. The government tells them how they are allowed to fish without consulting with the fishermen concerning their knowledge, desires and methods. [15] Fishermen are consulted concerning the fishery and fully involved in developing and enforcing rules and regulations concerning their coastal resources.
Knowledge concerning relationship between human behavior and fish resources [1]
Fishermen have no understanding of how human behavior can have an influence on
Family Planning Behavior
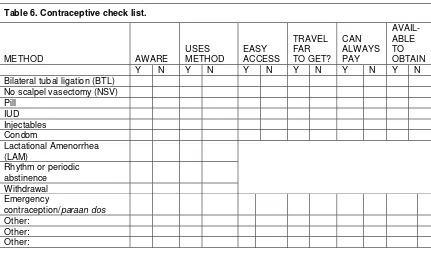
All respondents were questioned concerning knowledge, use, and access to family planning methods. Table 6 was completed for all female respondents.
Table 6. Contraceptive check list.
METHOD AWARE
Bilateral tubal ligation (BTL) No scalpel vasectomy (NSV)
Pill
In the analysis presented in this paper, we only analyze the awareness and use data from the above table. The total number of methods the respondent reported awareness of and use of are used as two of the family planning behavior variables.
Independent Variables
We also investigate the impacts of individual and village level variables that have been found to influence project impacts (e.g., Agrawal 2000; Baland and Platteau 1996; Christie, et al. 2009; Cinner et al. 2009; Cinner and McClanahan 2006; Crawford et al. 2006; Pollnac et al. 2010, 2001, Pollnac and Seara 2010; Rogers 1996). Individual characteristics such as age, education, family size, marital status, number of years residence in the community, number of children, and IPEP project participation were determined by direct questions in the survey. Community level variables such as demographic information, occupational structure, presence/absence of infrastructure items, level of tourism present, frequency of community meetings, number of social groups and religions, village conflict levels, official support for projects, distance to services and project activities were evaluated through interviews with village officials. Most of these variables are self explanatory, but several more complex measures were constructed from the interviews and are described here.
resulting in a scale with a possible range of from 0 to 7. The actual range for interviewees who participated in the project is 1 to 7 (mean=6.3 sd=1.34).
Level of integration of project activities is based on delivery of FP and CRM activities. Where FP and CRM were simultaneously delivered with IPEP support through a local NGO, the level is classified as “High.” Where delivery of the FP and CRM interventions were provided by different institutions, but still considered “integrated”, the level is classified as “Low.”
A quantitative measure of community development is based on three
components of modernization derived
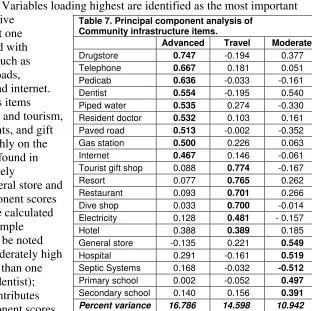
from a principal component analysis of the presence or absence of a series of items concerning village infrastructure and other attributes. These items were analyzed using the principal component technique with varimax rotation. The scree test resulted in selecting three components. The three components account for 41 percent of the variance in the data set (Table 7). Variables loading highest are identified as the most important variables in their respective
components. Component one includes items associated with advanced development such as resident doctor, paved roads, drugstore, gas station, and internet. Component two includes items associated with travelers and tourism, such as resorts, restaurants, and gift shops. Items loading highly on the third component can be found in villages that are moderately
developed such as a general store and schools. Principal component scores on each component were calculated for each village in the sample (standardized). It should be noted that some items load moderately high (0.35 or above) on more than one component (e.g., hotel, dentist); hence, their presence contributes moderately to the component scores
Table 7. Principal component analysis of Community infrastructure items.
Advanced Travel Moderate
Drugstore 0.747 -0.194 0.377
Percent variance 16.786 14.598 10.942
Box 3. Questions concerning implementer (NGO) activities asked in 2010 survey.
1. Prior to the project were fishermen in your barangay consulted concerning their ideas about management of coastal resources? yes[1] no[0]
4. Influence over decisions made concerning project activities?
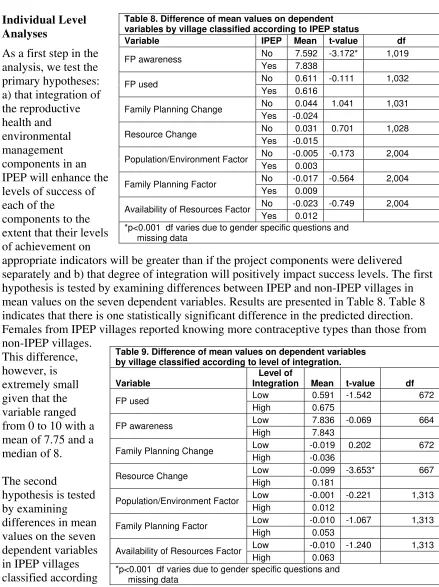
of more than one component. The components are named Advanced, Travel and analysis, we test the primary hypotheses: a) that integration of the reproductive health and environmental management components in an IPEP will enhance the levels of success of each of the
components to the extent that their levels of achievement on
appropriate indicators will be greater than if the project components were delivered separately and b) that degree of integration will positively impact success levels. The first hypothesis is tested by examining differences between IPEP and non-IPEP villages in mean values on the seven dependent variables. Results are presented in Table 8. Table 8 indicates that there is one statistically significant difference in the predicted direction. Females from IPEP villages reported knowing more contraceptive types than those from non-IPEP villages.
Table 8. Difference of mean values on dependent variables by village classified according to IPEP status
Variable IPEP Mean t-value df
Availability of Resources Factor
Yes 0.012
*p<0.001 df varies due to gender specific questions and missing data
Table 9. Difference of mean values on dependent variables by village classified according to level of integration.
Variable
Availability of Resources Factor
High 0.063
*p<0.001 df varies due to gender specific questions and missing data
The second
to low and high levels of integration of project components (FP and CRM). The results of this analysis are presented in Table 9. Once again, there is only one statistically
significant difference in the predicted direction. Fishers in IPEP villages with a higher level of family planning and CRM project integration perceive larger positive changes with regard to aspects of the resource (empowerment regarding marine resources, compliance and knowledge concerning fisher impacts on the resource).
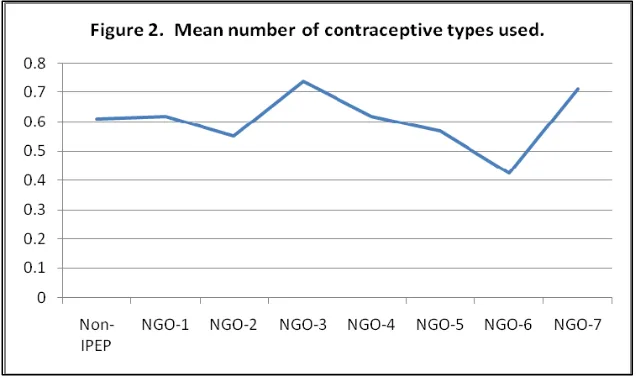
Seven different NGOs were involved in delivery of IPEP inputs; hence, it may be informative to examine differences in NGO impact with regard to the dependent variables. An analysis of variance across the seven NGOs and the non-IPEP villages is presented in Table 10.
Table 10. Village differences on the dependent variables by non-IPEP and NGO.
Village
NGO FP
used
FP Aware
FP Change
Resource Change
Population Environment
Family Planning
Resource Access
Non-
IPEP 0.611 7.592 0.044 0.031 -0.005 -0.017 -0.023
NGO-1 0.619 7.563 -0.597 0.224 -0.186 -0.283 0.012
NGO-2 0.550 7.879 0.333 -0.019 0.182 0.190 0.175
NGO-3 0.737 7.818 0.224 0.002 0.028 0.212 0.143
NGO-4 0.617 8.043 -0.096 0.077 -0.261 -0.362 -0.173
NGO-5 0.567 7.814 -0.178 -0.516 0.290 0.101 -0.341
NGO-6 0.425 7.775 0.325 0.294 -0.295 0.056 0.297
NGO-7 0.710 8.081 0.216 -0.321 0.256 0.378 -0.027
F-Value 1.515 3.738* 13.808* 5.686* 9.164* 14.424* 5.519*
df 7 1026 7 1013 7 1025 7 1022 7 1998 7 1998 7 1998
*p<0.001 df varies due to gender specific questions and missing data
Except for family planning used, the results indicate statistically significant differences
Figure 4. Mean values on family planning and resource changes.
Figure 5. Mean values for components derived from the BMS items.
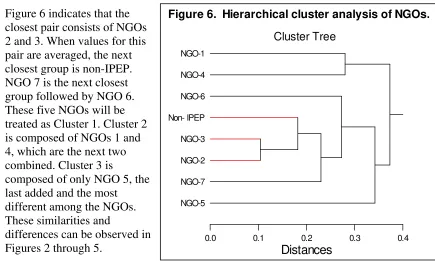
Population/Resource and Resource Access in Figure 5), there appears to be some patterning. Hierarchical cluster analysis (average link, Euclidean distance) of means in Table 10 results in the clustering of NGOs indicated in Figure 6.
Figure 6 indicates that the closest pair consists of NGOs 2 and 3. When values for this pair are averaged, the next closest group is non-IPEP. NGO 7 is the next closest group followed by NGO 6. These five NGOs will be treated as Cluster 1. Cluster 2 is composed of NGOs 1 and 4, which are the next two combined. Cluster 3 is
composed of only NGO 5, the last added and the most different among the NGOs. These similarities and
differences can be observed in Figures 2 through 5.
An analysis of variance across the three clusters is presented in Table 11. Table 11 indicates that there are statistically significant inter-cluster differences on five of the seven dependent variables. The variance within and between the groups analyzed above suggests that other variables we hypothesized above as impacting the dependent variables are having an impact on the seven indicators. The most effective way to determine the relative importance of these predictor variables in terms of their individual and combined ability to account for variance in the project impact component scores is with the use of regression analyses, and most efficiently with stepwise regression analysis.
Table 11. Inter-cluster differences on the dependent variables by cluster
Cluster
*p<0.001 df varies due to gender specific questions and missing data
Cluster Tree
In the application used here, all the hypothesized independent variables (e.g.,gender, age, years residence, marital status, number of children, household size, years education, project participation, NGO activity scale) are intercorrelated with the dependent variable (the specific project impact indicator). The one with the highest correlation (the one that explains the most variance in the project impact indicator component score) is entered first into the multiple regression equation. Then the effects of the entered variable are controlled, and the variable with the highest partial correlation with the project impact indicator component score is entered into the equation. The R2 (squared multiple correlation coefficient, which is equal to the amount of variance explained in the project impact indicator component score) for the two independent variables and the dependent is then calculated. The next step enters the independent variable that has the highest partial correlation with the project impact indicator component score controlling for variables already entered. This stepwise procedure is continued until some pre-set criterion is reached. In this
case, the criterion was that the variable to be entered has a p<0.05. Another criterion was that upon the entry of each new variable into the equation, variables already entered whose beta coefficient dropped below the criterion of p<0.05 were dropped from the equation. Partial correlations were carefully examined at each step to ensure that multi-collinearity did not have an effect on the analysis. The results of these analyses for the seven project impact indicator scores are in Table 12.
Table 12. Regression equations from step-wise multiple regression of independent variables on dependent variables in IPEP villages
Independent variables:gender, age, years residence, marital status, number of children, household size, years education, project participation, NGO activity scale.
Family planning change= -.18age*** +.11marital status** +.12participation** +.33NGO activity scale*** (R2=0.14, p<0.001, N=673)
Resource change= .08marital status* +.10education* -.13NGO activity scale** (R2=0.04, p<0.001, N=665)
Population/Environment = .17gender*** +.08years residence** +.12number of children***
+.07participation* +.16NGO activity scale*** (R2=0.08, p<0.001, N=1308)
Family planning= .10gender*** +.13education*** +.06participation* +.26NGO activity scale*** (R2=0.10, p<0.001, N=1306)
Resource availability= -.37gender***
+.13education*** +.07NGO activity scale* (R2=0.12, p<0.001, N=1308)
Contraceptive awareness = .14age** +.20marital status*** +.17number children** +.21education*** +.17participation*** +.10NGO activity scale** (R2=0.21, p<0.001, N=660)
Contraceptive use= .11years residence** +.35marital status*** +.09participation* (R2=0.16, p<0.001, N=672) _____________________________________________
Standardized beta weight p: ***p < 0.001, **p<0.01,
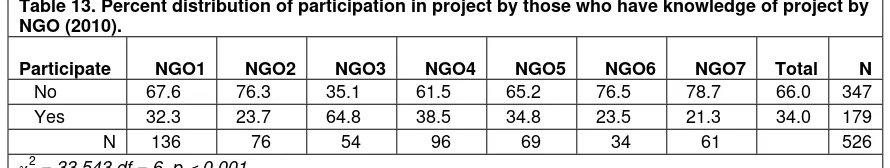
Table 13. Percent distribution of participation in project by those who have knowledge of project by
All the regressions are statistically significant (p<0.001), and project participation and NGO activity score have significant beta weights in five of the seven analyses. Hence, project participation appears to be an important predictor of individual scores on the five of the seven indicator questions and should be examined in more depth. Overall, only 13 percent of IPEP villagers participated in the project and percent participation varied significantly between implementing NGOs. Table 13 compares percent participation by
NGO among the 39 percent who remembered or knew of the project. Table 14 compares
mean scores on it is important to determine factors influencing project participation. To
accomplish this, a stepwise binary logistic regression was conducted using the same independent variables indicated in Table 12. The results of this analysis are in Table 15.
The binary, logistic
regression analysis indicates that single individuals with fewer children and a lower level of education living in a
Table 14. Difference of mean values on dependent variables by project participation.
Variable Participation Mean t-value df
Non-participant 7.736 -5.816*** 664
FP awareness
Participant 8.484
Non-participant 0.581 -3.549*** 672
FP used
Participant 0.837
Non-participant -0.059 -2.296* 672
Family Planning Change
Participant 0.198
Non-participant -0.036 -1.538 667
Resource Change
Participant 0.125
Non-participant -0.028 -2.947** 1,313
Population/Environment Factor
Participant 0.202
Non-participant -0.007 -1.508 1,313
Family Planning Factor
Participant 0.113
Non-participant 0.028 1.521 1,313
Availability of Resources Factor
Participant -0.092 ***p<0.001, **p<0.01, *p<0.05 df varies due to gender specific
questions and missing data
Table 15. Step-wise binary logistic regression: dependent
variable = project participation.
Independent variable Estimate
activity scale manifests a higher value are more likely to be project participants. Although statistically significant, the
Naglekerke‘s R-Square (0.063) is relatively small. Community level analyses might provide a better context for analysis.
Community Level Analysis
While some individual level variables are associated with project participation, it has been found that the community context also impacts this important variable (Pollnac, et al. 2010).
Table 16 presents zero-
order correlations between percent project participation and a number of community level variables that have been found to impact project participation and success (e.g., Agrawal 2000; Baland and
Platteau 1996; Christie, et al. 2009; Cinner et al. 2009; Cinner and McClanahan 2006; Crawford et al. 2006; Pollnac et al. 2010, 2001, Pollnac and Seara 2010; Rogers 1996).
Table 16 indicates a negative relationship between village population size and percent participation. Conversely, there is a positive correlation between population density and
participation. Higher levels of
project integration increases participation, and the number of health workers and barangay captains (head of village) supportive of the marine reserve component of the IPEP project appears to lower participation.
Table 16. Zero order correlations between selected independent variables and percent project participation in IPEP villages.
Independent Variable % Project
Participation
Project Integration 0.415*
Project process scale -0.213
Number of children 0.237
Population 2007 (1-tail test) -0.316*
Percent population change -0.183
Population density 0.533**
Household size 0.119
Education level -0.278
Distance to municipal center 0.195
In migration -0.330
Out migration 0.120
Village leadership instability 0.289
Municipal leadership instability -0.168
Percent Catholic -0.266
Number of religions -0.201
Percent fishers 0.291
Number of occupations 0.008
Prior alternative income project 0.138
Advanced Development -0.259
Travel Development -0.250
Moderate Development 0.222
Distance to doctor 0.213
Distance to hospital -0.116
Number of health workers -0.484**
Tourism present -0.105
Number of community groups 0.021
Village meeting frequency -0.018
Village conflict level 0.101
BC1 level of support for family planning -0.012
BC1 level of support for marine reserve -0.367*
**p<0.01 *p<0.05; N varies between 31 and 34 due to
missing data. 1BC = barangay captain.
better; adjusted R2=0.667, p<0.001, N=31(standardized beta weights). This indicates that percent participation is positively impacted by village population density and level of IPEP integration and negatively impacted by percent Catholic and village population size.
CONCLUSIONS
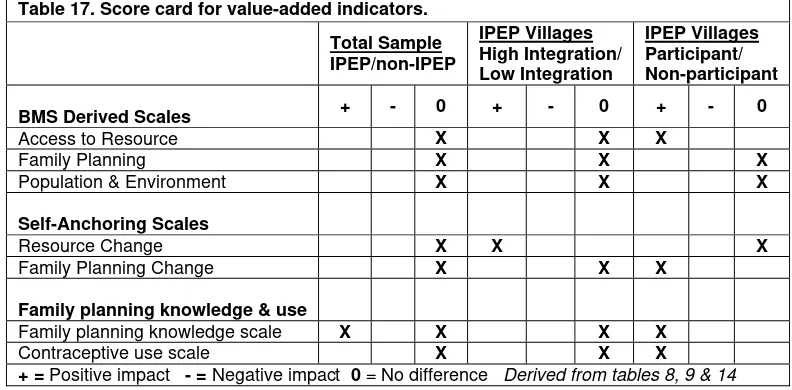
Impacts of primary independent variables on the seven value-added indicators are found in the first two columns of Table 17. IPEP villagers score higher on one of the indicators (the Family Planning Knowledge Scale) than the non-IPEP villagers, and a higher level of project integration has a positive impact on the Resource Change Scale. Multivariate and bivariate analyses of individual level variables, however, indicate that project participation is an important variable that significantly impacts these scores. This is clearly indicated in the third column of Table 17, which indicates that participants score higher on four of the seven scales. Regression analyses also indicate that participation contributes significantly to scores on five of the seven scales (Table 12).
Table 17. Score card for value-added indicators.
Total Sample IPEP/non-IPEP
IPEP Villages High Integration/ Low Integration
IPEP Villages Participant/ Non-participant
BMS Derived Scales + - 0 + - 0 + - 0
Access to Resource X X X
Family Planning X X X
Population & Environment X X X
Self-Anchoring Scales
Resource Change X X X
Family Planning Change X X X
Family planning knowledge & use
Family planning knowledge scale X X X X
Contraceptive use scale X X X
+ = Positive impact - = Negative impact 0 = No difference Derived from tables 8, 9 & 14
Scores on the value-added indicators also differ significantly between implementing NGOs (Table 10). What is it about implementing NGO that impacts project performance? Some of the variation may be due to differences in NGO implementing procedures
concerning participation and transparency—two factors included in the NGO Activity Scale, which is positively related to five of the value-added indicators (see table 12) as well as project participation (Table13).
it is more difficult to get community members to participate together than it is with smaller populations (Agrawal 2001; Baland and Platteau 1996; Wade 1988). Hence, we would predict the negative relationship. The negative relationship between percent Catholic and project participation is easy to explain—the Church’s negative view of contraception is probably sufficient to depress participation in communities characterized by a high percentage of Catholics.
The strong positive relationship between population density and participation is a bit harder to explain. Perhaps it is easier to contact more people in more densely populated communities? Perhaps living in more densely settled communities increases the salience of the need for family planning as well as the impacts of humans on the natural
environment—both concepts related to the goals of an integrated population and environment project. More research is needed to resolve these interpretations; perhaps both are valid. Finally, the positive relationship between degree of integration of IPEP and project participation suggests that the recognition of and focus on the relationship between the two variables—population and environment—provides a compelling image that attracts participants.
The above makes it clear that project participation is a key to achieving the goal of an integrated population and environment project—enhanced levels of success of each component to the extent that levels of achievement will be greater than if the project components were delivered separately. However, if the impacts do not diffuse much beyond the participants, as appears to be the case in the present research, it is important to focus on the diffusion of these important family planning and environmental management practices in future projects. Then, we will truly achieve added-value among a majority of the target population not just the few participants that characterize most projects.
In sum, important findings of this research suggest that benefits resulting from integrated PHE approaches can be achieved under certain conditions. Key factors influencing the degree of benefits include level of participation in integrated projects and how NGOs implement these projects. In addition, there are also several inherent non-project related factors at the community scale and of individual participants that may also influence impacts. This suggests the need to tailor strategies based on place-based context and personal characteristics of different participants. Caution should be taken on assuming that these results are representative of all PHE projects around the world, and may not apply anywhere outside of the Visayas region of the Philippines or beyond this one project implementation approach. With this caveat in mind, in order to strengthen value-added benefits, future integrated PHE initiatives, especially in the Philippines and using a similar project approach, should:
• Stimulate more project participation, with special efforts in larger, less dense communities and tailor strategies better to different targeted populations within the community.
site-specific implementation that encourages implementing NGOs to increase transparency and use more participatory processes.
• Ensure that equal capacity and emphasis are applied to the different components (e.g., population, health, environment) of the integrated project. The final reports provided by the NGOs were quite different in content and quality and could not be used to determine levels of integration across the different sectors, so this important variable as suggested by Ogelthorpe et.al. (2008) could not be evaluated, but should be a focus of further value-added research on integrated PHE projects.
• Identify individual and community differences in target populations. Adapt strategies and activities to different categories of the villages and population, acknowledging that some communities may need additional project resources to achieve similar results and that some types of individuals may also require specialized or more intensive interventions to attain similar results.
• Since the final reports provided by the NGOs were quite different in content and quality and could not be used to determine processes used to encourage participation and transparency, redesign standardized reporting and use common indicators in reports that implementing NGOs provide, making sure to include detailed information on those processes that are considered important determinants of successful value-added benefits. These should include activities and strategies used to: 1) encourage participation, 2) produce transparency of activities, and 3) enhance degree of integration of the different sectors. These reports should also provide detail on the content of training and all other activities.
REFERENCES CITED
Agrawal A. (2001) Common property institutions and sustainable governance of resources. World Development 29:1649-1672.
Baland, J.M. and J.P. Platteau (1996) Halting degradation of natural resources: Is there a role for rural communities? Clarendon Press, Oxford, 423pp.
Cardillo, M., A. Purvis, W. Sechrest, J.L. Gittleman, J. Bielby and G. Mace (2004) Human population density and extinction risk in the world's carnivores. Public Library of Science: Biology:2(7).
Christie P., R.B. Pollnac, E.G. Oracion, A. Sabonsolin, R. Diaz and D. Pietri (2009) Back to Basics: An Empirical Study Demonstrating the Importance of Local-Level Dynamics for the Success of Tropical Marine Ecosystem-Based Management. Coastal Management 37: 350-373.
Cincotta, R. and R. Engelman (2000) Nature's Place: Human Population and the Future of Biological Diversity. Washington, DC: Population Action International. Cincotta, R., J. Wisnewski, and R. Engelman, (2000) Human population in the
biodiversity hotspots. Nature, Vol 404, 27 April 2000, p 991.
Cinner J., T. McClanahan, T. Daw, N.A.J. Graham J. Maina, S.K. Wilson and T.P. Hughes (2009) Linking social and ecological systems to sustain coral reef fisheries. Current Biology: 19: 206-212.
Cinner J. and T. McClanahan (2006) Socioeconomic factors that lead to overfishing in small-scale coral reef fisheries of Papua New Guinea. Environmental
Conservation 33:73.
Crawford B., M. Kasmidi, F. Corompus and R.B. Pollnac (2006) Factors influencing progress in establishing community based marine protected areas in Indonesia.
Coastal Management 34:39-64.
D’Agnes, L., H. D’Agnes, B.J. Schwartz, Amarillo, M.L. and J. Castro (2010) Integrated management of coastal resources and human health yields added-value: Evidence from a comparative study in Palawan (Philippines). Environmental Conservation 37(4):398-409.
D’Agnes (2009) The Population, Health and Environment (PHE) Pathway to Livelihoods Improvement: Lessons and Best Practices from Nepal. Nepal: USAID.
Finn, T. (2007) A guide for Monitoring and Evaluating Population-Health-Environment Programs. Washington, DC: USAID and MEASURE Evaluation.
Kleinau, E., O. Randriamananjara and F. Rosensweig (2005) Healthy People in a Healthy Environment: Impact of an Integrated Population, Health, and
Environment Program in Madagascar. Washington D.C.: USAID Environmental Health Project.
McClanahan, T., M.J. Marnane, J.E. Cinner and W.E. Kiene (2006) A comparison of marine protected areas and alternative approaches to coral-reef management.
Current Biology 16, 1408–1413.
Mora, C. (2008) A clear human footprint in the coral reefs of the Caribbean. Proceedings of the Royal Society of Biology. 275: 767-773.
Oglethorpe, J., C. Honzak and C. Margoluis (2008) Healthy People, Healthy Ecosystems: A Manual on Integrating Health and Family Planning into Conservation Projects. Washington DC: World Wildlife Fund.
Ostrom E. (1990) Governing the commons: The evolution of institutions for collective action. Cambridge University Press, Cambridge, 302pp.
PATH Foundation Philippines (2004) BMS Consolidated Report 2003-2004: Integrated Population and Resource Management (IPOPCORM) Behavioral Monitoring Surveys. PATH Foundation, Philippines, Inc., Manila.
Pauly, D. (1994) From growth to Malthusian overfishing: stages of fisheries resources misuse. South Pacific Commission Traditional Marine Resources Management and Knowledge Information Bulletin (3): 7-14.
Pauly D, G. Silvestre and I.R. Smith (1989) On development, fisheries and dynamite: a brief review of tropical fisheries management. Natural Resource Modeling 2(3):307–29.
Pauly, D. and T.E. Chua (1988) The overfishing of marine resources: socioeconomic background in Southeast Asia. Ambio (17) 3:200-206.
Pettit, J. (1999) Integration of Population and Environment II: Ecuador Case Study. Oklahoma City: World Neighbors, Inc.
Pollnac R.B., P. Christie, J.E. Cinner , T. Dalton, T.M. Daw, G.E. Forrester, N.A.J. Graham, and T. McClanahan (2010) Marine reserves as linked social-ecological systems. Proceedings of the National Academy of Science107(43):1862-1865. Pollnac R.B., J. McManus, A.E. del Rosario, A.A. Banzon, S.G. Vergara and M.L.G.
Gorospe (2000) Unexpected relationships between coral reef health and socio-economic pressures in the Philippines: ReefBase/RAMP applied. Marine and
Fresh Water Research 51:529–533.
Pollnac R.B. and T. Seara (2010) Factors influencing success of marine protected areas in the Visayas, Philippines as related to increasing protected area coverage.
Environmental Management, DOI 10.1007/s00267-010-9540-0.
Pollnac R.B. and R.S. Pomeroy (2005) Factors influencing the sustainability of integrated coastal resources projects in the Philippines and Indonesia. Ocean &
Coastal Management 48:233–251.
Pollnac R.B., B.R. Crawford and M.L.G. Gorospe (2001) Discovering factors that influence the success of community-based marine protected areas in the Visayas, Philippines. Ocean and Coastal Management 44: 683-710.
Rogers E.M. (1996) Diffusion of Innovations. The Free Press, New York Stallings C.D. (2009) Fishery-independent data reveal negative effect of human
population density on Caribbean predatory fish communities. PLoS ONE. 4(5):e5333
Tabachnick, B.G. and L.S. Fidell (2007) Using Multivariate Statistics (5th Edition). Boston: Pearson Education, Inc.
Coastal Resources Center
University of Rhode Island Narragansett Bay Campus South Ferry Road
Narragansett, Rhode Island 02882 USA
Tel:(401) 874-6224 Fax:(401) 874-6920
Web:www.crc.uri.edu
Coastal Resources Center
University of Rhode Island Narragansett Bay Campus South Ferry Road
Narragansett, Rhode Island 02882 USA
Tel:(401) 874-6224 Fax:(401) 874-6920