Full Terms & Conditions of access and use can be found at
http://www.tandfonline.com/action/journalInformation?journalCode=vjeb20
Download by: [Universitas Maritim Raja Ali Haji] Date: 11 January 2016, At: 21:53
Journal of Education for Business
ISSN: 0883-2323 (Print) 1940-3356 (Online) Journal homepage: http://www.tandfonline.com/loi/vjeb20
On the Relationship Between Students’
Perceptions of Teaching Quality, Methods of
Assessment, and Satisfaction
Kamal Smimou & Darren W. Dahl
To cite this article: Kamal Smimou & Darren W. Dahl (2012) On the Relationship Between Students’ Perceptions of Teaching Quality, Methods of Assessment, and Satisfaction, Journal of Education for Business, 87:1, 22-35, DOI: 10.1080/08832323.2010.550339
To link to this article: http://dx.doi.org/10.1080/08832323.2010.550339
Published online: 21 Nov 2011.
Submit your article to this journal
Article views: 763
View related articles
CopyrightC Taylor & Francis Group, LLC ISSN: 0883-2323 print / 1940-3356 online DOI: 10.1080/08832323.2010.550339
On the Relationship Between Students’ Perceptions
of Teaching Quality, Methods of Assessment, and
Satisfaction
Kamal Smimou
University of Ontario Institute of Technology (UOIT), Oshawa, Ontario, Canada
Darren W. Dahl
University of British Columbia, Vancouver, British Columbia, Canada
Although the relationship between students’ perceptions of quality of teaching and student satisfaction may seem self-evident, the interaction between these concepts and related methods of assessment is rarely examined. The findings reveal that the perceived teaching quality categorization emerges as a concept with multiple facets centered on learning, enthusiasm, interaction and student engagement, communications, and practical relevance. The authors note significant links among students’ satisfaction, their feeling reactions on various levels, and their evaluations of teaching and instructors under various assessment schemes.
Keywords: academic achievement, assessment methods, educational assessment, higher edu-cation management, motivation, perception of teaching quality, student satisfaction, teaching, teaching excellence
Over the last couple of decades, a number of major uni-versities have established a center for teaching excellence in an effort to support and develop teaching resources and to demonstrate ideal practices for teaching methods. Some universities have established centers that are committed to the development of teaching excellence in the broader sense, wherein both new and seasoned instructors may find fresh ideas and strategies for teaching. Others have created insti-tutions with a narrower focus, delving further into a specific issue pertaining to teaching and learning. As a result of this trend, teaching quality (or excellence) has become an essen-tial component of the university brand, in addition to the stan-dard expectation of research productivity. Some estimates in the 1990s showed that almost 70% of two-year colleges and liberal arts institutions and 96% of research universities surveyed had awards or a program honoring excellence in teaching (e.g., Zahorski, 1996).1
Correspondence should be addressed to Kamal Smimou, University of Ontario Institute of Technology (UOIT), Faculty of Business and IT, 2000 Simcoe Street N., Oshawa, Ontario L1H 7K4, Canada. E-mail: kamal. [email protected]
Although many research studies have documented useful ideas and practical methods for effective teaching, we deem that the relationship among methods of assessment, student satisfaction, and their perceptions about teaching quality has not been studied sufficiently. Methods of assessment defined as teaching practices used to judge how well a student has performed in class, based on various measures as determined by the teacher or the educational system to assess students’ achievements, operationally fall into three main categories: instructor, student–peer, or self-assessments. Student satis-faction is defined as emotional or cognitive response or reac-tion to the learning experience. Perceived teaching quality is defined as students’ perception about the teaching enterprise, and it is directed toward focal aspects of teaching and deter-mined by student feedback questionnaires or personal inter-actions. How these assessment tools should be used to en-hance effective teaching and students’ satisfaction and their perceptions about the quality of teaching is a noticeable gap in the research (Bartels, Bommer, & Rubin, 2000; Beatty, 2004; Bensimon, 1995; Hiller & Hietapelto, 2001).
Student performance instruments or assessment methods for learning have long been a major focus of theory and research in business education and educational psychology (Hwang, Kessler, & Francesco, 2004; Pintrich, 2003). Given
the primary focus of students and parents on the end result of the learning journey, it may have been expected to see corresponding interest on the part of instructors and higher education administrators in performance instruments, as they have a significant impact on students’ perceptions regarding teaching quality or teaching excellence.2
The purpose of the present study was to extend the assess-ment and evaluation of students’ performance in two impor-tant complementary directions. In the first we investigated and captured qualitatively and quantitatively how students perceive teaching quality. In the second we examined how they react in terms of satisfaction to different types of as-sessments used in class, and how the use of those various performance schemes reshapes students’ perceptions about teaching quality and influences interactions between their perceptions and the assessment methods.3
Specifically, we examined six major research questions. First, what is the meaning of “quality teaching” for students, and what type of attributes or descriptors do students usually attach to this concept? Second, we believe that student sat-isfaction is potentially influenced by many factors, and we anticipated that satisfaction would vary in response to the choice of assessment method. Thus, we wanted to examine how the choice of instructor evaluation, student–peer eval-uation, and self-evaluation alters students’ satisfaction and perceptions. Third, we examined students’ reactions to some feeling dimensions under each assessment method, and how they may revise their opinions as they learn about the short-comings or limitations of any evaluation scheme. Fourth, we wanted to explore the nature of the link between students’ reactions and the evaluation system in use, together with student ratings of the instructor involved. In other words, we wanted to capture the student ratings shift as the focus moved from instructor evaluation, to student–peer evaluation, to stu-dent self-evaluation. Fifth, does the measure of perceived teaching quality (based on specific descriptors) vary in mag-nitude with chosen assessment method? Sixth, does the use of one or all of the proposed assessment methods predict and influence the perceptions of students regarding teaching quality? Do that impact and the students’ perceptions change in magnitude when we incorporate the university reputation factor?
CONCEPTUAL FRAMEWORK AND RELATED STUDIES
Quality of Teaching
Quality of teaching has become an important touchstone within academia over the past few years. According to Creb-bin (1997), many definitions of quality exist, but few of these address the complexities of teaching itself. Some definitions of quality with respect to business are centered on various descriptors such as a) quality is innate excellence; b)
qual-ity is reflected by the level of some measurable product or service attribute; c) quality is realized when customer sat-isfaction is maximized because the product or service fits its intended use; d) quality is conformance to some expec-tation; and e) quality is performance at an acceptable price (e.g., Tamimi & Sebastianelli, 1996). Research such as this is critical in helping us understand the multifaceted aspects of quality teaching at least from a student-consumer perspec-tive, as there are various conceptions of higher education and quality (Maureen, 2002).
It is important to note that a definition is of no use by itself until there exists a means of measuring it. For this it is possible turn to the same instruments used by other re-searchers to measure teaching effectiveness, hence teaching quality proxy. In his study, Marsh (1991) used the Student Evaluations of Educational Quality (SEEQ), which assesses learning and value, instructor enthusiasm, organization and clarity, individual rapport, group interaction, breadth of cov-erage, examinations and grading, assignments and readings, and workload and difficulty.
Given the fact that the process of involving students to evaluate instructors is ingrained in the academic establish-ment, it not likely that it will be replaced; thus, there is a need for improvement. For example, some estimates indi-cate that 88% of all liberal arts colleges use student ratings for summative decisions, and more than 40% of liberal arts colleges use peer observation for summative evaluation (see Seldin, 1999).4A large percentage of faculty in all disciplines exhibit moderately positive attitudes toward the validity of student ratings and their usefulness for improving the qual-ity of teaching (see Nasser & Fresko, 2002). For example, McKeachie (1997) noted that student ratings are the single most valid source of data on teaching effectiveness (see also Marsh & Roche, 1997).
As illustrated from the literature, there are some common-alities between aspects of measures that address the teaching effectiveness or quality of service to students (proxy teaching quality), thus quantitatively we decided to use for the present study the eight well-known SEEQ5items (Marsh, 1991) to
construct students’ perception teaching quality (PTQ) index. Because students’ expectations matter—expectations about the nature of the knowledge they are gaining—we took the student perspective to better understand this re-lationship. Students’ opinions and reactions coincide with the dimensions of service quality as put forward by Garvin (1984) and with past customer service assessments com-pleted by Zeithaml, Parasuraman, and Berry (1990). To ex-amine the relationship between the performance instruments or method of assessment and students’ perception about teaching quality—based on the eight descriptors—we were guided by the suggestion of Cronbach and Meehl (1995), who specified that validity of a measure is established when the network of constructs pertinent to or underlying the measure is specified and the relationship between them empirically verified.
Assessment Methods
Assessment methods basically determine how well a stu-dent has performed in class, based on various measures as determined by the teacher or the educational system. This could be an overall grade measure of a student at the com-pletion of a course, or perhaps an evaluation at the end of some specific project or activity. Research shows that stu-dent performance and grades are affected by the following: the level of student involvement in the design of the eval-uation process (Hiller & Hietapelto, 2001), their assigned group (Shaw, 2004), teacher behavior when assigning groups and teacher expectations (Hwang et al., 2004), student–peer evaluations (Chen & Lou, 2004), and the type of evaluation technique (Bartels et al., 2000). Presented subsequently is a summary of some studies regarding assessment methods, namely student–peer and student self-evaluations.
Student–peer evaluation. Student–peer evaluation refers to a student being graded by other students of the class he/she is in. This technique is used primarily for group projects and class presentations. Student grades based on peer evaluations are determined by team experiences, which are influenced by many factors. An interesting study done by Ba-con, Stewart, and Silver (1999) showed that clarity of instruc-tions to teams, length of the experience, and self-selection of teammates (which are all teacher-controlled variables) have the most positive impact on team experiences.
The benefits of peer evaluation include using it to solve the problem of uneven performance within groups (Chen & Lou, 2004) and prevent social loafing (Brooks & Ammons, 2003). There is little evidence available against use of student–peer evaluations, although there are concerns that students may give each other bad or good grades for reasons outside their actual performances.
Student self-evaluation. Student self-evaluation is de-fined as students assessing themselves, estimating how much they know or have learned, and estimating the quality of their own work, based on evidence and explicit criteria, for the pur-pose of doing better work in the future (Ross & Rolheiser, 2000). This procedure has some benefits such as reduction of testing development to determine if the desired knowledge was achieved as a result of a course or training (Sitzmann, Ely, Brown, & Bauer, 2010). Even though this evaluation technique is gaining popularity with teachers, in a study done by Gopinath (1999) it did not receive much support for use within formal grading procedures in an MBA course.
Recently, Sitzmann et al. (2010) conducted a meta-analysis to shed light on the validity of self-assessments of knowledge in education. They found that this assess-ment approach has the strongest correlations with two af-fective evaluation outcomes: motivation and satisfaction. Also, they looked at the possibility of methodological factors—potential moderators—influencing the correlation
between self-assessments and cognitive learning. A num-ber of studies have focused on the interaction between self-evaluation and cognitive learning but did not examine the extent to which self-evaluation interacts with reactions, mo-tivation, and self-effectiveness (Sitzmann et al.). However, in the present study we tackled students’ reactions to, mo-tivation for, and perceptions about their learning experience under the self-evaluation scheme vis-`a-vis other evaluation schemes (instructor and student–peer evaluations).
Instructors are aware of the many inherent benefits of us-ing diverse evaluation tools, as evidenced in the previous studies. Aside from the benefits to students, perhaps these tools enhance the quality of teaching as well. However, the mere application of these instruments does not ensure that students will be satisfied with their use. Some students may have concerns regarding the use of some or all of the pre-viously mentioned methods of assessment, but no singular study has tried to address or capture students’ reactions in such cases. This brings us to question about the importance of student satisfaction, which transitions into the methodology and results of this research: Is student satisfaction something that can be addressed together with teaching quality?
The Importance of Student Satisfaction and Its Relation to Quality
The concept of satisfaction is a relatively ambiguous one. It reflects the outcomes of reciprocity that occur between stu-dents and an instructor (Guolla, 1999; Thurmond, Wambach, & Connors, 2002). Assessment of students’ perceptions of quality of service they are receiving from their institutions provides a means of identifying dimensions where student satisfaction is strong and where improvement can or should be made. In agreement with Emanuel and Adams (2006; in which they looked at what students perceive to be quality service offered by instructors), we elected to take a similar position by exploring the students’ perceptions in connection with assessment methods and students’ satisfaction.
Yes, there is some level of objection to the notion of considering student–customer satisfaction in the context of measuring teaching quality in relation to other learning and evaluation instruments. However, the objection appears to stem from a misunderstanding of the wordsatisfaction (of-ten applied inconsis(of-tently) in the context of students and which then falls under the well-known business framework that the customer is always right. Hence the presumption of this misguided notion on the part of academia can trigger an objection against it first and against the student–customer satisfaction notion as well (see Swenson, 1998). In fact, the objection is just semantic in nature because students’ sat-isfaction is relevant in any service institution6 (instructors provide service to students) and does not require or mandate student-dictated curricula or grade changes.
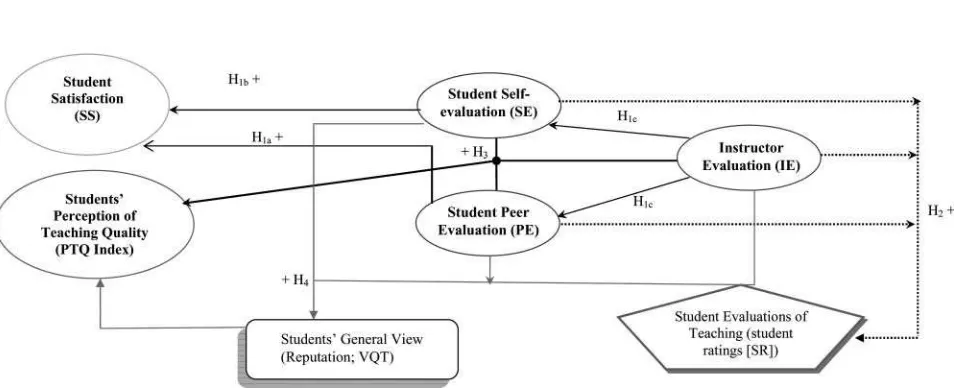
FIGURE 1 Relationship between assessment methods, student satisfaction, and students’ perception of teaching quality.
There is strong documented evidence to support our view as expressed in the present article. Shank et al. (1996) noted that in the future students will behave more similarly to cus-tomers and expect value for money and time spent in the classroom; Wallace (2000) warned that failing to provide sat-isfactory service to students may have negative impacts on enrollment, student retention, funding, job security, and the viability of the university. Many studies have suggested the need for customer service satisfaction as a basis for customer retention, continuous loyalty, and commitment, and they have noted that a number of universities and colleges depend on the student alumni body to raise funds for their future ex-pansion, planning, and research initiatives (e.g., Johnson & Gustafsson, 2000).
Hypothesis Development
Based on the previous discussions, we explored the re-lationship among teaching quality, assessment methods, and student satisfaction. The following represents some of the hypotheses we tested (Cronbach & Meehl, 1995; see Figure 1).
We believe that students’ satisfaction may be influenced by many factors, and we anticipated that their satisfaction would shift in response to the use of any particular assessment method. Thus, we expected that the student–peer evaluation scheme would enhance the learning experience of students. Therefore, students would react with greater satisfaction to peer evaluation than to a self-evaluation (Chen & Lou, 2004; Hiller & Hietapelto, 2001; Sherrard & Raafat, 1994).
Hypothesis 1a(H1a): Student–peer evaluation in the
teach-ing activities would have a greater positive impact on students’ satisfaction than self-evaluation.
Under self-evaluation, students have the ability to assess and grade their own work, assuming they have been given the necessary supports toward the broader objectives of class participation and team projects (Radhakrishnan, Arrow, & Sniezek, 1996). Furthermore, the self-assessment gives stu-dents more confidence in their abilities, makes them take greater responsibility for their work, and fosters positive atti-tudes toward evaluation. Taken together, this suggests that the self-evaluation instruments with explicit criteria given by the instructor would have a greater appeal for the students, thus simultaneously increasing their satisfaction (Hwang et al., 2004).
H1b: Students’ satisfaction would be higher if the instructor
adopts a self-evaluation system in most of the teaching activities.
Because of the learning relationship between instructor and student in a class setting, where the instructor has a primary role, we anticipated that the instructor evaluation would have the highest positive impact on students’ satisfaction (Wagner & Moeffett, 2000).
H1c: Instructor evaluation would have a greater
im-pact on students’ satisfaction than self- or peer evaluations.
H1d: Under an instructor evaluation system, students would
be more highly motivated than with other assessment methods (Ross & Rolheiser, 2000).
Students’ teaching evaluations (student–consumer ratings), by responding to factors that should be related to teaching quality, are crucial in helping instructors improve their teach-ing effectiveness and thereby the teachteach-ing-quality dimension (Smith, 2008). Thus, we anticipated seeing a visible impact on students’ evaluations of instructor teaching, which would depend on adopted assessment method (Bartels et al., 2000; Bol, Stephanson, & O’Connell, 1998).
H2: Students’ evaluations of teaching would decrease as
the instructor moves from instructor evaluation, to student–peer evaluation, to student self-evaluation.
There is a direct and positive link between students’ reactions to the assessment method in use and their evaluation of the instructor involved in that assessment method (Dancer & Dancer, 1992; Wagner & Moeffett, 2000).
Perceived teaching quality can be seen as the prod-uct of a positive teaching experience; we anticipated that students’ perceptions of quality teaching would be pos-itive when the instructors use the appropriate evaluation system to foster that quality. Such appropriate procedures would provide for student involvement in assessment deci-sion making, elicit student awareness regarding performance, ground student goal-setting in accurate data, and, when inte-grated with sensitive instruction, may provide teachers with a powerful lever for enhancing student learning (Falchikov & Boud, 1989; Hwang et al., 2004; Wagner & Moeffett, 2000).
We propose that the use of various performance instru-ments has a predictive role, but the instruinstru-ments differ in im-pact and magnitude upon perceived teaching quality. Thus, we offer the following three alternate complementary hy-potheses:
H3a: The use of an instructor evaluation scheme would have
a higher positive effect on perceived teaching quality.
H3b: The use of a student–peer evaluation scheme would have
a higher positive impact on perceived teaching quality.
H3c: The student self-evaluation system would have a higher
positive impact on perceived teaching quality (Baird, 1987).
Although student assessment methods may positively pre-dict perceived teaching quality when some or all of the three evaluations are used (Wagner & Moeffett, 2000), the presence of a university reputation known to be offer-ing quality teachoffer-ing may increase students’ perception of such, as measured by the eight factors (SEEQ items) out-lined previously. To rule out the possibility of substitution effect—proxy hypothesis—that the general view (or reputa-tion) of the institution may enhance participants’ responses regarding performance instruments, we augmented Hypothe-ses 3a–3c by adding the general view (VQT) to account for its effect on perceived teaching quality, thereby creating Hypothesis 4.
DATA COLLECTION, SURVEY ELABORATION, AND PROCEDURE
Data Collection
Students from two universities were asked to voluntarily par-ticipate in the survey. The data were collected from two dif-ferent institutions (each with a diverse population of students, different size, and different admission requirements) by sur-veying students engaged in a broad range of studies, not only those enrolled in a business program.7Therefore, our results
can be applied toward other university programs as well, and not exclusively that of business and management. At one university (labeled East institution, with a small student pop-ulation of about 5,600 as of September 2008), the surveys were completed in class; these were randomly selected from the pool of all available classes during the academic term, after controlling for repetition. Students were given ample time to complete the survey, and no one had to complete it more than once.
Because of the school’s larger size, students (participants) from the other institution (labeled West institution, with a large student population of about 44,892 as of November 2008) were drawn from the participant pool program of the introductory marketing course. The study was listed on the participant pool website, wherein students were given the option to participate. The survey was completed outside of class in the behavioral experimental labs. We undertook this procedure to preserve the strengths of a controlled study, such as controlling for extraneous noise that makes hypoth-esized effects hard to detect. We are aware that the design presented here may raise some concerns, such as the concern that participants would not react on paper as they would in a real classroom setting. In particular, some of our questions intended to capture emotional reactions to a specific evalua-tion scheme or scenario; thus, some participants might have had difficulty predicting accurately how they would feel in that situation. However, we tried to reduce the impact of this limitation by running the study at two different institutions in different settings.8
Survey Contents
Through the survey procedure, participants had the chance to outline and define their perceptions of teaching quality. We continued the study by creating a survey consisting of three scenarios, followed by three questions intended to cap-ture students’ reactions to an assessment method used in each. We focused on three methods of assessment (student self-evaluation, student–peer evaluation, and instructor eval-uations), which are widely used in many universities. Three questions following each scenario were articulated in line with the following goals: a) to understand student reactions on various levels (happy, satisfied, and motivated); b) to gauge their reactions after introducing a potential negative
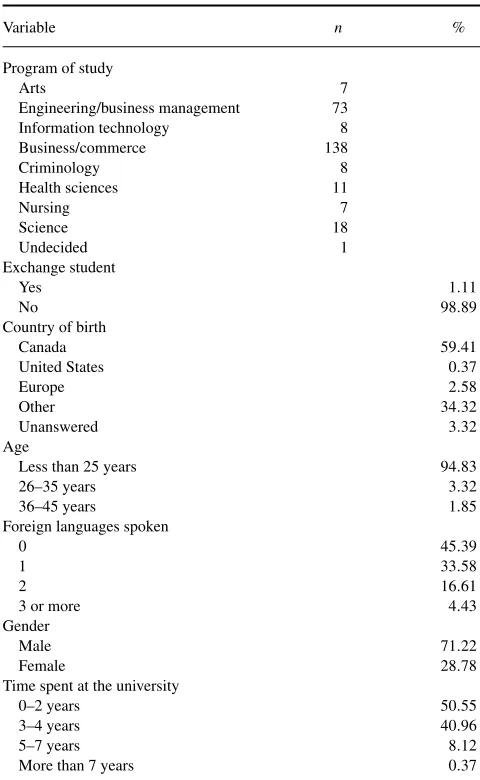
TABLE 1
Information About Participants (n=271)
Variable n %
United States 0.37
Europe 2.58
Time spent at the university
0–2 years 50.55
3–4 years 40.96
5–7 years 8.12
More than 7 years 0.37
attribute associated with the use of that particular assessment method; and c) to identify how students perceive their teach-ing experience within this scenario (usteach-ing open questions). Participants responded to five synthesis questions follow-ing completion of the three-scenario survey. The purpose of synthesis questions was to collect student evaluations of instruction.
Table 1 shows sample structure, together with information regarding the participants. It shows that 72% of participants were men, approximately 90% of all participants had spent between one and four years at the university, and 95% were less than 25 years old, with the majority of them speaking more than one language. It is clear that our sample consisted of young undergraduate students with various cultural back-grounds who were familiar with learning activities at their institutions. We collected 271 surveys (five incomplete sur-veys were rejected). The final sample size was 266, composed of 180 participants from the East institution and 68 from the
West. Psychometrics for the measures showed that all scales and information were reliable and valid; internal consistency measured consistency within the survey.9Based on the
sur-vey, collected responses of participants showed good relia-bility of the instrument used—in this study Cronbach’s al-pha, split-half (odd-even) correlation, and Spearman-Brown prophecy measures were .84, .85, and .91, respectively.
ANALYSIS AND DISCUSSION
Perceived Teaching Quality—Qualitative Approach
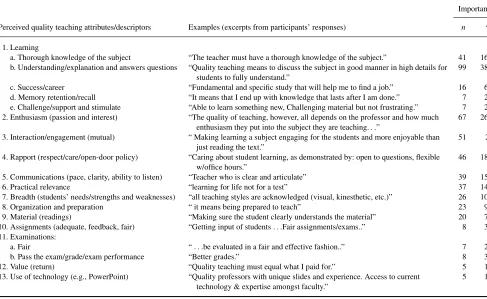
Data were designed to answer several questions. The study’s overarching purpose was to qualitatively capture how stu-dents perceive teaching quality and what type of attributes or descriptors they tend to attach to it. We considered this step essential to our research, as it would allow us to explore qual-ity descriptors free of any preconceived framework of refer-ence as well as double-check to what extent there is agree-ment between the outcome of the narrative component and the data results (in which we relied on the SEEQ framework). Using a simplified content analysis of narrative descriptions of quality provided by participants, we focused on students as the narrative source—as they are the daily observers of instructional quality—for describing their perceptions about quality teaching (see Rapert, Smith, Velliquette, & Garret-son, 2004). We found the most prevalent attribute mentioned by participants to be learning itself (Zeithaml et al., 1990).
There was a special focus on subattributes of teaching, particularly teaching that fosters and engenders full under-standing, offers detailed explanations, and requires the abil-ity of instructors to answer students’ questions. A total of 38.82% of respondents gave these subattributes a high level of importance when defining quality teaching, followed by attributes of enthusiasm (passion and interest), which 26.27% of respondents considered an important ingredient of effec-tive teaching (see Table 2).
Surprisingly, the results challenge the veracity of the anecdotal comments that students are inclined toward bet-ter grades, and that they perceive quality teaching only when they receive higher marks (Pollio & Beck, 2000; Shaw, 2004). In fact, only 3.14% of responses in the present study fell into that category, wherein exam grades were mentioned in their descriptions of quality teaching.
Students’ Perceptions Based on Teaching Quality Factors
For the purposes of measurement and statistical testing, we decided to use the eight well-known SEEQ items and con-struct the PTQ index to quantitatively measure students’ perceptions of teaching quality and examine the level of agreement with the outcome of the narrative component. The overall PTQ index represents the total (not the average)
TABLE 2
Perceived Quality Teaching Attributes by Participants
Importance
Perceived quality teaching attributes/descriptors Examples (excerpts from participants’ responses) n %
1. Learning
a. Thorough knowledge of the subject “The teacher must have a thorough knowledge of the subject.” 41 16.08
b. Understanding/explanation and answers questions “Quality teaching means to discuss the subject in good manner in high details for students to fully understand.”
99 38.82
c. Success/career “Fundamental and specific study that will help me to find a job.” 16 6.27
d. Memory retention/recall “It means that I end up with knowledge that lasts after I am done.” 7 2.75
e. Challenge/support and stimulate “Able to learn something new, Challenging material but not frustrating.” 7 2.75
2. Enthusiasm (passion and interest) “The quality of teaching, however, all depends on the professor and how much enthusiasm they put into the subject they are teaching. . .”
67 26.27
3. Interaction/engagement (mutual) “ Making learning a subject engaging for the students and more enjoyable than just reading the text.”
51 20
4. Rapport (respect/care/open-door policy) “Caring about student learning, as demonstrated by: open to questions, flexible w/office hours.”
46 18.04
5. Communications (pace, clarity, ability to listen) “Teacher who is clear and articulate” 39 15.29
6. Practical relevance “learning for life not for a test” 37 14.51
7. Breadth (students’ needs/strengths and weaknesses) “all teaching styles are acknowledged (visual, kinesthetic, etc.)” 26 10.20
8. Organization and preparation “ it means being prepared to teach” 23 9.02
9. Material (readings) “Making sure the student clearly understands the material” 20 7.84
10. Assignments (adequate, feedback, fair) “Getting input of students. . .Fair assignments/exams..” 8 3.14
11. Examinations:
a. Fair “. . .be evaluated in a fair and effective fashion..” 7 2.75
b. Pass the exam/grade/exam performance “Better grades.” 8 3.14
12. Value (return) “Quality teaching must equal what I paid for.” 5 1.96
13. Use of technology (e.g., PowerPoint) “Quality professors with unique slides and experience. Access to current technology & expertise amongst faculty.”
5 1.96
Note.Table shows responses (n=255) based on the question, “What does quality teaching mean to you?”
scores, which we used to proxy the perceived quality of teach-ing by participants. We deem that this numerical measure is relevant and useful, as it provided us with an overall sense of how students perceived quality and which factors mattered to them in an aggregate sense. The SEEQ items were defined as the following: a) learning: the extent to which students felt they received a valuable teaching experience; b) enthusi-asm: the students’ perception of the instructor’s enthusiasm, humor, and ability to hold the students’ attention; c) organi-zation: the instructor’s organization of the course, including course materials and class presentations; d) interaction: the
perceived degree of encouragement shown by the instructor in class discussions and the sharing of ideas; e) rapport: the extent to which students felt that the instructor was friendly, interested in students, and accessible in or out of class; f) breadth: student perception of the instructor’s inclusion of alternative approaches to the subject; g) assignments: per-ceptions of the value and fairness of graded work; and h) material: the value of the course’s reading requirements in aiding appreciation and understanding of the subject.
Based on Table 3, we note that learning score was the highest factor among the eight SEEQ items, with an average
TABLE 3
Teaching Quality Factors (Student Evaluations of Educational Quality [SEEQ] Items) With the Overall Score (Perceived of Teaching Quality [PTQ] Index)
Factor Learning Enthusiasm Organization Interaction Rapport Breadth Assignments Material Overall (PTQ index)
M
East 4.43 4.21 4.32 3.83 4.26 3.83 4.17 4.06 33.08
West 4.63 4.37 4.51 4.02 4.27 3.76 4.10 4.03 33.70
Both 4.50 4.26 4.38 3.89 4.26 3.80 4.15 4.05 33.28
SD
Both 69.09% 80.47 75.90 98.64 82.21 89.83 84.67 85.56 418.53
Note.Scores were based on a 5-point Likert-type scale ranging from 1 (strongly unimportant) to 5 (strongly important).n=266.The calculated PTQ index represents the perception of each participant vis-`a-vis the eight factors.
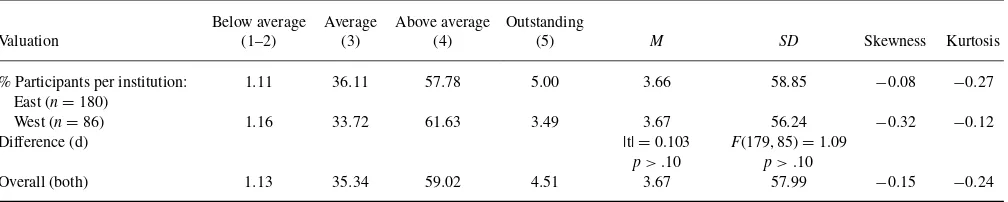
TABLE 4
Reputation or General View of Quality Teaching (VQT) at Their Institutions (n=266)
Below average Average Above average Outstanding
Valuation (1–2) (3) (4) (5) M SD Skewness Kurtosis
% Participants per institution: East (n=180)
1.11 36.11 57.78 5.00 3.66 58.85 −0.08 −0.27
West (n=86) 1.16 33.72 61.63 3.49 3.67 56.24 −0.32 −0.12
Difference (d) |t|=0.103
p>.10
F(179, 85)=1.09 p>.10
Overall (both) 1.13 35.34 59.02 4.51 3.67 57.99 −0.15 −0.24
of 4.50 (maximum of 5). There was a small variability among participants in comparison with other factors (SD=69.09%), and 4.63 for the West institution as compared with 4.43 for the East institution. Regardless of the institution, overall results show the same priority of learning followed by other factors; this result is aligned with the qualitative result in the previous section.
Moreover, the results of our study are considered within the context of other relevant variables, such as the general view of teaching at the institutions (proxy the reputation); we consider it important to include that view empirically.
According to Table 4, although both institutions differed in many aspects (e.g., size, location, admission requirements), the results show a mean score of 3.67 (more than 60% in-dicates above-average quality of teaching at the institution). The ttest failed to reject equality between the means, and the F test failed to reject the equality of related standard deviations between the West and East institutions.
Student Evaluations—Student Ratings of Instruction
Because student evaluations (student ratings) are widely used in most North American colleges and universities to measure teacher performance and effectiveness, we wanted to exam-ine students’ opinions about this process—the collection of student ratings—because we aware that some studies have
raised issues and limitations of using student evaluations to assess teaching quality, emphasizing that students may not have the level of knowledge to properly evaluate instruc-tor effectiveness (e.g., Olshavsky & Spreng, 1995; Wright, 2000).
Table 5 reports the results of three questions that were based on a 7-point Likert-type (Likert, 1932) scale. It appears that the majority of participants were aware of the importance of student ratings in evaluating instructors; only 12.41% did not know about this tool, whereas 70% considered it an im-portant instrument within their institution. However, we no-ticed a low shift in the responses when the students were asked about the importance of these evaluations to the stu-dents themselves. A total of 68.8% of responstu-dents considered student evaluations to be somewhat or very important, and only 13.16% indicated them to be less important. This result lends support to our use of student ratings to discern students’ perspective, in our examination of assessment method under-lying each scenario (McKeachie, 1997). Also given students’ reaction about ratings and their usefulness for improving the quality of teaching, the student ratings process should be ad-ministered in the middle of the term rather than at the end of the course to give ample time for the adjustment of course delivery and teaching technique and to meet course expec-tations; it would allow instructors to address problems and difficulties while the course is ongoing, although an end-of-term evaluation is more traditional. Students actually prefer a
TABLE 5
Perceptions Regarding Student Evaluations of Teaching (Student Ratings)
Question M SD Details
How important student evaluations are in evaluating faculty in your school/university (e.g., tenure, salary increases, retention, promotion)?
5.75 1.51 70% indicated “somewhat important” and more, 7.52% were neutral, and only 10.15%
indicated “somewhat unimportant” and less; 12.41% of participants who picked “do not know response” were not included in the calculation of the mean and standard deviation.
How important student evaluations are to you personally?
5.02 1.40 68.80% indicated that student ratings are “somewhat important” and more while only
13.16% chose “somewhat unimportant” and less, and the rest (18.05%) were neutral. How accurate you think student evaluations are as a
measure of teaching quality?
4.75 1.19 66.54% of participants chose “somewhat accurate” and more, while 15.04% reveal
“somewhat inaccurate” or less, and the rest (18.42%) were neutral.
Note.Student evaluations are administered in almost all Canadian and American colleges and universities for evaluating faculty teaching performance and measuring teaching quality and effectiveness. Scores were based on a 7-point Likert-type scale ranging from 1 (not at all important) to 7 (very important). For the last question, the score was based on a 7-point Likert-type scale ranging from 1 (not all accurate) to 7 (very accurate).
TABLE 6
Scenarios and Results: Reactions (n=266)
Initial reactions to scenario
Subsequent reactions to scenario (after introduction of apossiblelimitation element [negative attribute]) with respect
to the used evaluation system)
Direction and equal mean
tests
Direction and equal mean tests
Dimension Happy (1) Confused (2) Satisfied (3)
Motivated
(4) Happy (5) Calm (6) Satisfied (7)
Happy d1: (1)
Note.Scores were based on a 5-point Likert-type scale ranging from 1 (strongly disagree) to 5 (strongly agree).
midterm evaluation, as opposed to traditional, end-of-course ratings (see Abbott, Wulff, Nyquist, Ropp, & Hess, 1990; Springgay & Clarke, 2007; Wallace, 2000; Marsh & Roche, 1997).10
Three Scenarios and Synthesis Results
ANOVA analysis. As conceptually outlined previously, we addressed the impact of each student performance instru-ment on PTQ and students’ satisfaction. This was done by conducting a scenario survey wherein each of three scenar-ios emphasized a specific assessment method. An analysis of variance (ANOVA) showed the initial and subsequent re-actions to each scenario. Initially, students clearly favored the instructor evaluation system over student–peer evalu-ation, and favored student–peer evaluation over the self-evaluation system. Results for all scenarios show that stu-dents responded positively to a higher level of involvement from the instructor when evaluating work.
Students may become aware of several limitations or shortcomings within each assessment method, such as unfair-ness of peer students toward their colleagues, unfair marks obtained through self-evaluation, or unfair marks resulting from the instructor evaluation. We view these subsequent reactions in an attempt to observe any changes in the fol-lowing three major dimensions: a) happy (defined as a state when someone’s expectations are exceeded, that is, they get much more than expected), b) satisfied (defined as a state when student expectations are met), and c) calm (defined as a state of tranquility when students do nothing). We are aware that being happy and being satisfied are different feelings, and thus we wanted to see if a particular assessment method
would trigger greater enjoyment, as may be the case with self-evaluation. These dimensions can show the importance of a performance instrument or assessment method that enhances the perceptions of students. Anecdotally, students may tend to be happier and more satisfied with self-evaluation, but results show a negative reaction under happy and satisfied categories.11
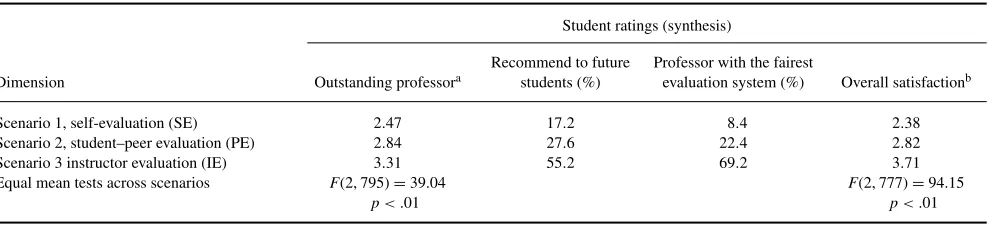
Also, we noticed that students were less motivated with the use of self-evaluation but highly motivated with the student–peer evaluation, and very highly motivated by the instructor evaluation scheme,F(2, 795)= 60.23, p <.01.
This result casts doubt and contradicts the observation about motivation made by Ross and Rolheiser (2000) in which they said that student motivation would be enhanced under self-assessment; however, from students’ perspectives we found that participants were less motivated by this method of as-sessment. Based on ANOVA analysis, we found evidence to supportH1a andH1c, but we found no support for
self-evaluation hypothesis H1b. In another hypothesis (H1d) we
tried to test the motivation of students under various per-formance instruments, and results suggest that students’ sat-isfaction is aligned with their level of motivation. Again, based on Tables 6 and 7, we found support forH2(Chonko,
Tanner, & Davis, 2002, Havelka, Neal, & Beasley, 2003). This result is in direct contradiction with results reported by Baird (1987), who showed a strong correlation between self-assessment, student satisfaction, and ratings of the course instructor. In fact, our results in Tables 6 and 7 show that stu-dents are less satisfied and less motivated under this scheme, and eventually the course instructor adopting that scheme had the lowest ratings and lowest fairest evaluation system, and was slated to be the least recommended instructor to future students.
TABLE 7
Scenarios and Results: Ratings (n=266)
Student ratings (synthesis)
Dimension Outstanding professora
Recommend to future students (%)
Professor with the fairest
evaluation system (%) Overall satisfactionb
Scenario 1, self-evaluation (SE) 2.47 17.2 8.4 2.38
Scenario 2, student–peer evaluation (PE) 2.84 27.6 22.4 2.82
Scenario 3 instructor evaluation (IE) 3.31 55.2 69.2 3.71
Equal mean tests across scenarios F(2, 795)=39.04 p<.01
F(2, 777)=94.15 p<.01
Note.Scores were based on a 5-point Likert-type scale ranging from 1 (strongly disagree) to 5 (strongly agree).
aMean of students’ ratings regarding the professor involved in the evaluating system.bWith this dimension participants, under each scenario, indentified the degree to which the evaluation system improved their satisfaction in the learning process (n=260).
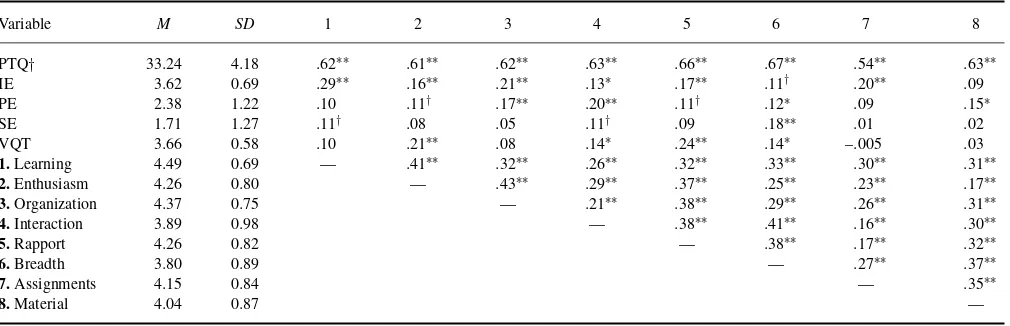
Correlation analysis. Students’ scores on three assess-ment methods were positively correlated with the PTQ index and VQT, with the exception of self-evaluation. As shown in Tables 8 and 9, there was a clear difference between the perceived teaching quality index measured based on the eight factors, and the general view that participants expressed when asked to characterize the quality of teaching at their univer-sity. In fact, we did not observe a high correlation coefficient between them; it was in the order of .18.
Regression analysis results. Table 10 shows the re-sults of the performance instruments and their effect on PTQ. Following the conceptual framework and hypotheses outlined previously, we wanted to see if these tools had a predictor (explanatory power) of perceived teaching quality. Thus, ordinary regression analyses were used to assess the contribution of these tools to the PTQ index. The empirical efforts were achieved using three steps: a) we attempted to regress only one instrument (Models 1–3), b) we regress two instruments (Models 4–6), and c) we attempted to regress all three instruments (Model 7). We also attempted to en-ter the inen-teraction en-terms, but because they were insignificant we did not report them. As expected, the instructor
evalu-TABLE 8
Descriptive Statistics and Correlations Among Study Variables: Zero-Order Correlations (n=266)
Variable 1 2 3 4 5
1. PTQ — .26∗∗ .22∗∗ .13∗ .18∗∗
2. IE — .16∗∗ −.11† .16∗∗
3. PE — .34∗∗ .14∗
4. SE — .11†
5. VQT —
Note.Scores were based on a 5-point Likert-type scale ranging from 1 (strongly unimportant) to 5 (strongly important).
PTQ =perceived teacher quality; IE = instructor evaluation; PE =
student–peer evaluation; SE=self-evaluation; VQT=general view.
†p=.1.∗p=.05.∗∗p=.01.
ation variable emerged as a positive significant (with more explanatory power) predictor of perceived quality teaching. Student–peer evaluation and self-evaluation had significant positive impact but weak explanatory power, thus suggest-ing that other relevant variables were not included. Based on Models 4 and 5, when we alternately entered two instruments, the results suggest that the instructor evaluation scheme had a higher positive significant impact. As presented in Tables 6 and 7, the evidence suggests that instructor evaluation had a more positive impact on the PTQ, whereas the student–peer evaluation scheme contributed only .20 (self-evaluation con-tributed only .19) of the instructor evaluation impact toward PTQ. The absence of interactions between instructor eval-uation and student–peer evaleval-uation (or instructor evaleval-uation and self-evaluation) showed that the highly significant ef-fects of instructor evaluation did not depend on the value of student–peer evaluation or self-evaluation.
It was necessary to rule out the possibility of substitution effect—proxy hypothesis—should the general view (or rep-utation) of an institution contaminate participants’ responses regarding performance instruments and assessment methods. Also, to control for the fact that some participants, notably first- and second-year students, may have prior views before entering a program, we augmented the regression models (1–7 in panel B of Table 10) by introducing the VQT as a control variable following the same steps described for panel A, thus accounting for its effect on PTQ. Surprisingly, af-ter conditioning with VQT, the instructor evaluation variable still displayed a positive significant effect but was lower than the previous reported result in panel A.
We repeated some procedures as in panels A and B but this time by adding some dummy variables to capture differences, if any, based on gender, seniority in the program, and age.12
It was contemplated that some differences across various subgroups of our sample might exist, but we did not see that the perception of teaching quality differed, and there was no difference between senior vis-`a-vis junior (seniority dummy) students’ perceptions about teaching quality. Yet the evidence suggests that instructor evaluation, student–peer
TABLE 9
Descriptive Statistics and Correlations Among Study Variables: Zero-Order Correlations (n=266)
Variable M SD 1 2 3 4 5 6 7 8
PTQ† 33.24 4.18 .62∗∗ .61∗∗ .62∗∗ .63∗∗ .66∗∗ .67∗∗ .54∗∗ .63∗∗
IE 3.62 0.69 .29∗∗ .16∗∗ .21∗∗ .13∗ .17∗∗ .11† .20∗∗ .09
PE 2.38 1.22 .10 .11† .17∗∗ .20∗∗ .11† .12∗ .09 .15∗
SE 1.71 1.27 .11† .08 .05 .11† .09 .18∗∗ .01 .02
VQT 3.66 0.58 .10 .21∗∗ .08 .14∗ .24∗∗ .14∗ –.005 .03
1.Learning 4.49 0.69 — .41∗∗ .32∗∗ .26∗∗ .32∗∗ .33∗∗ .30∗∗ .31∗∗
2.Enthusiasm 4.26 0.80 — .43∗∗ .29∗∗ .37∗∗ .25∗∗ .23∗∗ .17∗∗
3.Organization 4.37 0.75 — .21∗∗ .38∗∗ .29∗∗ .26∗∗ .31∗∗
4.Interaction 3.89 0.98 — .38∗∗ .41∗∗ .16∗∗ .30∗∗
5.Rapport 4.26 0.82 — .38∗∗ .17∗∗ .32∗∗
6.Breadth 3.80 0.89 — .27∗∗ .37∗∗
7.Assignments 4.15 0.84 — .35∗∗
8.Material 4.04 0.87 —
Note.Scores were based on a 5-point Likert-type scale ranging from 1 (strongly unimportant) to 5 (strongly important). PTQ=perceived teacher quality; IE=instructor evaluation; PE=student–peer evaluation; SE=self-evaluation; VQT=general view.
aThe values represent aggregate scores with respect to descriptors underlying perceived teaching quality. †p=.1.∗p=.05.∗∗p=.01.
evaluation schemes, and age of students matters. Evidence in panel D shows that young students (younger than 25 years old) exhibited significant negative difference to perceived teaching quality. In sum, the result in panel A of Table 10 supportsH3a–candH4a–c. The consistent pattern of findings
across the number of regression models suggests that an instructor evaluation scheme blended with other schemes, if used appropriately, may foster a way of learning as well as increase the students’ perceptions manifested by a high perception of teaching quality index.
CONCLUSION, LIMITATIONS, AND FUTURE RESEARCH
The purpose of the present study was to shed light on the rela-tionship between students’ perception of teaching quality and assessment methods, with a special interest in student satis-faction. We found that perceived teaching quality had many attributes or descriptors in the minds of students (consider-ing students as consumers, clients, or partners in the learn(consider-ing process). Such highly regarded descriptors are centered on learning, enthusiasm, interaction and engagement with stu-dents, professor–student rapport, communication skill, and practical relevance. In addition, with these relationships in mind, we can take the position that quality is subsequently realized when customer satisfaction is maximized, and con-strue that teaching quality is high when students are satisfied and the satisfaction is maximized (see also Rapert et al., 2004). Although this relationship between satisfaction and quality seems reasonable, nevertheless we confirm that there is a positive link between them (see Bensimon, 1995).
Furthermore, across the three designed scenarios we found that an instructor evaluation scheme, arguably the most tra-ditional one, was still most satisfactory to students,
fol-lowed by student–peer evaluation. The student–peer eval-uation scheme produced a high level of satisfaction after accounting for possible shortcomings and limitations, yet it was possible to achieve an even higher level of satisfaction when this approach was combined with other instruments to create synergy. By analyzing open questions of the sur-vey to capture reactions of participants to various scenar-ios including the self-evaluation scheme, we understand that students recognized the intrinsic difficulty of accurately self-assessing their performance (see Dunning, Heath, & Suls, 2004). As suggested in past studies, this task is difficult for students lacking the necessary insight to acquire knowledge, interact within the learning environment, and self-evaluate their performance at the same time (Kruger & Dunning, 1999). Thus, students tend to value and assess unfavorably the teaching quality under that scenario; participants’ per-ceptions of teaching quality appeared to be influenced by how they reacted to their learning experience and their bi-ased self-evaluation. Moreover, the results suggest that to improve student satisfaction (which would positively im-pact student ratings [their evaluations of the teacher] and perception of teaching quality), instructors should carefully consider content, shortcomings, and adaptability of each as-sessment method.
Finally, as colleges and universities are committed to im-proving teaching quality, thus collecting student opinions of teaching effectiveness with the use of various standardized rating forms, the present research supports the use of these forms; we found students’ evaluations of teaching (student ratings) to be mostly positive. In addition to the traditional student evaluations of instructor, other methods can enhance teaching quality, such as in-depth interviews of a sample of students to capture the extent of rigor and high expecta-tions (or absence of rigor and low expectaexpecta-tions) and how this
TABLE 10 Regression Analysis Results
Variable\model (1) (2) (3) (4) (5) (6) (7)
Panel A: Results from ordinary least squares (OLS) regression without accounting for the general view of quality variable.
IE 1.963∗∗[0.355] — — 1.809∗∗[0.356] 2.072∗∗[0.353] — 1.928∗∗[0.361]
PE — 0.705∗∗[0.208] — 0.538∗∗[0.202] — 0.646∗∗[0.222] 0.395†[0.216]
SE — — 0.376†[0.202] — 0.507∗∗[0.192] 0.163[0.212] 0.368†[0.205]
Adj.R2 0.10 0.038 0.009 0.121 0.12 0.036 0.128
Panel B: Results from OLS regression after incorporating the reputation factor manifested by general view of the participants about the quality of teaching at their institutions to control for a possible substitution effect.
IE 1.783∗∗[0.358] — — 1.659∗∗[0.358] 1.901∗∗[0.358] — 1.774∗∗[0.365]
PE — 0.623∗∗[0.206] — — — 0.579∗∗[0.219] 0.368†[0.215]
SE — — 0.307[0.199] — 0.450∗[0.192] 0.123[0.209] 0.322†[0.205]
VQT 1.094∗[0.422] 0.430∗∗[0.43] 1.433∗∗[0.434] 0.991∗[0.421] 0.966∗[0.422] 1.319∗∗[0.431] 0.924∗[0.421]
Adj.R2 0.119 0.068 0.045 0.136 0.134 0.066 0.140
Panel C: Results from OLS regression after incorporating the additional dummy variables.
IE 1.598∗∗[0.356] — — 1.44∗∗[0.355] 1.726∗∗∗[0.355] — 1.565∗∗[0.36]
PE — 0.736∗∗[0.208] — 0.615∗∗[0.205] — 0.672∗∗[0.221] 0.482∗[0.218]
SE — — 0.387†[0.199] — 0.513∗∗[0.192] 0.182[0.207] 0.354†[0.204]
D1(Gender) 0.766[0.540] 0.807[0.549] 0.989†[0.554] 0.545[0.537] 0.577[0.538] 0.776[0.55] 0.463[0.537]
D2(Seniority) −0.734[0.488] −0.421[0.501] −0.619[0.504] −0.497[0.487] −0.63[0.484] −0.407[0.501] −0.477[0.485]
D3(Age) −2.80∗[1.09] −3.05∗∗[1.116] −2.653∗[1.126] −3.154∗∗[1.084] −2.87∗∗[1.08] −3.038∗∗[1.11] −3.125∗∗[1.08]
Adj.R2 0.097 0.072 0.042 0.124 0.118 0.071 0.131
Panel D: Results from OLS regression after incorporating the reputation factor manifested by general view of the participants about the quality of teaching at their institutions to control for a possible substitution effect, in addition to the additional dummy variables.
IE 1.441∗∗[0.358] — — 1.327∗∗[0.357] 1.575∗∗[0.36] — 1.442∗∗[0.364]
PE — 0.643∗∗[0.209] — 0.552∗∗[0.206] — 0.596∗∗[0.22] 0.441∗[0.218]
SE — — 0.312[0.198] — 0.449∗[0.194] 0.139[0.205] 0.309[0.204]
VQT 1.06∗[0.425] 1.145∗∗[0.430] 1.276∗∗[0.433] 0.898∗[0.425] 0.908∗[0.427] 1.121∗[0.432] 0.824∗[0.427]
D1(Gender) 0.881[0.537] 0.932†[0.544] 1.11∗[0.548] 0.665[0.536] 0.699[0.538] 0.906∗[0.546] 0.583[0.538]
D2(Seniority) −0.764[0.483] −0.492[0.496] −0.675[0.497] −0.547[0.484] −0.669[0.481] −0.48[0.497] −0.525[0.483]
D3(Age) −2.566∗[1.087] −2.768∗[1.108] −2.386∗[1.114] −2.92∗∗[1.082] −2.661∗[1.08] −2.76∗[1.11] −2.914∗∗[1.08]
Adj.R2 0.115 0.093 0.069 0.136 0.129 0.091 0.140
Note.The dependent variable was perceived teaching quality (PTQ index), the independent variables include IE (instructor evaluation), PE (student–peer evaluation), and SE (self-evaluation). Participants’ general view (VQT) or reputation about quality of teaching at their institutions was used as a control variable. Dummy variables were used to capture the differences based on gender (D1), seniority (time spent at the university; D2), and age (D3). Standard errors are provided in brackets. Coefficients of interaction terms are insignificant and not reported.
†p=.1.∗p=.05.∗∗p=.01.
affected the perceptions of students about a learning experi-ence (Kozub, 2008).
Some limitations of the study, as revealed by the explana-tory power, were related to unexplored variables. When it comes to students’ perceptions of teaching quality, there may be other factors that remain unexamined, as they did not fit within the conceptual and empirical framework of this study. In addition, the sample used in this study could be viewed as limited, but we believe that any institution effect or program effect biases were successfully reduced. This was accomplished by conducting the survey and collecting the data from two different institutions (each with a diverse pop-ulation of students), and by surveying students engaged in a broad range of studies, not only those enrolled in a business program.
Our findings on the use and ranking of various perfor-mance instruments and perceptions of teaching quality put forward many additional questions for further study. For
ex-ample, questions remain as to whether overall student satis-faction with the processes for evaluating their work correlates with the overall satisfaction as presented in this study. What is the role of student motivation? Some students differed in their motivational orientation; would the results change according to these motivational differences? One possible direction for future research was the examination of different motivational orientations that students do exhibit, and investigation into how their orientation shapes their view of teaching quality and eventually satisfaction. In the follow-up research to this study, we determine from students’ perceptions the theoreti-cal and practitheoreti-cal outcome of their preferences in light of their motivational orientations.
Following the age and gender differences we have shown in our results, another extension worth examination is the cultural differences, which may reveal different results when it comes to students’ view regarding instructor or self-or student–peer evaluations. Past studies have shown that
students from Western cultures have a tendency to positively rate themselves (high raters) under a self-evaluation scheme, in contrast to students from Eastern cultures, who have a tendency to negatively rate themselves (low raters) to show humility (e.g., Farh, Dobbins, & Cheng, 1991).
ACKNOWLEDGMENTS
The authors are grateful to the executive editor and an anony-mous reviewer for the excellent comments on the previous draft of the article.
NOTES
1. For example, the Association to Advance Collegiate Schools of Business (AACSB) International accred-itation promotes excellence and assures stakeholders that business schools are subject to review and held to a high level of scrutiny on a continual basis. AACSB International’s site (www.aacsb.edu) states that insti-tutions that earn accreditation confirm their commit-ment to quality and continuous improvecommit-ment through a rigorous and comprehensive peer review.
2. If students are concerned about all the learning ac-tivities and assessments used to evaluate their work, then studying how the use of an assessment method interacts with and reshapes students’ satisfaction and subsequently their perceptions about quality of teach-ing will provide additional evidence to assist in the enhancement of the learning experience (Rapert et al. 2004).
3. In the present study we did not intend to redefine quality in terms of different ratings of satisfaction. 4. Summative decision is used as evidence to sum up
overall performance or status to decide about instruc-tor annual merit pay, promotion, and tenure. This term is the opposite of formative decision, which is used as evidence to improve and enhance the quality of teaching of an instructor (see also Berk, 2005). 5. The SEEQ was developed by Dr. Herbert Marsh of
the University of Western Sydney. Marsh is an inter-nationally recognized expert in the area of psycho-metrics. The SEEQ has been extensively tested and used in many courses, with over 1 million students at the graduate and undergraduate levels.
6. Educational institutions are, by the nature of their job, service institutions. In this context, we assume the def-inition of teaching quality is what the customer says it is. Successful service organizations are normally those that strive to provide quality service and value, and count on the contributions of all their members to achieve stated objectives.
7. Due to space limitation, further detail about charac-teristics of each institution were not provided here but are available on request.
8. Because the survey requires the use of human partici-pants, we requested the ethical approval before collec-tion of the data from Research Ethics Boards at both institutions; certificates of approval were received. 9. A reliability of .80 usually indicates 80% consistency
in the scores that are produced by the survey. 10. In this study, by tracking activities reflective of the
teaching process, we found that only 43.61% of re-spondents had been involved in early feedback forms (midterm evaluation) for professor teaching, and the rest were less involved in this early feedback. A to-tal of 80.38% indicated their participation in the final course evaluations (student rating of teaching) versus almost 20% who did not participate in the final course evaluation (by choice). Additional data about activi-ties of the teaching process were not reported in this study but is available on request.
11. Correlation coefficients between the happy and satis-fied dimensions across scenarios hovered between .60 and .88. The correlation matrix between all responses is not reported but available on request.
12. The gender dummy variable was 1 for female and 0 for male; the seniority dummy variable was 1 for time spent at the university less than or equal to 2 years and 0 otherwise; the age dummy variable was constructed such that it was 1 for age younger than 25 years and 0 otherwise.
REFERENCES
Abbott, R. D., Wulff, D. H., Nyquist, J. D., Ropp, V. A., & Hess, C. W. (1990). Satisfaction with processes of collecting student opinions about instruction: The student perspective.Journal of Educational Psychology, 82, 201–206.
Bacon, D. R., Stewart, K. A., & Silver, W. S. (1999). Lessons from the best and worst student team experiences: How a teacher can make the difference. Journal of Management Education, 23, 467– 488.
Baird, J. S. (1987). Perceived learning in relation to student evaluation of university instruction.Journal of Educational Psychology,79, 90–91. Bartels, L. K., Bommer, W. H., & Rubin, R. S. (2000). Student performance:
Assessment centers versus traditional classroom evaluation techniques. Journal of Education for Business,75, 198–202.
Beatty, J. E. (2004). Grades as money and the role of the market metaphor in management education.Academy of Management Learning and Edu-cation,3, 187–197.
Bensimon, E. M. (1995). Total quality management in the academy: A rebellious reading.Harvard Educational Review,65, 593–611. Berk, R. A. (2005). Survey of 12 strategies to measure teaching effectiveness.
International Journal of Teaching and Learning in Higher Education, 17(1), 48–62.
Bol, L., Stephanson, P. L., & O’Connell, A. A. (1998). Influence of expe-rience, grade level, and subject area on teachers’ assessment practices. Journal of Educational Research,91, 323–331.