203 Gadjah Mada International Journal of Business – September-December, Vol. 17, No. 3, 2015
Gadjah Mada International Journal of Business Vol. 17, No. 3 (September-December 2015): 203-218
* Corresponding author’s e-mail: sinthajkt@yahoo.com
ISSN: 1141-1128
http://journal.ugm.ac.id/gamaijb
Is Physical Evidence Still Valid?
A Study of Low Cost Carriers in Indonesia
Yasintha Soelasih
Atma Jaya Catholic University of Indonesia, Jakarta
Abstract: Physical evidence has been widely accepted as variable that has impact on satisfaction, specifi-cally in airline service. However, this study showed some opposite result for low cost airlines in Indonesia. It revealed that physical evidence has no effect on the passengers’ satisfaction but the fares and its service quality to passengers.’ This study collected sample of 317 passengers from commercial domestic flights at terminal 1, 2, and 3 at Soekarno Hatta airport in Cengkareng, Indonesia. The variables used in this study were: fares, service quality, physical evidence, passengers’ satisfaction levels and repeat buying. Two vari-ables, i.e.: service quality and physical evidence were treated as second order. This study used Structural Equation Modeling (SEM) for verification analysis. The result revealed that there was no effect of physi-cal evidence on the passengers’ satisfaction. It also found that repeat buying demonstrated the passengers’ satisfaction.
Abstrak: Lingkungan fisik telah diterima secara luas sebagai variabel yang memiliki dampak pada kepuasan, khususnya di perusahaan penerbangan. Namun, penelitian ini menunjukkan hasil yang berlawanan untuk penerbangan murah di Indonesia. Ini mengungkapkan bahwa lingkungan fisik tidak mempunyai pengaruh terhadap kepuasan tetapi tarif dan kualitas pelayanan yang mempunyai pengaruh terhadap kepuasan penumpang. Penelitian ini menggunakan sampel sebanyak 317 penumpang penerbangan domestik komersial pada terminal 1, 2, dan 3 di bandara Soekarno Hatta Cengkareng, Indonesia. Variabel yang digunakan dalam penelitian ini adalah: tarif, kualitas pelayanan, lingkungan fisik, tingkat kepuasan penumpang dan penggunaan kembali. Dua variabel, yaitu: kualitas pelayanan dan lingkungan fisik menggunakan dimensi . Penelitian ini menggunakan Structural Equation Modeling (SEM) untuk analisis verifikasi. Hasil penelitian menunjukkan bahwa tidak terjadi pengaruh lingkungan fisik terhadap kepuasan penumpang. Bila terjadi kepuasan penumpang maka akan menimbulkan penggunaan kembali.
Keywords: fares; passengers’ satisfaction; physical evidence; repeat buying; service quality
Soelasih
204
Introduction
The growth of airlines in Indonesia be-gan after the deregulation of the airline in-dustry in 1999. Since then, the growth of the airlines has led to a high level of competition among them and also competition in terms of the service they provide. According to Ministerial Regulation No. 26 of 2010 Con-cerning Tariff Mechanism Formulation and Calculation of Upper Economy Class Passen-ger Air Transportation Services l Domestic Commerce, clause 1 paragraph 9-11, Airlines should provide public transportation, their types of service can be divided into three categories, namely full service, medium ser-vice and no frills serser-vice.
Public transportation (Chase 1978; 1981) generally includes the pure services and high contact. Airlines, on the other hand, can also be viewed with perspective of interac-tion and customizainterac-tion on one side and labor intensity on the other side (Schemener 1986). According to Schmenner (1986: 25), the air-line transportation industry included service factory which had a low degree of interac-tion and customizainterac-tion, as well as a low de-gree of labor intensity. An airline’s emphasis is on its service quality (Chang and Yeh 2002; Liou et al. 2011) so that it can compete with its rivals in the long run. Further, many re-searchers claimed that airline companies us-ing competitive advantage in their rates can-not last for very long, compared to those com-panies using service quality for their custom-ers (Chang and Yeh 2002; Jou et al. 2008).
There are two service quality paradigms, i.e.: the disconfirmation paradigm and the at-titudinal paradigm (Buttle 1996). It is believed that SERVQUAL is based on the adoption of the literature of disconfirmatory customer satisfaction (Parasuraman et al. 1985). Fur-thermore, Parasuraman et al. (1985) showed
the gap between perception and expectation in consumers, by identifying 10 components of the service quality. They continued their research during 1988, which resulted in pro-moting the 10 components of service qual-ity into five dimensions, namely reliabilqual-ity, assurance, tangibles, empathy, and respon-siveness, with a 22 item questionnaire (Parasuraman et al. 1988).
In contrast, Cronin and Taylor (1992; 1994) said that the SERVQUAL paradigm that referred to disconfirmatory satisfaction didn’t succeed. They said that the quality of the services received was because of the at-titude of the consumers towards the perfor-mance of the service, so it was a perforperfor-mance measure that should be used. Therefore, Cronin and Taylor, modified SERVQUAL to SERVPREF.
The quality of service received by con-sumers will affect their satisfaction, retention and positive word-of-mouth (Buttle 1996). Research from Saha and Theingi (2009) proved that the level of the quality of ser-vice provided had a direct impact on air trans-port passengers’ satisfaction. Satisfaction is a subjective matter and can be felt after the purchase and consumption experience (Um et al. 2006). The disconfirmation paradigm can be used as a reference in evaluating or comparing the performance of the products received with the expectation (Um et al. 2006). Kozak (2001b) distinguished that the satisfaction of attitude before the decision could be changed, as a result of the satisfac-tion. Therefore, the notion of satisfaction is that it is the end of the buying decision pro-cess (Um et al. 2006).
passen-205 Gadjah Mada International Journal of Business – September-December, Vol. 17, No. 3, 2015
gers will switch. Indeed, in addition to Rao and Monroe (1989), it is suggested that lower fares should always be supported with good service quality.
The services marketing mix (Lovelock and Wirtz 2011: 47) stated one item that should be focused on in the airlines’ service is the physical evidence or physical environ-ment or ‘servicescape.’ Physical evidence is visual or other good clues that provide evi-dence of the service quality (Lovelock et al 2011: 622). According to Zeithaml et al. (2006), physical evidence was required in service because it could bring satisfaction to the customers. Given that, it can be argued that while service quality will affect customer satisfaction (Baker and Crompton 2000; Wil-liams and Soutar 2009), fares and physical evidence will also do the same (Bitner 1990). The meaning of customer satisfaction is important. Like other service industries, a satisfied passenger (or customer) is more likely to do a repurchase action (Blackwell et al. 2006). From their study, it implied that cus-tomer satisfaction can be measured by the consumers’ evaluation actions after consum-ing products or services. The results of the evaluation lead to a repurchase action when the assessment is positive, and no repurchase action when it is negative. The repurchase action is, by far, the strong indication for a sustainable business. For example, Gupta et al. (2004) indicated that an increase of 1 per-cent in reuse can increase the firm’s value by 5 percent. The same thing was said by Reichheld and Sasser (1990) who showed an increase of 5 percent can increase profits by between 25 percent-85 percent.
Based on the above research, it can be argued that the problem with increased com-petition among airlines has spread not only into fares but also in the service quality, and the physical evidence that causes changes in
satisfaction and repurchase. Thus, the issue to be discussed in this topic is how much in-fluence do fares, service quality and physical evidence have on satisfaction and repeat buy-ing?
Literature Review
Dodds et al. (1991) described the con-ceptual relationship between quality, price, and value; all of which have an influence on the willingness to purchase. Their results showed the effect of price on willingness to buy. Price can measure the degree of sacri-fice needed to buy the product, and the size of the level of quality. A high price becomes the basis for a perceived high quality and causes a willingness to buy. But at the same time, a higher price indicates a higher amount of money spent, so that the sacrifice action is necessary to buy the product, and this be-comes the basis for the loss of willingness to buy. Therefore, the negative effect occurs between the perceived sacrifice for the per-ceived value (Dodds et al. 1991).
Sweeney et al. (1996) also supported Dodds et al. (1991) and showed the negative effect of the relative price to the value and the willingness to buy. From these research works, we can claim that there is a negative effect between price and value on the will-ingness to buy. Price is one of the most im-portant factors in decision making by con-sumers (Srivastava and Lurie 2001) and ap-propriate prices for consumers will have a long term impact on customer retention (Kukar and Kinney 2006).
Soelasih
206
The MCDM method is used on the basis of the existing five dimensions. The modified VIKOR method is used to solve the problem without having to use a dimension that has been used by other researchers, so that the dimensions can be taken from the problem.
The modified VIKOR method was in-troduced by Opricovic and Tzeng (2004). They developed the dimensions of service quality in relation to the specific problem. Research conducted by Liou et al. (2011), used a modified VIKOR about the quality of an airline’s domestic services. In the aviation industry, research conducted by Nadiri et al. (2008) mentioned the quality of service in terms of five different dimensions of SERVQUAL, called AIRQUAL. Neverthe-less, the AIRQUAL dimensions were derived from SERVQUAL and aimed specifically at airlines service quality.
With airlines, there are many issues which can emerge, such as passenger com-plaint rates because of frequently delayed departures, or the cancellation of scheduled flights, baggage issues, and poor customer relations (Taylor 2001). In general, the qual-ity of aviation services is driven by 10 main factors, namely timeliness, check-in, flight schedules, seat comfort, the location of the entrance, the interior of the aircraft, flight attendants, service after the flight, food ser-vice and pilots’ on-duty hours (Glab 1998). Consumer complaints about flights included complaints about the purchase of tickets, ticket refunds, rates, customer services, ad-vertising and other problems, and also about timing issues, problems with boarding, and baggage handling. (Rhoades and Waguespack 2008). Consumers also expressed anger about problems with flights, flight delays and can-cellations, differing models for pricing, flight restrictions, and airline/airport employees.
The airlines are a service industry, so they should provide a good quality of service to their consumers (Rhoades et al. 2008). ISO 14001 emphasized improving customer sat-isfaction, the airlines’ image and reputations, and increased domestic market share (Korul 2005: 54). Interpersonal relationships are a key factor to reduce consumer dissatisfaction but are very often associated with the place or environment where the service was pro-vided. The place is instrumental in deliver-ing an image of good quality service. This concept is called ‘servicescape’ (Edvardsson and Strandvik 2000: 89). Some studies by Hu and Burning (1978); Rietchie et al. (1980); and Abraham (1983), split flight services into four stages as follows.
1. Pre-journey, this is the process of the ser-vice provided to passengers prior to their flight. This includes information schedules, flight routes, reservations and booking the ticket.
2. Pre-flight services to passengers who are going to fly. At this stage, the activities at the airport include: The check-in process, checked baggage handling, waiting room/ lounge facilities, and the boarding process. The airlines are highly dependent on the existing facilities and infrastructure at the airport.
3. In-flight or onboard is the service provided to passengers during the flight. The ser-vices include seat width and leg room, cabin and seat cleaning, food and beverage ser-vice, information and reading services, toi-lets, and general cabin crew service. 4. Post-flight services are those provided to
207 Gadjah Mada International Journal of Business – September-December, Vol. 17, No. 3, 2015
This research offers a continuation of the work by Liu et al. (2011), by establishing the quality of services applying the 4 stages listed above of pre-journey, pre-flight, in-flight and post-in-flight. This study also incor-porated the indicators used by Liou et al. (2011) in developing the questionnaires.
Bitner (1992), introduced a model of environmental psychology and developed a comprehensive model, named ‘servicescape.’ Bitner found out that a psychological envi-ronment may have impact on customers. They can feel happy or sad towards the ser-vice environment. Happy customers can lead to an action to purchase or repurchase the offered service while the unhappy one will likely cancel the purchase or repurchase ac-tion. Hence, Bitner developed further rela-tion between service and scape, merged into “serviscape” or also known as physical evi-dence.
‘Servicescape,’ as proposed by Bitner in 1992 is still a good reference. Lovelock; et.al. (2011) and Zeithaml et al (2009) used it when explaining the service environment or the physical evidence. Physical appearance affects consumers by improving their satis-faction (Bitner 1992). The physical
appear-ance of the airline must be considered, be-cause its effect on satisfaction will lead to customer retention.
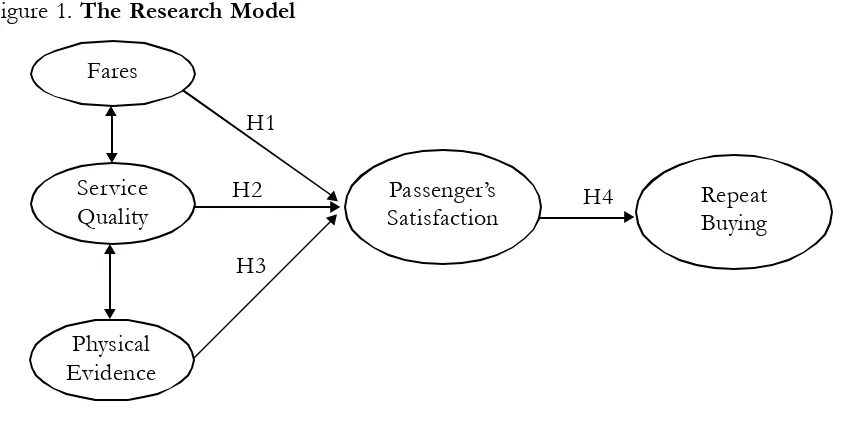
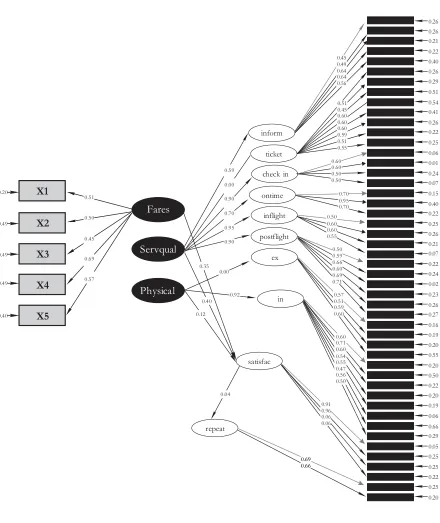
Therefore, it can be argued that physi-cal appearance can be treated separately from the concept of service quality itself since its presence is dominant. The presence of physi-cal appearance can also negate the meaning of tangible. This study proposes to separate the physical appearance aspect from service quality, and find its significance throughout the overall model. It is suggested that the presence of physical evidence can stand alone, and affect satisfaction without being associated with quality. This will be a con-tribution by this research to its predecessors. A satisfied customer is more likely to use that particular airline again (Oliver 1999; Stewart 1997; and Reichheld 1996). The sat-isfied consumer will come back and spend more money due to the level of satisfaction experienced from previous purchases (Jones and Sasser 1995; Higgins 1997; and Lewis 1998). According to Yi and La (2004), Yi (1990), satisfaction can be measured by the number of complaints, return business and positive word-of-mouth referrals. When sat-isfaction is created, the customer will buy the Figure 1. The Research Model
Fares
Service Quality
Physical Evidence
Passenger’s
Satisfaction H4 RepeatBuying
H1
H2
Soelasih
208
product or service again. Therefore, we can use repeat buying as a measure of satisfac-tion.
Given all the discussions above, this research proposes the research model as Fig-ure 1.
Hypotheses
H1: There is an influence by fares on passengers’ satisfaction.
Passengers’ satisfaction can occur when the fare that is charged matches the benefits received, and if they are not appropriate, then that can cause dissatisfaction (Lapre and Tsikriktis 2006, received value for fares cause satisfaction Grace 2005).
H2: There is an influence by service quality on pas-sengers’ satisfaction
Service quality, if carried out well, will give rise to satisfaction. With increasing competition among the airlines, service quality becomes im-portant for the strategic planning/management of a company (Chang and Yeh 2002; and Buttle 1994).
H3: There is an influence from the physical evidence on passengers’ satisfaction.
The physical evidence comprises the ways in which customers can be attracted to and/or satisfied by a firm’s services (Bitner 1992; Ryu et al. 2012). The influence of these tangibles and intangibles upon service qual-ity is a widely debated issue by the marketing literature, despite the apparent lack of con-sensus on the relative importance of every dimension (Pantouvakis and Lymperopoulos 2008). Therefore, in the service marketing mix, we propose physical evidence as a mea-surement to declare the presence of tangibles in services (Lovelock et al. 2009).
H4. There is an influence from passengers’ satisfac-tion on repeat buying
Passenger’s satisfaction causes repeat buying (Chen 2008). Consumer satisfaction is an antecedent which causes the repeat buy-ing (Bukhari et al. 2013).
Methodology
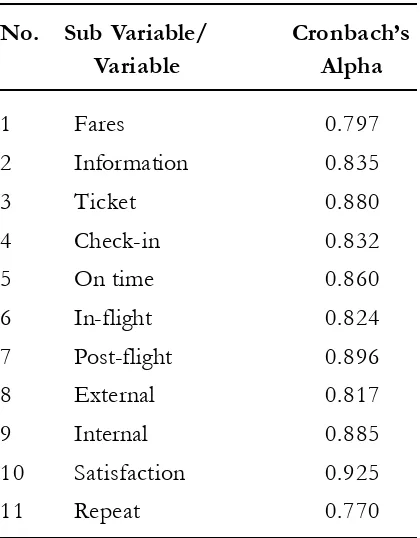
Sampling was done using cluster random sampling. The potential samples were passen-gers present at Soekarno-Hatta airport. The number of samples totaled 317 passengers, arrived at using random counting. This re-search performed reliability and validity tests for all the variables used in this study. The reliability test results, listed in Table 1, showed that all of the variables studied were reliable with a value above 0.7. The reliability’s measurement scale should have a
Table 1. Result of Reliability
No. Sub Variable/ Cronbach’s
Variable Alpha
1 Fares 0.797
2 Information 0.835
3 Ticket 0.880
4 Check-in 0.832
5 On time 0.860
6 In-flight 0.824
7 Post-flight 0.896
8 External 0.817
9 Internal 0.885
10 Satisfaction 0.925
209
Gad
jah M
ada In
tern
ation
al Jou
rnal o
f Bu
sine
ss
–
Sep
temb
er-De
cemb
er, V
ol. 1
7, N
o. 3, 2
015
Indicators Fares Inform Ticket Check-in On Time In-Flight Post-Flight External Internal Satisfaction Repeat
X1 0.694
X2 0.652
X3 0.529
X4 0.781
X5 0.636
X6 0.656
X7 0.692
X8 0.802
X9 0.810
X10 0.625
X11 0.707
X12 0.663
X13 0.658
X14 0.650
X15 0.685
X16 0.752
X17 0.740
X18 0.742
X19 0.724
X20 0.773
X21 0.765
X22 0.726
X23 0.789
X24 0.927
X25 0.764
X26 0.710
X27 0.765
X28 0.811
X29 0.668
X30 0.661
X31 0.772
X32 0.758
Soel
asih
210
Table 2. (Continued)
Indicators Fares Inform Ticket Check-in On Time In-Flight Post-Flight External Internal Satisfaction Repeat
X34 0.804
X35 0.809
X36 0.819
X37 0.761
X38 0.796
X39 0.648
X40 0.795
X41 0.701
X42 0.793
X43 0.769
X44 0.781
X45 0.616
X46 0.566
X47 0.702
Y1 0.839
Y2 0.884
Y3 0.865
Y4 0.880
Z1 0.812
211 Gadjah Mada International Journal of Business – September-December, Vol. 17, No. 3, 2015
Cronbach Alpha value of at least 0.70 (Nunnally 1978; Nunnaly and Bernstein 1994).
Test validity using confirmatory factor analysis, and validity of test results, presented in Table 2. The validity of the test results showed that all indicators can shape the di-mensions and variables studied, with a value above 0.5. The reliability and validity of the test results showed that all of the variables were eligible for use in this study.
After testing the validity and reliability, we then tested the model using a Structural Equation Model.
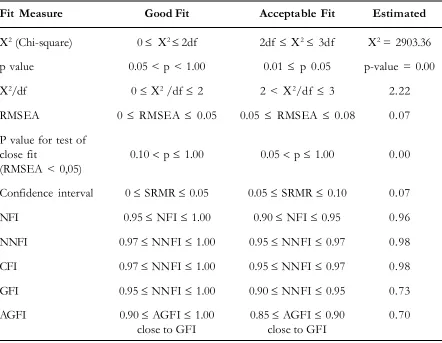
Test results of the suitability models based on chi-square/degrees of freedom, RMSEA, SRMR, NFI, NNFI, and CFI, as shown above, produced an acceptable model, although the assessments that were based on chi-square, p value, GFI and AGFI generated suitability test of the model were only a mar-ginal fit. However, Hu and Bentler (1998) recommended the use of SRMR, supple-mented by NNFI, CFI, or RMSEA derived from ML and GLS estimations for goodness of fit. This research used the Maximum Likelihood (ML) method for the SEM. Over-all, the model test results of the model ex-plained the relationship between the variables Table 3. Test Results Suitability Model (GOF)
Fit Measure Good Fit Acceptable Fit Estimated
2 (Chi-square) 0 2 2df 2df 2 3df 2 = 2903.36
p value 0.05 < p < 1.00 0.01 p 0.05 p-value = 0.00
2/df 0 2 /df 2 2 < 2/df 3 2.22
RMSEA 0 RMSEA 0.05 0.05 RMSEA 0.08 0.07
P value for test of
close fit 0.10 p 1.00 0.05 p 1.00 0.00
(RMSEA < 0,05)
Confidence interval 0 SRMR 0.05 0.05 SRMR 0.10 0.07
NFI 0.95 NFI 1.00 0.90 NFI 0.95 0.96
NNFI 0.97 NNFI 1.00 0.95 NNFI 0.97 0.98
CFI 0.97 NNFI 1.00 0.95 NNFI 0.97 0.98
GFI 0.95 NNFI 1.00 0.90 NNFI 0.95 0.73
AGFI 0.90 AGFI 1.00 0.85 AGFI 0.90 0.70
close to GFI close to GFI
Source: Engel et al. (2003)
Soelasih
212
of fares, service quality, physical evidence, passengers’ satisfaction and the repeat buy-ing of domestic commercial flights with low cost carriers in Indonesia.
Analysis and Result
Passengers’ Characteristics
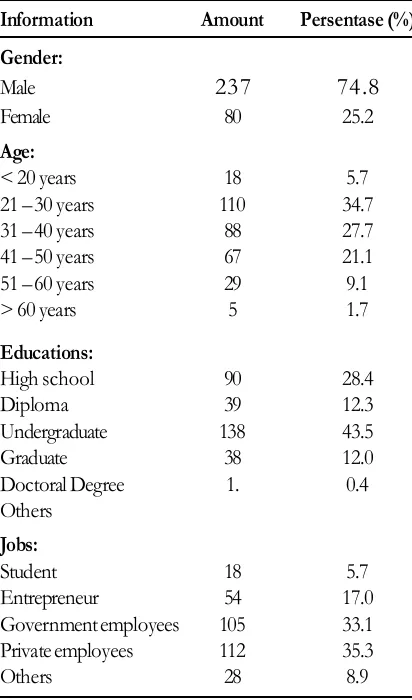
Table 4 shows that most passengers had a bachelors degree (S1), most worked as pri-vate company employees, and the majority were between the ages of 21-30 years old. The data showed that the passengers were people who were highly mobile, so they
de-sire and expect on-time travel performance when using air transportation.
Overal Structural Model and
Hypothesis Testing
The results of the data processing to answer the hypotheses under study using SEM with Lisrel program are as Table 5.
The results of testing Hypotheses 1, 2, and 4 individually showed the H0was rejected, so that H1 was accepted, which means that for each test between fares and service qual-ity, they both influenced the passengers’ sat-isfaction. Passengers’ satisfaction also had an influence on repeat buying. Meanwhile, hy-pothesis 3 for H1 was rejected, as physical evidence had no effect on the passengers’ sat-isfaction.
However, from the overall equation re-sult as Equation 1, the physical evidence was not significant. It means that the physical evi-dence did not have any impact on passen-gers’ satisfaction.
satisfac= 0.347*fares + 0.403*servqual
(0.0794) (0.135)
4.365 2.985
+ 0.125*physical, Errorvar.= (0.134)
0.931
0.333, R²= 0.667 (0.0429)
7.775 ...(1) The equation shows that the physical evidence does not have any impact on pas-sengers’ satisfaction, as shown by the value of t being below 1.96. It meant that the im-portant variables in shaping passengers’ sat-Table 4. Passengers Characteristics
Information Amount Persentase (%) Gender:
Male 237 74.8
Female 80 25.2
Age:
< 20 years 18 5.7
21 – 30 years 110 34.7
31 – 40 years 88 27.7
41 – 50 years 67 21.1
51 – 60 years 29 9.1
> 60 years 5 1.7
Educations:
High school 90 28.4
Diploma 39 12.3
Undergraduate 138 43.5
Graduate 38 12.0
Doctoral Degree 1. 0.4
Others Jobs:
Student 18 5.7
Entrepreneur 54 17.0
Government employees 105 33.1
Private employees 112 35.3
213 Gadjah Mada International Journal of Business – September-December, Vol. 17, No. 3, 2015
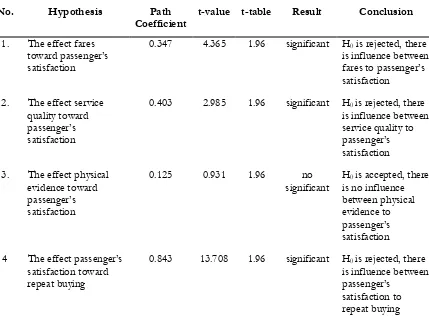
No. Hypothesis Path
Coefficient t-value t-table Result Conclusion 1. The effect fares
toward passenger’s satisfaction
0.347 4.365 1.96 significant H0 is rejected, there is influence between fares to passenger’s satisfaction
2. The effect service quality toward passenger’s satisfaction
0.403 2.985 1.96 significant H0 is rejected, there is influence between service quality to passenger’s satisfaction 3. The effect physical
evidence toward passenger’s satisfaction
0.125 0.931 1.96 no
significant H0 is accepted, there is no influence between physical evidence to passenger’s satisfaction 4 The effect passenger’s
satisfaction toward repeat buying
0.843 13.708 1.96 significant H0 is rejected, there is influence between passenger’s
satisfaction to repeat buying Table 5.Hypotheses Testing Fares, Service Quality, and Physical Evidence of
Passen-ger Satisfaction
isfaction with low cost carrier airlines in In-donesia were their fares and service quality.
The overall results from LISREL are shown at Figure 4. Passengers still consider that the physical evidence is a part of the ser-vice quality, which was why the difference between the physical evidence and service quality was not visible during testing. Argu-ably, the difference will be visible when there is a clear distinction between the service qual-ity and physical evidence. Parasuraman (1985) stated that service quality had five dimensions, namely tangible, reliability, re-sponsiveness, empathy and assurance. Tan-gible overlaps with physical evidence. Bitner
(1992) proposed the theory, which was later established by Lovelock et al. (2011) and Zeithaml et al. (2009), in which they stated the variable ‘servicescape’ or physical evi-dence, was one of the variables in the ser-vice marketing mix besides serser-vice quality.
intan-Soelasih
214
gible, while the physical evidence was on the tangible. The results of the research showed that something which was felt by passengers raised their level of satisfaction higher than
something that could be seen by them. This was what caused physical evidence to have no influence on passengers’ satisfaction.
215 Gadjah Mada International Journal of Business – September-December, Vol. 17, No. 3, 2015
Conclusion
This study confirmed that the fares pas-sengers have to pay had a positive influence on their satisfaction, which was different from the study of Dodds et al. (1991) and Sweeney et al. (1996). Their results showed that the relative price had a negative effect on the perceived value.
This study also showed that the discus-sion on service quality dimendiscus-sions can be formed out of the proposed problems. The result indicated that there were six dimen-sions that consist of information, ticketing, check-in, on-time performance, in-flight and post-flight. Hence, these findings also sup-ported the research work by Liou (2011).
Lastly, this study has taken some effort to separate tangible in the service quality from
the physical evidence, so that the service quality dimensions studied were intangible. This differs from the work of previous stud-ies on this topic. However, the results of this study indicated that the physical evidence did not have any impact on passengers’ satisfac-tion, which implied that the tangible dimen-sion cannot be eliminated from the service quality.
To answer this issue, we propose fur-ther research into the effort to distinguish the difference between service quality and physi-cal evidence. It will make a contribution to supporting the theory expressed by Lovelock (2011) that the service needed some addi-tions to the marketing mix, to be called the service marketing mix, one of which was physical evidence; and it also supports the theory of the ‘servicescape’ by Bitner (1992).
References
Abraham, M. 1983. A service quality model in air travel demand: An empirical study. Transportation Research 17A (5): 385-393.
Baker, D. A. and J. L. Crompton. 2000. Quality, satisfaction and behavioral intentions. Annals of Tourism Research 27 (3): 785-804.
Bitner, M. J. 1990. Evaluating service encounters: The effects of physical surroundings and employee responses. Journal of Marketing 54 (April): 69-82.
Bitner, M. J. 1992. ‘Servicescape’: The impact of physical surroundings on customers and employees.
Journal of Marketing 56 (April): 57-71.
Blackwell, R., C. D’Souza, M. Taghian, P. Miniard, and J. Engel. 2006. Consumer Behaviour: An Asia Pacific Approach. Thomson: 171.
Bukhari, S. M. F., A. Ghoneim, C. Dennis, and B. Jamjoon. 2013. The antecedents of travellers’ e-satisfac-tion and intene-satisfac-tion to buy airline tickets online, a conceptual model. Journal of Enterprise Information Management 26 (6): 624-641.
Buttle, F. 1996. SERVQUAL: review, critique, research agenda. European Journal of Marketing 30 (1): 8-32. Chang, Y-H., and C-H. Yeh. 2002. A survey analysis of service quality for domestic airlines. European
Journal of Operational Research 139, 166-177.
Soelasih
216
Chase, R. B. 1981. The customer contact approach to services: Theoretical bases and practical extension.
Operations Research 29 (4): 698-706.
Chen, C-F. 2008. Investigating structural relationships between service quality, perceived value, satisfac-tion, and behavioral intentions for air passengers: Evidence from Taiwan. Transportation Research
(Part A 42): 709-717.
Cronin Jr., J. J. S. A. Taylor. 1994. SERVPERF Versus SERVQUAL: Reconciling performance – based and perceptions – minus – expectations measurement of service quality. Journal of Marketing 58 (January): 125-131.
Cronin Jr. J. J., and S. A. Taylor. 1992. Measuring service quality: A reexamination and extension. Journal of Marketing 56 (3) (July): 55-68.
Dodds, W. B.; K. B. Monroe, and D. Grewal. 1991. Effects of price, brand, and store information on buyers’ product evaluations. Journal of Marketing Research (Aug 28) (3). ABI/INFORM Global. Edvardsson, B., and T. Strandvik. 2000. Is a critical incident critical for a customer’s relationship? Managing
Service Quality 10 (2): 82-91.
Engel, K. S., H. Moosbrugger, and H. Muller. 2003. Evaluating the fit of structural equation models: Tests of significance and descriptive goodness-of-fit measures. Methods of Psychological Research Online 8 (2): 23-74.
Glab, J. 1998. The people’s choice. Frequent Flyer (June): 24-8.
Grace, D. 2005. Consumer disposition toward satisfaction (CDS): Scale development and validation.
Journal of Marketing Theory and Practice 13 (2) (Spring): 20-31.
Gupta S., D. R. Lehmann, and A. Stuart. 2004. Valuing customers. J Mark Res 2004;41(1):7–18.
Higgins, K.T. 1997. Coming of Age: Despite Growing Pains, Customer Satisfaction Measurement Con-tinues to Evolve. Marketing News, 1-12.
Hu, L., and P. M. Bentler. 1998. Fit indices in covariance structure analysis: Sensitivity to under parameter-ized model misspecification. Psychological Methods (3): 424-453.
Hu, M. and E. T. Burning. 1978. A comparison of Enduring and Instrumental product/service impor-tance: The case of the airline traveler. Transportation Practitioners Journal 54: 31-40.
Korul, V. 2005. Guide to the implementation of ISO 14001 at airports. Journal of Air Transportation 10 (2): 49-68.
Kozak, M. 2001b. A critical review of approaches to measure satisfaction with tourist destinations. In J. A. Mazanec, G. I. Crouch, J. R. B. Ritchie, A. G. Woodside (Edts.), Consumer Psychology of Tourism Hospitality and Leisure 2. New York: CABI Publishing.
Kukar-K. M. 2006. The role of price-matching characteristics in influencing store loyalty. Journal of Business Research 59 (4):475-482.
Lapre, M. A., and N. Trikriktsis. 2006. Organizational learning curves for customer dissatisfaction: Het-erogeneity across airlines. Management Science 52 (3) (March): 352-366.
Lewis, S. 1998. All or nothing: Customer must be “Totally Satisfied.” Marketing News: 11-12.
217 Gadjah Mada International Journal of Business – September-December, Vol. 17, No. 3, 2015
Lovelock, C., and J. Wirtz. 2011. Services Marketing People, Technology, Strategy. (7th ed.). Pearson International
Edition: 27-37, 160. 277, 280-283
Jones, T. O. and W. E. Sasser Jr. 1995. Why satisfied customers defect. Harvard Business Review (Nov.-Dec.). Jou, R-C., S-H. Lam, D. Hensher, C-C. Chen, and C-W. Kuo. 2008. The effect of service quality and
price on international airline competition. Transportation Research (part E): 580-592.
Mangold, G. W., and E. Babakus. 1991. Service quality: The front-stage perspective vs the back stage perspective. Journal of Services Marketing 5 (4) (Autumn): 59-70.
Nadiri, H., K. Hussain, E. H. Ekiz, and S. Erdogan. 2008. An investigation on the factors influencing passengers’ loyalty in the North Cyprus national airline. The TQM Journal 20 (3): 265-280.
Nunnally J. C. 1978. Psychometric Theory (2nd ed.). New York: McGraw Hill.
Nunnally J. C., and I. H. Bernstein. 1994. Psychometric Theory (3rd ed.). New York: Mc Graw Hill.
Oliver, R. L. 1999. Whence consumer loyalty? Journal of Marketing 63: 33-34.
Pantouvakis, A., and K. Lymperopoulos. 2008. Customer satisfaction and loyalty in the eyes of new and repeat customers: Evidence from the transport sector. Managing Service Quality 18 (6): 623-643. Parasuraman, A., V. A. Zithaml, and L. L. Berry. 1985. A Conceptual model of Service Quality and Its
Implications for Future Research. Journal of Marketing 49 (Fall): 41-50.
Parasuraman, A., V. A. Zithaml, and L. L. Berry. 1988. SERVQUAL: A multiple-item scale for measuring consumer perceptions of service quality. Journal of Retailing 64 (1).
Rao, A. R., and K. B. Monroe. 1989. The effect of price, brand name, and store name on buyers’ perceptions of product quality: An integrative review. Journal of Marketing Research XXVI (August): 351-7.
Reichheld, F. F. 1996. Learning from customer defections. Harvard Business Review 59.
Reichheld, F., and W. Z. Sasser. 1990. Zero defections: Quality comes to services. Harvard Business Review
68 (5): 105–11.
Rhoades, D. L., and B. Waguespack Jr. 2008. Twenty years of service quality performance in the US airline industry. Managing Service Quality 18 (1): 20-33.
Richard, M. D. and A. W. Allaway. 1993. Service quality attributes and choice behavior. Journal of Service Marketing 7 (1): 59-68.
Ritchie, J. R., E. E. Johnston, and V. J. Jone. 1980. Competition, fares and fence-perspective of the air traveler. Journal of Travel Research 27: 36-42.
Ryu, K., H-R. Lee, and W. G. Kim. 2012. The influence of the quality of the physical environment, food, and service on restaurant image, customer perceived value, customer satisfaction, and behavioral intentions. International Journal of Contemporary Hospitality Management 24 (2): 200-223.
Saha, G. C., and Theingi. 2009. Service quality, satisfaction, and behavioral intentions: A study of low-cost airline carriers in Thailand. Managing Service Quality 19 (3): 350-372.
Schmenner, R. W. 1986. How can service businesses survive and prosper? Sloan Management Review 27 (3) (Spring): 21-32 (http://www.researchgate.net/publication/12997398_How_Can_Service_ Business_Survive_and_Prosper)
Soelasih
218
Stewart, T. A. 1997. A satisfied customer is not enough. Fortune: 112-113.
Sweeney, J. C., G. N. Soutar, and L. W. Johnson. 1996. Retail service quality and perceived value. Journal of Retailing and Consumer Services 4 (1): 39-48.
Taylor, L. R. 2001. Miles to go, promises to keep. Government Excutive 33 (4): 81-84.
Um, S., K. Chon, and Y. H. Ro. 2006. Antecedents of revisit intention. Annals of Tourism Research 33 (4): 1141-1138.
Williams, P., and G. N. Soutar. 2009. Value, Satisfaction and Behavioral Intentions in an Adventure Tour-ism Context. Annals of Tourism Research 3: 413-438.
Yi, Y. 1990. A critical review of consumer satisfaction. Review of Marketing: 68-123.
Yi, Y., and S. La. 2004. What influences the relationship between customer satisfaction and repurchase intention? Investigating the effects of adjusted expectations and customer loyalty. Psychology and Marketing 21 (5): 351-373.
Zeithaml, V. A., M. J. Bitner, and D. D. Gremler. 2006. Services Marketing: Integrating Customer Focus Across Firms (4th ed.) McGraw-Hill International Edition: pp. 4, 5, 22, 26-28, 521-527, 320-321