Gadjah Mada International Journal of Business September-December 2009, Vol. 11, No. 3, pp. 341–359
INVESTIGATING THE IMPACTS
OF CUSTOMER SATISFACTION
ON FIRM PERFORMANCE
*Lianny Leo
Faculty of EconomicsUniversity of Indonesia, Jakarta, Indonesia
Lindawati Gani
Faculty of EconomicsUniversity of Indonesia, Jakarta, Indonesia
Johnny Jermias
Faculty of Business AdministrationSimon Fraser University, Burnaby, British Columbia, Canada
The purpose of this study is to investigate the impact of customer satisfaction on firm performance. We argue that a firm’s financial performance will be positively affected by its ability to satisfy its customers. By satisfying its customers, a firm increases its ability to acquire new customers, retain existing customers, and increase customer profitability.
Based on sample of firms listed on the Indonesian Stock Ex-change, we hypothesize and find that customer satisfaction is posi-tively and significantly related to firm performance in terms of return on assets and market value of equity. These findings are consistent with the view that customer satisfaction is a leading indicator of financial performance.
* The data are available from public sources. A list of sample firms is available from the
corresponding author upon request. We gratefully acknowledge the valuable comments and suggestions from the participants in the 2008 Asian Academic Accounting Association Conference, Dubai, UAE.
Introduction
In the last two decades, research-ers and practitionresearch-ers have shown dis-appointment with the overemphasis on the use of aggregate financial per-formance measures. Johnson and Kaplan (1987), for instance, assert that financial performance measures are too aggregate, too late, too distorted, and too focused on past results. These authors suggest that managers should also consider non-financial measures to understand factors that drive perfor-mance.
Managers often consider non-fi-nancial information more informative because it contains information on the current states of the company’s activi-ties and also future consequences of managers’ actions (Fisher 1992). Non-financial information often assists managers to focus their attention on critical activities or processes involved in managing a firm (Cooper and Kaplan 1991). Furthermore, managers tend to perceive non-financial information as less aggregate, more actionable, and more forward-looking than financial performance measures (Fisher 1992). One of the most important non-financial information is customer sat-isfaction (Kaplan and Norton 1996). In their seminal paper about balanced scorecard, Kaplan and Norton (2001) contend that satisfied customers will have a positive impact on financial performance because firms that are able to satisfy their customers are more likely to retain their existing custom-ers, increase customer profitability, and
acquire new customers. Previous em-pirical studies investigating the effect of customer satisfaction on perfor-mance tend to report a positive result (e.g., Ittner and Larcker 1998; Fornell et al. 2006). Most of these studies, however, have been conducted in de-veloped countries such as the United States and Australia.
Our study is motivated by the fact that despite the importance of cus-tomer satisfaction to improving firm performance, few, if any, studies have investigated this phenomenon in a de-veloping country such as Indonesia. Examining the impact of customer sat-isfaction on performance of compa-nies listed on the Indonesian Stock Exchange is important because unlike in developed countries where custom-ers have access to information related to various products, customers in In-donesia tend to have limited access to information on companies’ products or services. Therefore, the research questions that we try to address in this study are: (1) does the customer satis-faction index published annually by SWA magazine affect customer be-havior, and in turn, firms’ return on assets? and (2) does the customer sat-isfaction index affect the market value of the firm?
in the customer perspective leads to improved financial results. The results, however, indicate that customer satis-faction does not have a significant effect on cumulative excess returns and market-to-book ratio.
The remainder of this paper is organized as follows. Section two dis-cusses previous related literature, hy-potheses, and regression models used to test the predictions. Section three explains the research method and how to measure the variables used in this study. Section four presents the results of the statistical analysis followed by general discussion on the main results, recommendations, and directions for future research in this area.
Related Literature and
Hypotheses
Accounting information has long been criticized for providing manag-ers with information that is too late, too aggregate, and too distorted to be relevant in today’s business environ-ment characterized by rapidly chang-ing environment (Simons 1990; Johnson and Kaplan 1987). It is not surprising, therefore, that in recent years, researchers and practitioners have shown a growing interest in using non-financial information in monitor-ing and decision-makmonitor-ing processes. Researchers are particularly interested in investigating whether non-financial information affects financial perfor-mance. One of the non-financial infor-mation that has attracted much
atten-tion in the accounting literature is cus-tomer satisfaction.
This study uses the balanced scorecard (Kaplan and Norton 1996, 2001, and 2006) as the underlying theory to develop the hypotheses. We focus on two perspectives in the bal-anced scorecard: (1) customer and (2) financial perspectives. Customer sat-isfaction is the main objective in the customer perspective since firms that do well in satisfying their customers will increase their likelihood to im-prove their financial performance.
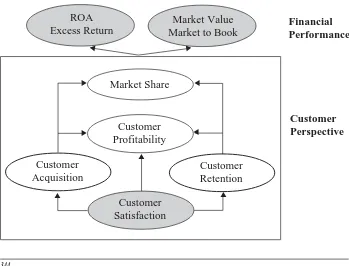
Kaplan and Norton (1996) assert that customer perspective consists of market share, customer retention, cus-tomer acquisition, cuscus-tomer satisfac-tion, and customer profitability. They argue, however, that customer satis-faction is the most important measure as this measure is the prerequisite of the other measures. This is because satisfied customers will enable the firm to acquire new customers, retain exist-ing customers, increase customer prof-itability, and, in turn, increase market share. Figure 1 shows how customer satisfaction affects financial perfor-mance (Kaplan and Norton 1996).
Figure 1 shows that customer sat-isfaction will eventually increase a firm’s market share through the
acqui-sition and retention of customers. In-creased market share leads to inIn-creased sales revenues. Other things equal, increased sales revenues will improve the firm’s profitability such as return on assets (ROA). Return on assets represents accounting performance related to how management uses the firm’s assets efficiently and effectively. Some studies have shown that manag-ers prefer return on assets to measure their performance since ROA is more controllable than market-based mea-sures which tend to be influenced by exogenous economic factors (Verrecchia 1986; Elitzur and Yaari 1995). Similarly, Hutchinson and Gul (2003) argue that ROA is considered an appropriate proxy for performance
Figure 1. Customer Satisfaction as A Leading Indicator of Financial Performance
Market Share
Customer Profitability
Market Value Market to Book
Customer Satisfaction ROA
Excess Return
W X
Customer Retention Customer
Acquisition X X
S W
S
W
Financial Performance
Customer Perspective
since this measure tends to be more controllable by managers. Further-more, Vining and Broadman (1992) report that ROA is one of the most commonly used indicators of profit-ability that have been used in the lit-erature. ROA has also been shown in the accounting and management lit-erature to be positively and signifi-cantly correlated with other measures of performance such as Tobin’s Q, return on equity, and return on sales (e.g., Jermias 2007; Vining and Broadman 1992; Parker and Hartley 1991). Hence, the following hypoth-esis is tested:
H1: Customer satisfaction will have a positive impact on firms’ return on assets.
In addition, this study uses mar-ket-based performance measures to test the robustness of the results to using different measures of performance. While accounting-based performance measures such as return on assets tend to be under the control of managers, Merchant and van der Stede (2007) argue that managers can manipulate ROA more easily than market-based measures. To address this problem, we also use three market-based perfor-mance measures: (1) market-to-book ratio, (2) market value of equity, and (3) cumulative excess returns.
Furthermore, Srivastava et al. (1998) propose that there are four rea-sons as to why customer satisfaction will affect a firm’s stock return and market value. First, satisfied custom-ers basically mean that the firm needs less effort and resources to persuade
the customers to buy the firm’s prod-ucts or services. Second, satisfied cus-tomers will pay their liabilities on time.
Third, satisfied customers reduce the
need for incurring sales and marketing expenses. Finally, satisfied customers decline the cash flow variability, lead-ing to decreased cash flow risks. In a similar vein, Anderson and Mansi (2009) contend that customer satisfac-tion should influence performance positively through its positive effects on customer behavior that determine the stability of future profits due to greater customer retention, bigger re-peated purchases, positive recommen-dations, and reduced costs of com-plaints.
In summary, satisfied customers in-crease cash flows and dein-crease the cash flow risks which make the firm’s stock more attractive to investors. Hence, the following hypotheses are examined:
H2: Customer satisfaction will have a positive impact on firm’s market-to-book ratio.
H3: Customer satisfaction will have a positive impact on firms’ market value.
H4: Customer satisfaction will gener-ate excess returns to investors.
To test the first hypothesis, we use the following regression model:
ROAi,t+1 = β0 + β 1ROAi,t +
β 2CSIi,t + ε i (1)
where ROAi,t is the performance of
firm i in year t measured as net income divided by total assets based on cur-rent annually audited financial state-ments, CSIi,t is the customer
satisfac-tion index of firm i in year t, and
ROAi,t+1 is the return on assets of firm
i in the following year.
To test the second hypothesis, we use the following regression model:
MTBi,t+1 =β0 + β1MTBi,t +
β2CSIi,t + ε i (2)
where MTBi,t is the performance of
firm i in year t measured as market value of the firm’s outstanding shares divided by book value of total assets based on current annually audited
fi-nancial statements, and MTBi,t+1 is the
market-to-book ratio of firm i in the following year.
To test the third hypothesis, we use the following regression model:
lnMVEi,t+1 = β0 + β 1lnASSETSi,t+1 + β 2lnLIABi,t+1 +
β 3lnCSIi,t + ε i
... (3)
where lnMVEi,t+1 is the natural
loga-rithm of market capitalization on the audited position of firm-year i in the following year, lnASSETSi,t+1 is the
natural logarithm of annually audited book value of total assets of firm-year
i in the following year, lnLIABi,t+1 is
natural logarithm of annually audited book value of total liabilities of firm i in the following year, and lnCSIi is the
natural logarithm of customer satis-faction index of firm i in current year. To test the fourth hypothesis, we use the following regression model:
CERi = β0 + β 1UEi + β 2CSIi + ε i
...(4)
where CERi is the current performance
of firm i measured as the cumulative excess returns on the firm’s shares for the period of five, 10, and 15 days since the publication of the customer satisfaction index by SWA magazine,
UEi is the unexpected earnings of firm i measured as the difference of pre-tax
ordinary current year income from prior year income scaled by prior year in-come, and CSIi is the current customer
Research Method
Sample Selection
The sample consists of firms listed on the Indonesian Stock Exchange (IDX) for six consecutive years (2003-2008). Financial information is ob-tained from the OSIRIS database. Only firms with complete information on net income, total assets, total liabili-ties, total shareholders equity, number of outstanding shares, and share price for the six years are included in the sample. Firms with negative balance of net assets and firms that are surviv-ing entities in merger transactions are excluded from the sample as negative balances are not transformable into logarithmic function and the measure-ment of unexpected earnings does not suit the accounting performance of surviving entities due to synergy ef-fect. Information regarding the cus-tomer satisfaction index is obtained from SWA magazine published annu-ally for the period of 2003-2008.
The reason we select this particu-lar period is because beginning in 2003, the magazine has changed its scoring systems to determine the customer sat-isfaction index. The customer satis-faction index is calculated based on a uniform Likert scales of 1-5 on prod-uct characteristics in terms of satisfac-tion towards quality, satisfacsatisfac-tion to-wards value, whether the product is perceived as the best in its category, and the ability of the product to meet future expectation (SWA 19/XIX Sep-tember 18-October 1, 2003 edition,
pages 26-36). Prior to 2003, the index was calculated using multivariate analysis based on customers’ responses to questions related to satisfaction to-wards quality and satisfaction toto-wards value using Likert scales of 1-5, and whether the product is perceived as the best in its category (a dummy variable of 1 for a positive answer and 0 other-wise) (SWA 18/XVI, September 7-20, 2000 edition, pages 26-35).
The numbers of respondents sur-veyed by the magazine were 10,200 for 2003 to 2004, and 10,500 for 2005 to 2008. Nine thousand respondents were randomly selected, and the maining were considered booster re-spondents from high income cluster. The surveys were conducted in six big cities in Indonesia: Jakarta, Bandung, Semarang, Surabaya, Medan, and Makassar. Respondents were selected based on the following criteria: (1) age between 15-65 years old, (2) monthly income between US$80 and US$400 (Rp750,000 to Rp3,500,000), (3) equal number of male/female respondents, and (4) for the high income respon-dents, their monthly income should be more than US$400. The sample is based on multi-stage random sampling for each income category. In addition, face-to-face interviews were conducted us-ing structured questionnaires.
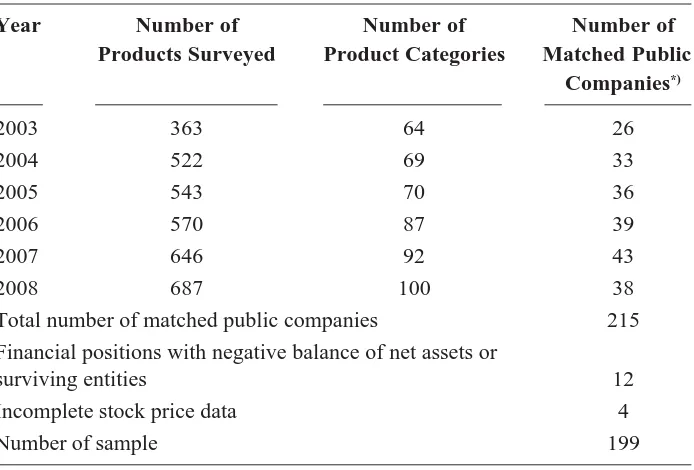
Table 1. Sample Selection
Year Number of Number of Number of
Products Surveyed Product Categories Matched Public Companies*)
2003 363 64 26
2004 522 69 33
2005 543 70 36
2006 570 87 39
2007 646 92 43
2008 687 100 38
Total number of matched public companies 215
Financial positions with negative balance of net assets or
surviving entities 12
Incomplete stock price data 4
Number of sample 199
Source: Summarized from SWA magazines
*) obtained from matching procedures of products to the producers that are public companies
firm-year observations. Table 1 sum-marizes the sample selection.
Variables Measurement
Independent Variable
The independent variable used in this study is the customer satisfaction index (CSI). CSI is measured based on the structural model proposed by Fornell et al. (1996). Figure 2 shows the structural model proposed by Fornel et al. (1996).
CSI is determined by customer expectation, perceived quality, and perceived value. According to this model, customer satisfaction will lead to customer loyalty or customer com-plaint. In the United States, the
mea-surement of CSI began in 1994. Cus-tomer satisfaction for each product for a firm is calculated based on the weighted-average of all products pro-duced by the firm (Hansen and Hennig-Turau 1999). The survey is conducted every quarter using 18 structured ques-tions, and responses are given in a 1-10 Likert scale. The customer satisfac-tion index for each firm ranges from zero to 100 (Morgeson 2005).
annual surveys to determine the cus-tomer satisfaction index for various products sold in Indonesia. Similar to the structural model proposed by Fornell et al. (1996), the customer sat-isfaction index is based on customer perception in terms of quality, value, rank, and expectation. Figure 3 shows
how to determine the customer satis-faction index.
The quality satisfaction score measures customer satisfaction with respect to product/service quality. The value satisfaction score measures cus-tomer satisfaction in terms of prices relative to the quality of the product.
Figure 2. Structural Model of Customer Satisfaction Index
Source: (Fornell, et al. 1996)
Figure 3. Determination of Customer Satisfaction Index in Indonesia
Quality Satisfaction
Score
Value Satisfaction
Score
Perceived
Best Score ExpectationScore
Total Satisfaction
Score TT TT PERCEIVED
QUALITY
PERCEIVED VALUE
OVERALL CUSTOMER SATISFACTION
(ACSI)
CUSTOMER COMPLAINTS
CUSTOMER LOYALTY CUSTOMER
EXPECTA-TIONS
+
+
+
+
+
+
+
-S S
S
S
S
S
S
S
Subsequently, the perceived best score measures customer perception on the rank of the product relative to com-petitors’ products. Meanwhile, the expectation score measures the ability of the product to satisfy customers’ future expectations. The total satisfac-tion index is calculated based on the weighted-average of the customers’ responses to the questions related to quality, value, rank, and expectation in a Likert scale of 1 to 5.
In this study, the customer satis-faction index (CSI) is measured based on the index reported annually in SWA magazine. Higher index indicates more satisfaction.
Dependent Variables
There are four dependent vari-ables used in this study: (1) return on assets (ROA); (2) market-to-book
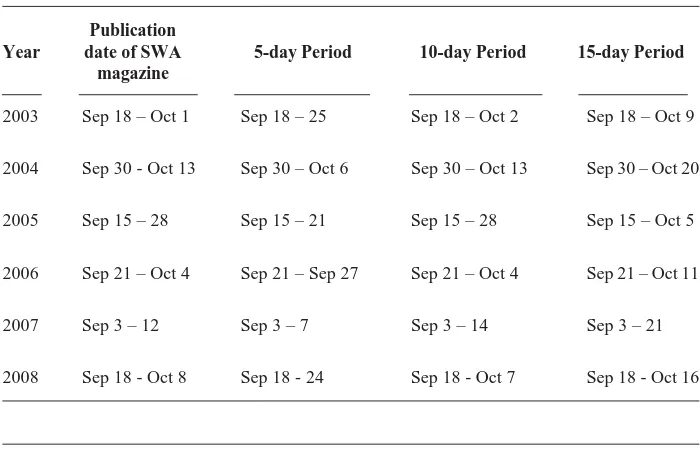
ra-tio (MTB); (3) market value of equity (MVE); and (4) cumulative excess re-turns (CER). ROA is measured as the ratio of net income to total assets. MVE is measured based on the num-ber of outstanding shares multiplied by the price per share. Market-to- book ratio is the market value of the shares divided by the book value of assets. Following the approach used by Teoh and Wong (1993), we calculate CER as the sum of the excess returns (based on the market-adjusted return) for the period of five, 10, and 15 days since the publication of the customer satis-faction index by SWA magazine. The determination of window period to calculate the cumulative excess re-turns for each year is presented in Table 2. We use data from audited financial statements as of December 31 since it is the closest date to the
Table 2. Determination of Window Period for Calculating the Cumulative Excess Returns
Publication
Year date of SWA 5-day Period 10-day Period 15-day Period
magazine
2003 Sep 18 – Oct 1 Sep 18 – 25 Sep 18 – Oct 2 Sep 18 – Oct 9
2004 Sep 30 - Oct 13 Sep 30 – Oct 6 Sep 30 – Oct 13 Sep 30 – Oct 20
2005 Sep 15 – 28 Sep 15 – 21 Sep 15 – 28 Sep 15 – Oct 5
2006 Sep 21 – Oct 4 Sep 21 – Sep 27 Sep 21 – Oct 4 Sep 21 – Oct 11
2007 Sep 3 – 12 Sep 3 – 7 Sep 3 – 14 Sep 3 – 21
event where the customer satisfaction index is published.
Control Variables
Previous studies have shown that firm size and leverage affect firm performance (e.g., Frank and Goyal 2003; Ramaswamy 2001). To control for the potential effects of these vari-ables on the dependent varivari-ables, in regression model 3 we use logarithmic function of the book value of a firm’s total assets to measure firm size and the book value of a firm’s total liabili-ties to measure firm leverage.
Accounting unexpected earnings affect market excess returns (e.g., Ball and Brown 1968; Beaver et al. 1997). In regression model 4, unexpected earn-ings are measured as the difference between pre-tax ordinary current year income and prior year income scaled by prior year income.
Data Analysis and Results
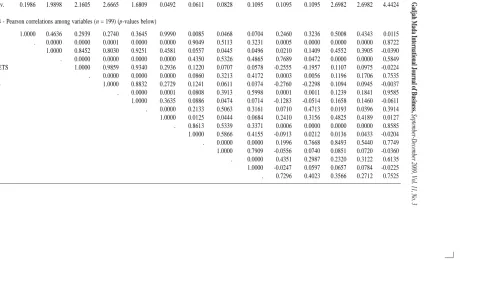
Panel A of Table 3 presents the descriptive statistics of the variables used in this study. The average ROA is 9.04 percent. The average logarithmic function of the firms’ market values is 21.81. The means of excess returns are -1.7 percent, -0.01 percent, and -0.1 percent for the five-, 10-, and 15-day windows, respectively. The average customer satisfaction index is 4.01. With respect to the control variables, the averages of logarithmic function of total assets and total liabilities are 22.27 and 21.52, respectively, and the average unexpected earnings is 0.48.
Panel B of Table 3 shows the Pearson’s correlations among variables used in this study. The positive and significant correlations between ROA and MTB (r = 0.59, p < 0.01), ROA and MVE (r = 0.14, p < 0.05), and MTB and MVE (r = 0.39, p < 0.01) indicate that the three performance indicators used in this study measure the same construct. The positive and significant correlations between CSI and ROA (r = 0.32, p < 0.01), MTB (r = 0.43, p < 0.01), and MVE (r = 0.46, p < 0.01) provide early supports to the hypoth-eses stated in the previous section.
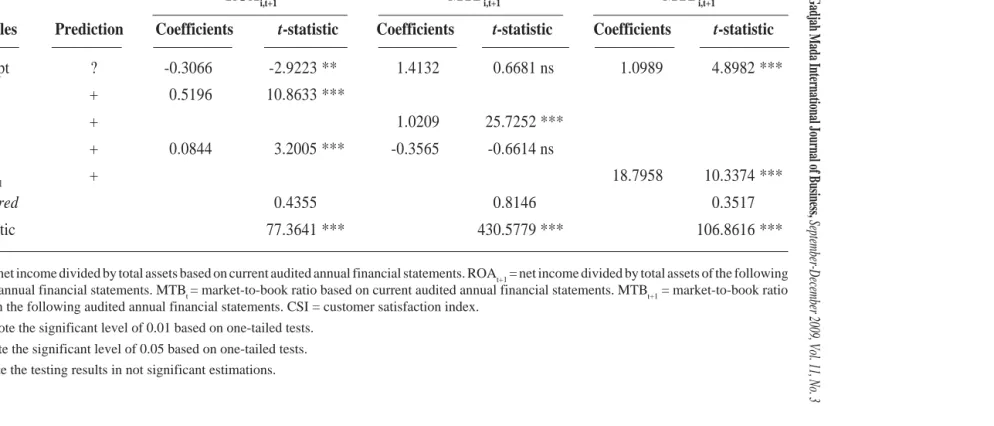
Table 4 presents the results of the regression analyses for the return on assets (ROA) and market-to-book ra-tio (MTB) as the dependent variables. The F-statistics for the regressions are significant for ROA (F = 77.36, R2 = 0.44) and MTB (F = 430.58, R2 = 0.81). Hypothesis H1 predicts that cus-tomer satisfaction will affect ROA positively. This hypothesis is exam-ined with the estimated coefficient on CSI. The positive and significant coef-ficient on CSI (β = 0.08, p < 0.01) confirms the hypothesis that customer satisfaction has a positive impact on performance in terms of ROA.
Gadjah Mada International Journal of Business,
September-December 2009, Vol. 11, No. 3
Table 3. Descriptive Statistics and Correlation Matrix
CSI lnMVE lnASSETS lnLIAB lnBVE lnCSI CER5 CER10 CER15 ROAt ROAt+1 MTBt MTBt+1 UE
Panel A - Descriptive Statistics (n = 199)
Mean 4.0111 21.8068 22.2702 21.5161 21.1872 1.3879 -0.0172 -0.0061 -0.0093 0.0904 1.0904 2.5462 3.5462 0.4804
Std. Dev. 0.1986 1.9898 2.1605 2.6665 1.6809 0.0492 0.0611 0.0828 0.1095 0.1095 0.1095 2.6982 2.6982 4.4424
Panel B - Pearson correlations among variables (n = 199) (p-values below)
CSI 1.0000 0.4636 0.2939 0.2740 0.3645 0.9990 0.0085 0.0468 0.0704 0.2460 0.3236 0.5008 0.4343 0.0115
. 0.0000 0.0000 0.0001 0.0000 0.0000 0.9049 0.5113 0.3231 0.0005 0.0000 0.0000 0.0000 0.8722
lnMVE 1.0000 0.8452 0.8030 0.9251 0.4581 0.0557 0.0445 0.0496 0.0210 0.1409 0.4552 0.3905 -0.0390
. 0.0000 0.0000 0.0000 0.0000 0.4350 0.5326 0.4865 0.7689 0.0472 0.0000 0.0000 0.5849
lnASSETS 1.0000 0.9859 0.9340 0.2936 0.1220 0.0707 0.0578 -0.2555 -0.1957 0.1107 0.0975 -0.0224
. 0.0000 0.0000 0.0000 0.0860 0.3213 0.4172 0.0003 0.0056 0.1196 0.1706 0.7535
lnLIAB 1.0000 0.8832 0.2729 0.1241 0.0611 0.0374 -0.2760 -0.2298 0.1094 0.0945 -0.0037
. 0.0000 0.0001 0.0808 0.3913 0.5998 0.0001 0.0011 0.1239 0.1841 0.9585
lnBVE 1.0000 0.3635 0.0886 0.0474 0.0714 -0.1283 -0.0514 0.1658 0.1460 -0.0611
. 0.0000 0.2133 0.5063 0.3161 0.0710 0.4713 0.0193 0.0396 0.3914
lnCSI 1.0000 0.0125 0.0444 0.0684 0.2410 0.3156 0.4825 0.4189 0.0127
. 0.8613 0.5339 0.3371 0.0006 0.0000 0.0000 0.0000 0.8585
CER5 1.0000 0.5866 0.4155 -0.0913 0.0212 0.0136 0.0433 -0.0204
. 0.0000 0.0000 0.1996 0.7668 0.8493 0.5440 0.7749
CER10 1.0000 0.7909 -0.0556 0.0740 0.0851 0.0720 -0.0360
. 0.0000 0.4351 0.2987 0.2320 0.3122 0.6135
CER15 1.0000 -0.0247 0.0597 0.0657 0.0784 -0.0225
353
et al.
—
The Impact of Government Debt Issuance on Short-Term Interest Rates in indonesia
Continued from Table 3
CSI lnMVE lnASSETS lnLIAB lnBVE lnCSI CER5 CER10 CER15 ROAt ROAt+1 MTBt MTBt+1 UE
Panel B - Pearson correlations among variables (n = 199) (p-values below)
ROAt 1.0000 0.6418 0.4483 0.4790 0.2355
. 0.0000 0.0000 0.0000 0.0008
ROAt+1 1.0000 0.5899 0.5930 -0.0118
. 0.0000 0.0000 0.8687
MTBt 1.0000 0.9023 0.0013
. 0.0000 0.9849
MTBt+1 1.0000 0.0423
. 0.5529
UE 1.0000
Gadjah Mada International Journal of Business,
September-December 2009, Vol. 11, No. 3
Table 4. Regression Results of Performance Predictability of Customer Satisfaction
ROAi,t+1 = β0 + β1ROAi,t + β2CSIi,t + εi
MTBi,t+1 = β0 + β1MTBi,t + β2CSIi,t + εi
ROAi,t+1 MTBi,t+1 MTBi,t+1
Variables Prediction Coefficients t-statistic Coefficients t-statistic Coefficients t-statistic
Intercept ? -0.3066 -2.9223 ** 1.4132 0.6681 ns 1.0989 4.8982 ***
ROAi,t + 0.5196 10.8633 ***
MTBi,t + 1.0209 25.7252 ***
CSI + 0.0844 3.2005 *** -0.3565 -0.6614 ns
ROAi,t+1 + 18.7958 10.3374 ***
R-squared 0.4355 0.8146 0.3517
F-statistic 77.3641 *** 430.5779 *** 106.8616 ***
ROAt = net income divided by total assets based on current audited annual financial statements. ROAt+1 = net income divided by total assets of the following audited annual financial statements. MTBt = market-to-book ratio based on current audited annual financial statements. MTBt+1 = market-to-book ratio based on the following audited annual financial statements. CSI = customer satisfaction index.
Further test is done by regressing ROA on MTB. The result confirms that firm accounting performance as measured by ROA affects firm market performance measured by MTB, sug-gesting that customer satisfaction has an indirect positive impact on perfor-mance in terms of MTB via ROA.
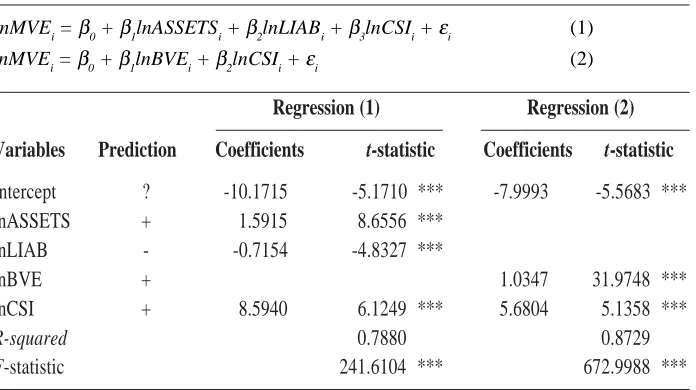
Table 5 presents the results of the regression analysis for future market value of equity (MVE) as the depen-dent variable. The F-statistics for the regression is significant (F = 241.61, R2 = 0.79). Hypothesis H3 predicts that customer satisfaction index will have a positive impact on firms’ future market value of shares. Hypothesis H3 is tested with the estimated coefficient on CSI. The positive and significant coefficient on CSI (β = 8.59, p < 0.01)
supports the hypothesis that customer satisfaction has a positive impact on performance in terms of firms’ future market value.
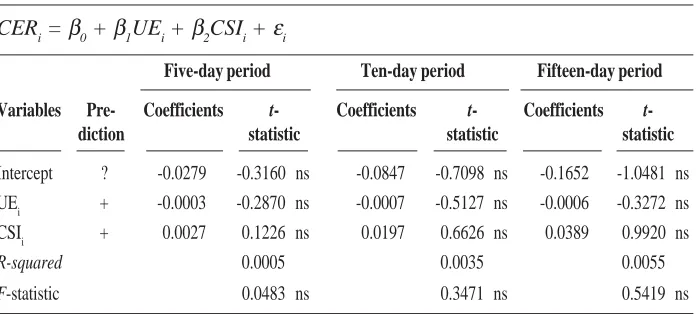
Table 6 presents the results of the regression analysis for cumulative ex-cess returns (CER) as the dependent variable. The F-statistics for the re-gressions is not significant (F = 0.05, R2 = 0.0005). Hypothesis H4 predicts that customer satisfaction index will generate cumulative excess returns to shareholders. Hypothesis H4 is exam-ined with the estimated coefficient on CSI. The result shows that although the pattern of relationship is found as predicted, the coefficient on CSI is not statistically significant. Hence, the re-sult does not substantiate hypothesis H4.
Table 5. Regression Results of Value Relevance of Customer Satisfaction
l
nMVEi = β0 + β1lnASSETSi + β2lnLIABi + β3lnCSIi + εi (1)lnMVEi = β0 + β1lnBVEi + β2lnCSIi + εi (2)
Regression (1) Regression (2)
Variables Prediction Coefficients t-statistic Coefficients t-statistic
Intercept ? -10.1715 -5.1710 *** -7.9993 -5.5683 ***
lnASSETS + 1.5915 8.6556 ***
lnLIAB - -0.7154 -4.8327 ***
lnBVE + 1.0347 31.9748 ***
lnCSI + 8.5940 6.1249 *** 5.6804 5.1358 ***
R-squared 0.7880 0.8729
F-statistic 241.6104 *** 672.9988 ***
lnMVE = natural logarithm of market capitalization on the current audited position. lnASSETS = natural logarithm of book value of current audited annual total assets. lnLIAB = natural logarithm of book value of current audited annual total liabilities. lnBVE = natural logarithm of book value of current audited annual equity. lnCSI = natural logarithm of CSI (customer satisfaction index).
Table 6. Regression Results of Market Response to Customer Satisfaction in Five-, Ten-, and Fifteen-Day Period After Publication
CERi = β0 + β1UEi + β2CSIi + εi
Five-day period Ten-day period Fifteen-day period
Variables Pre- Coefficients t- Coefficients t- Coefficients
t-diction statistic statistic statistic
Intercept ? -0.0279 -0.3160 ns -0.0847 -0.7098 ns -0.1652 -1.0481 ns
UEi + -0.0003 -0.2870 ns -0.0007 -0.5127 ns -0.0006 -0.3272 ns
CSIi + 0.0027 0.1226 ns 0.0197 0.6626 ns 0.0389 0.9920 ns
R-squared 0.0005 0.0035 0.0055
F-statistic 0.0483 ns 0.3471 ns 0.5419 ns
CER5 = window cumulative excess return within 5-day period after publication of CSI. CER10 = window cumulative excess return within 10-day period after publication of CSI. CER15 = window cumulative excess return within 15-day period after publication of CSI. UE = unexpected earnings of current compared to prior accounting performance. CSI = customer satisfaction index.
ns denote the testing results in not significant estimations.
Discussion and Conclusions
This paper investigates the im-pacts of customer satisfaction on vari-ous measures of firm performance. We use customer satisfaction index published by SWA magazine as the proxy for customer satisfaction of a firm’s products. Consistent with our predictions, the results of this study indicate that customer satisfaction positively affects firms’ profitability in terms of return on assets and market value of shares. These results are con-sistent with those of Ittner and Larcker (1998) and Fornell et al. (2006). How-ever, the results do not support the hypotheses concerning the impacts of customer satisfaction on market-to-book ratio and cumulative excess
measures might be significantly influ-enced by other exogenous economic factors (Verrecchia 1986; Elitzur and Yaari 1995; Hutchinson and Gul 2003) which mitigate the impacts of the cus-tomer satisfaction index on both mar-ket-to-book ratio and cumulative ex-cess returns. Nevertheless, the results of this study may help managers real-ize that satisfied customers help firms achieve better financial performance in terms of return on assets and market value.
The results of this study should be interpreted in light of three limita-tions. First, the customer satisfaction index is determined by the satisfaction index of a single product owned by a firm (i.e., product with the highest satisfaction index). It is possible that customer satisfaction with the firm as a whole be different from the satisfac-tion index for the single product. Fu-ture research might develop a more comprehensive satisfaction index for the whole firm and investigate how this overall index affects firm finan-cial performance. However, due to time and financial constraints, we could only use the single product satisfac-tion index in this study.
Second, the time lag between
earn-ings announcement, customer satis-faction survey, and publication of cus-tomer satisfaction index is relatively
wide. Earnings announcement is mostly done in March, while the cus-tomer satisfaction survey is conducted in June and published in September. As indicated in Table 6, there is no more effect of earnings announcement on excess returns in September (p > 0.10 for each period). Future research might improve the measurement of unexpected earnings, most likely to use quarterly data. We find that the database for quarterly data is still not adequate to support our research due to incompleteness.
Third, the total respondents in the
References
Anderson, E.W., and S. A. Mansi. 2009. Does customer satisfaction matter to investors? Findings from the bond market. Journal of Marketing Research XLVI: 703-714. Ball, R., and P. Brown. 1968. An empirical evaluation of accounting income numbers.
Journal of Accounting Research (Autumn): 159-177.
Beaver, W. H., M. L. McAnally, and C. H. Stinson. 1997. The information content of earnings and Prices: A Simultaneous equations approach. Journal of Accounting and Economics 23: 53-81.
Chand, M. 2010. The impact of HRM practices on service quality, customer satisfaction and performance in the Indian Hotel Industry. The International Journal of Human Resource Management 21 (4): 551-566.
Collins, D. W., M. Pincus and H. Xie. 1999. Equity valuation and negative earnings: The role of book value of equity. The Accounting Review 74 (1) (January): 29-61. Cooper, R., and R. S. Kaplan. 1991. The Design of Cost Management Systems. Englewood
Cliffs, N.J.: Prentice Hall.
Elitzur, R.R., and V. Yaari. 1995. Executive incentive compensation and earnings manipulation in a multi-period setting. Journal of Economic Behavior and Organi-zation 26: 201-219.
Fisher, J. 1992. Use of non-financial performance measures. Journal of Cost Management 6 (Spring): 31-38.
Fornell, C., M. D. Johnson, E. W. Anderson, J. Cha, and B. E. Bryant. 1996. The American customer satisfaction index: Nature, purpose, and findings. Journal of Marketing 60 (October): 7-18.
Fornell, C., S. Mithas, F. V. Morgeson III, and M. S. Krishnan. 2006. Customer satisfaction and stock prices: High returns, low risk. Journal of Marketing 70 (January): 3-14. Frank, M. Z., and V. K. Goyal. 2003. Testing the pecking order theory of capital structure.
Journal of Financial Economics 67: 217-248.
Hansen, U., and T. Hennig-Thurau. 1999. National customer satisfaction indices: A critical investigation from an application perspective. Working Paper.
Hutchinson, M., and F. A. Gul. 2003. Investment opportunity set, sorporate governance practices and firm performance. Journal of Corporate Finance 182: 1-20. Ittner, C. D., and D. F. Larcker. 1998. Are nonfinancial measures leading indicators of
financial performance? An analysis of customer satisfaction. Journal of Accounting Research 36 (Supplement).
Jermias, J. 2007. The effects of corporate governance on the relationship between innovative efforts and performance. European Accounting Review 16 (4): 827-854. Johnson, H. T. and R. S. Kaplan. 1987. Relevance Lost: The Rise and Fall or Management
Accounting. Boston, MA: Harvard Business School Press.
Kaplan, Robert S. and D. P. Norton, 2001, The Strategy-Focused Organization: How Balanced Scorecard Companies Thrive in the New Business Environment. Boston: Harvard Business School Press.
Kaplan, R. S., and D. P. Norton. 2006. Alignment: Using the Balanced Scorecard to Create Corporate Synergies. Boston: Harvard Business School Press.
Merchant, K. A., and W. A. van der Stede. 2007. Management Control Systems: Performance Measurement, Evaluation, and Incentive. New York: Prentice-Hall. Morgeson, F., 2005. Trends in customer satisfaction with the U. S. Federal Government
– findings of the ACSI. Washington, D. C.: Presentation Material (December 15). Parker, D., and K. Hartley. 1991. Do changes in organizational status affect financial
performance? Strategic Management Journal (12): 631-641.
Ramaswamy, K., 2001, Organizational ownership, competitive intensity, and firm perfor-mance: An empirical study of the Indian Manufacturing Sector. Strategic Manage-ment Journal 22: 989-998.
Simons, R., 1990. The role of management control systems in creating competitive advantage: new perspective. Accounting, Organizations and Society 15 (1): 127-143.
Simons, R. 2000. Performance Measurement and Control Systems for Implementing Strategy: Text and Cases. Upper Saddle River, New Jersey: Prentice Hall. Srivastava, R. K., T. A. Shervani, and L. Fahey. 1998. Market-based assets and
share-holder value: A framework for analysis. Journal of Marketing 62 (January): 2-18. SWA Magazine 19/XIX (September 18-October 1). 2003. Jakarta, Indonesia.
SWA Magazine 19/XXIII (September 3-12). 2007. Jakarta, Indonesia.
SWA Magazine 20/XXIV (September 18-October 8). 2008. Jakarta, Indonesia. Teoh, S. H., and T. J. Wong. 1993. Perceived auditor quality and the earnings response
coefficient. The Accounting Review 68 (April) (2): 346-366.
Tuli, K. R., and S. G. Bharadwaj. 2009. Customer satisfaction and stock return risk. Journal of Marketing 73: 184-197.
Verrecchia, R. E. 1986. Managerial discretion in the choice among financial reporting alternatives. Journal of Accounting and Economics 9: 175-196.