Gadjah Mada International Journal of Business September-December 2009, Vol. 11, No. 3, pp. 409–441
THE IMPLEMENTATION
OF CORPORATE SOCIAL RESPONSIBILITY
(CSR) IN CENTRAL JAVA EARTHQUAKE
A Preliminary Study on Consumer Belief, Attitude, and
Purchase Intention
In Indonesia, Law No. 40/2007 paragraph 74 on Limited Liability Corporation regulates corporate social responsibility (CSR). Although CSR is mandatory for Indonesian resource-based firms, only four months after its enactment, six parties have asked for a judicial review to the Constitution Court as to the mandatory implementation of CSR. They argue that the mandatory implemen-tation of CSR might result in legal uncertainty, render businesses inefficient, decrease competitiveness, and trigger discriminative treatments. Using the cases of CSR after the earthquake in Yogyakarta, this paper aims at answering the question of whether the implemen-tation of CSR will lead to a decrease in competitiveness. Harnessing a mixed method of qualitative and quantitative approaches, this paper examines the models of beliefs, attitudes, and purchase intentions of consumers toward a company implementing CSR. The first phase of this study used a focus group discussion (FGD) to collect data from those who had benefited from CSR, and was analyzed using the content analysis. The results of the first phase then became the basis for the second phase. In the second phase, data were collected by surveying parents of school children whose school buildings were reconstructed by CSR programs, and answers were
Kresno Agus Hendarto
In Indonesia, Law No. 40/2007 paragraph 74 on Limited Liability Corporation regulates the corporate social responsibility (CSR). This law has undergone a long process since its proposal in the form of government draft on October 12, 2005 until its passage on July 20, 2007. Although CSR is mandatory for Indonesian re-source-based firms, four months after the enactment, six parties (Chamber of Commerce and Industry, Young Indo-nesian Entrepreneurs Association, Women Indonesian Entrepreneurs Association, Lili Panma Ltd., Apac Centra Centertex Ltd., and Kreasi Tiga Pilar Ltd.) asked for a judicial review to the Constitution Court about the mandatory implementation of CSR. They argued that paragraph 74 of the Law of Limited Liability Corporate was contradictory to paragraphs 28D Article 1, 28I Article 2, and 33 Article 4 of Constitution 1945, in the phrase of “justified efficiency.” Furthermore, the mandatory implementation of CSR might result in legal uncertainty and cause inefficient businesses, decrease
competitiveness, and trigger discrimi-native treatments. However, on April 16, 2009, the Constitution Court de-clined the request for judicial review. Using the cases of CSR during the earthquake in Jogjakarta, which was before the enactment of the Law, the objective of this paper is to investigate whether CSR leads to a decrease in competitiveness. In this paper, the ob-jective is achieved by examining the models of beliefs, attitudes, and pur-chase intentions of consumers toward a company implementing CSR.
On May 27, 2006, at approxi-mately 05:59 a.m., an earthquake of 5.6 Richter scale damaged Yogyakarta and the surrounding areas. The results of the preliminary assessment on the damages and losses of an early morn-ing earthquake in the provinces of DIY and Central Java revealed that the earth-quake killed more than 5,716 people, injured 37,927 people, destroyed 240,396 houses, as well as resulted in disruption of local economic activi-ties. The damage and loss assessment performed in the early of June 2006 indicated that there had been damages and losses of Rp29.1 trillion (US$3.1 analyzed using the partial least squares analysis. Results show that the conjecture that the implementation of CSR will result in a decrease in competitiveness is not true. It is evident that CSR program affects the attitudes of consumers toward the firm, and that attitude fully mediates the relation between beliefs and purchase intentions toward the products of the firm implementing CSR. Keywords: attitude; belief; corporate social responsibility; Law No. 40/2007;
purchase intention; Yogyakarta earthquake
million). The earthquake was one of the worst disasters in Indonesia and the world for the last 10 years. Two regencies, Kabupaten Bantul in Yogyakarta and Kabupaten Klaten in Central Java, were the two regions suffering the worst. Two sectors that suffered the most were housing (52% of the total damage and loss values) and production (31% of the total dam-age and loss values). Therefore, the main strategy and policy of recovery and rehabilitation are focused on three program components: (1) housing and settlement recovery, (2) public infra-structure recovery, and (3) public and regional economy recovery (BAPPENAS 2006). At that time, some foreign countries, foreign and domes-tic firms have extended charity in the program of CSR.
As mentioned above, the objec-tive of this study is to test the models of beliefs, attitudes, and purchase inten-tions of consumers toward the firms and the products of the firms that imple-ment CSR. Mixed methods are uti-lized in this study. The use of mixed methods in case study research usually contributes to increasing accuracy and complexity/coverage in a study more than generality (Woodside 2010).
Beurden and Gossling (2008), Frederick (1994), and Griffin (2000) inform that there has not been any consensus as to what activities could be categorized as CSR. Most firms in Indonesia implement CSR in the form of donation (Hendarto 2008). Abidin et al. (2003) suggest that the habit of firms to give donation is basically not
as popular as the habit of individuals who are owners or hold the positions executives to give donation. This some-times makes it difficult to differentiate whether the given donation is inten-tional and planned in firm policies or it is because of the motivation of the individuals holding the positions of owners or executives. Hence, to an-swer the research questions, it is nec-essary that mixed methods be used. Bryman (1988) suggests three main approaches to the mixed methods: (1) qualitative method which facilitates quantitative method, (2) quantitative method which facilitates qualitative method, and (3) qualitative and quan-titative methods that share an equal emphasis. In accordance with Bryman’s (1988) suggestion, this study finds it necessary to use a mixed method in which qualitative method (phase 1) facilitates quantitative method (phase 2). In the phase 1 of this study, data are collected using Focus Group Discus-sion (FGD) and analyzed using the content analysis (qualitative). The re-sults are then used to develop the items of questions and develop hypotheses for phase 2.
Literature Review
Pro-social and Attribution
Theory
2009). Altruism is an attitude of help-ing without any pretentive motivation for own profits or benefits. Sears et al. (1985) define altruism as a voluntary action performed by an individual or a group to help other people without any expectation of rewards (except the feel-ing of havfeel-ing done goodness). Faturochman (2006) argues that such a condition is difficult to be found in the real world. Even if it exists, the possibility and frequency will be very low. Most people want to earn benefits for their own, even if the amount is small and immaterial. Therefore, when talking about helping others, pro-so-cial attitude is more appropriate than altruism. Baron and Byrne (2003) stud-ied the steps of giving help. There are five stages that an individual goes through before making a decision to give help: (1) realizing the existence of emergency condition since people will not give any help unless there is no-body who needs help; (2) interpreting a condition as the emergency condi-tion; (3) assuming that the condition is personal responsibility or the respon-sibility of observer; (4) knowing what has to be done (for instance, we can help someone drowning only when we know how to swim and how to pull the drowning person out); and (5) making a decision to help.
However, someone who gets help gives either negative or positive re-sponses. Baron and Byrne (2003) show that some studies find that a negative response may result from the feeling that the help decreases self-esteem, and that he or she (the helpee) lacks
competency (see also DePaulo et al. 1981; Fisher et al. 1982). On the other hand, when a person feels that the help he or she gets is sincere, there will be an ego support (Sears et al. 1985). In the same study, it is shown that previ-ous research (Fisher et al. 1982; Tessler and Schwartz 1972) concludes that people tend to ask for help when they can relate the problem to a difficult condition and not because of incompe-tency. It is also concluded that the help is more easily accepted when the per-son in need does not have to explicitly request for it.
being the attribution object can be other people’s actions, or his or her own actions, or impacts resulting from the event.
Value-Expectancy and
Hierarchy of Effect Models
The relationships among thought, feeling, and action have become the subject of study since Aristotle, Descrates, and Plato (Copley 1988). Every researcher proposes different models to elaborate on why people behave in a particular way and what they will do. One of the dominant models is Fishbein and Ajzen’s model. Fishbein and Ajzen (1980) propose a “value expectancy model” of attitude formation, postulating that the sum of strength of our beliefs and their con-current and affective evaluations of the beliefs combine to determine the attitude toward performance of an ac-tion. The attitude then influences our intention to perform the act, and the intention has a direct influence on our behavior. This model has three steps. First, the model begins from predict-ing one’s behavior from the intention. When an employee of tax office says that he or she has a purely dedicative and “clean” intention to work, he or she is more likely to do it than the situation where the employee does not have such an intention. Second, inten-tion can be predicted by two main variables of attitude toward behavior: (1) does the employee think that be-coming a “clean” employee is good and expected? and (2) what are other people’s (for instances, superiors,
reli-gious leaders, or relatives) perceptions on what should be done? Third, the attitude toward behavior is predicted by value-expectancy theory. In Sears et al. (1985), this theory suggests that decision is made on the basis of: (1) the value of possibly made decisions and (2) the degree of expectation about the results of the decision. This theory is frequently harnessed to examine per-suasion. Persuasion is defined as an explicit attempt to influence belief, attitude, and behavior (Mowen and Minor 2001). Peter and Olson (1996) suggest that persuasion is the changes in belief, attitude, and behavior result-ing from marketresult-ing communications. The concepts of belief, attitude, and behavior are closely related to the general knowledge of consumer atti-tude formation, which is usually used to define the study of relations among belief, attitude, and behavior (Mowen and Minor 2001). The hierarchy of effect model (HOE) was popularized in 1961 by Lavidge and Steiner al-though according to Barry (1987), this theory had existed since the beginning of the 20th century. Barry (1987)
in-forms that the history of HOE model development can be classified into three phases: (1) early development, which started from the latest years before the 20th century to 1960s; (2)
This model suggests that someone’s behavior, since receiving marketing communications until mak-ing a purchase decision and consum-ing a product, undergoes a series of processes or phases. Shimp (2000) provides evidence that in order for marketing information to be success-ful, it has to move consumers from one goal to another, just like stepping up the staircases toward the top. Barry (1987) says that there are some models of HOE that have been formulated. All of them are based on the idea that marketing communications move people from the phase in which people are not aware of a particular brand to the phase where they finally buy the brand.
Phase I
In line with the purposes of the study, the research objective for phase 1 is to understand whether the donated fund given during the recovery after earthquake is a part of CSR. This is performed by identifying the motiva-tion of the firm in implementing CSR through the participants of FGD. The sub-questions in the phase 1 are: (1) the knowledge and perception of CSR program recipients of the firms; (2) the evaluation made by CSR program re-cipients of the firms; and (3) the ten-dency of CSR program recipients to behave in the firms. The results of sub-question analysis are then used to se-lect (either add or reduce) question items asked to the respondents in phase 2.
Method
At this phase, qualitative approach is utilized. Data are collected using Focus Group Discussion (FGD). Malhotra (2004) reveals that FGD is an interview made by a moderator in a natural and unstructured way to a lim-ited group of respondents. Some schol-ars support the use of FGD. According to Churchill (2001), FGD in marketing research is known to be productive because: (1) it results in hypotheses that can further be tested qualitatively, (2) it results in information useful to develop questionnaires, (3) it gives basic information about product cat-egory, and (4) it secures impressions about the concepts of new products. Meanwhile, Steward and Shamdasani (1990) write that FGD gives data closer to the emic side of the continuum. Furthermore, Krueger (1994) argues that FGD is a procedure useful when we want to identify people’s percep-tions toward an experience, idea, thought, or event. FGD is more natural since the informant both influences and is influenced by one another, just like the real life setting.
stimula-tion, meaning that after the period of introduction, respondents are willing to express their ideas and feelings in line with the feelings of the group similar to the topic discussed; (4) se-curity, meaning that participants’ feel-ings are similar to the feelfeel-ings of other members in the group such that they feel comfortable and are thus willing to express their feelings and ideas; (5) spontaneity, meaning that since the participants are not required to answer questions specifically, their responses may be spontaneous and unusual, and therefore we have to obtain the appro-priate ideas from their perspectives; (6) coincidence, implying that it is likely that unexpected ideas may be expressed in a group interview than in a personal interview; (7) structure, meaning that FGD gives flexibility of topic and depth of treatment; (8) speed, meaning that because people are inter-viewed at the same time, the collection and analysis of data may be relatively fast.
Population and Sample
The population of this study is those benefited by the CSR program. Churchill (2001) reveals that the main focus of exploratory research, such as FGD, is to identify ideas and inputs. Moreover, an exploratory study sel-dom uses detailed questionnaires or probability sampling plans. Therefore, the sampling technique used in this study is judgmental/ purposive sam-pling. Judgmental sampling is a form of convenience sampling whose ele-ments are selected on the basis of
judg-ment of the researcher or based on particular criteria. The criteria in this study are: (1) they have directly ben-efited from a firm’s CSR program and (2) they are willing to be involved in the study.
Elaboration of Required Data
of blaming each other or reciprocal defense, that may obscure or obstruct the objective of the FGD. On the con-trary, in the confrontative model, emo-tional character, idea, material mas-tery, cultural and social background deserve careful attention in selecting participants. In the confrontative model, the facilitator plays the role of a coach and referee when the discus-sion becomes ‘heated’ as the partici-pants reciprocally blaming each other in the discussion.
In line with the objective, the study uses partial FGD. The sample (infor-mants) involved in the FGD is pre-sented in Appendix 1.
Data Analysis
The dialogue was recorded in an audiovisual instrument. It was then transcribed and analyzed using the content analysis. Berelson (1952) finds that in most cases validity does not seem to be a major problem in the content analysis. With careful opera-tional definition and accurate and cor-rect indicator selection, the coding sheet is assumed to measure what it should measure. Kassarjian (1977) adds that in the content analysis it is enough to use content validity or face validity.
Malhotra (2004) suggests that one of the weaknesses of FGD is misjudg-ment since FGD is prone to client and researcher bias. To avoid this prob-lem, reliability analysis is employed. Reliability testing in this study is con-ducted using the method of inter-coder
reliability. This testing purports to ensure the objectivity of the data to be analyzed and the reliability of analysis techniques in drawing conclusions from the FGD. In this study, the reli-ability is examined using Holsti’s co-efficient of reliability (1963).
where,
C 1,2 = the number of category as-signments on which all cod-ers agree
C1, C2 = the sum of all category as-signments by all coders
After the validity and reliability tests, the transcribed data were de-scriptively analyzed. Descriptive analysis was performed by contextualizing the transcribed data while contextualization was conducted by coding the consensus and differ-ences among the informants, and pre-senting the statements of the infor-mants involved in the FGD to strengthen arguments.
Results
The development of coding sheet had been consulted in advance with a researcher at the Center for Cultural and Popular Media Research. The ob-jective of the consultation was to have a validity test in the coding sheet. In order to assess the face validity of the coding sheet, I submitted the coding sheet and a letter introducing my
search objectives to researchers at the Center for Cultural and Popular Media Research. These respondents then pro-vided feedback and qualitative com-ments on the coding sheet in general. As a result of this procedure, we re-worded some operational definitions and indicators to integrate terminolo-gies currently used by professionals (see Appendices 1 and 2). Afterwards, with the assistance of a researcher at the Institute of Research and Commu-nity Services, Gadjah Mada Univer-sity, the reliability was tested.
There is a difference in determin-ing the cutoff of reliability coefficient acceptance. Krippendoff (1980) re-ports that the lower limit of acceptance of reliability coefficient is 0.8, Scott (1955) puts it over 0.75, while Berelson (1952) argues that the coefficient should be between 0.79 and 0.96. The reliability at this phase is 0.88 or above the scores proposed by Krippendoff and Scott, and in the range suggested by Barelson (see Appendix 6).
As discussed above, this study uses partial FGD as the appropriate approach. During the session of ap-proximately 90 minutes, there were six participants who gave opinions. The results of the FGD analysis, after being coded, are presented in quoted statements containing similarities (con-sensus) and differences.
From the question “whether the firm’s CSR program is beneficial” “From SGM. Supports for my kinder-garten are in the form of facilities and infrastructure. My kindergarten was
built by SGM. Most employees of SGM in Kemudo are the local people of Kemudo. When they have to attend tests, and two applicants have an equal score (let’s suppose that the applicant from the Kemudo village has the score of 90 and so does the applicant from another village), the firm gives a pri-ority to the person from Kemudo. Fur-thermore, when the houses of employ-ees are damaged or destroyed, SGM reconstruct them. Then the roads from Sari Husada to the village hall of Kemudo have been asphalted by SGM. Subsequently, the local ‘posyandu’ (in-tegrated maternity service) receives milk every month. SGM provides milk to schools too, and even this is ex-tended to other schools beyond Kemudo, especially those located in the valley of SGM. Of equal impor-tance, on the anniversary of SGM they give special attention to poor people by distributing staple goods.” ”.. I tell you what, when there was an earthquake, the supports and supplies from the government came late. If there were no firm reconstructing the build-ings, when would it be reconstructed, Sir?”
“The benefit is the establishment of belief to the PUSKESMAS (primary health care); the belief is represented by an increase in visit.”
”... sometimes my neighbors come to me when they have school assignments, for examples on literature, or econom-ics, or other fields. They usually get articles from me…”
”... since 2004 the price of rice has been Rp3,000 and soybean ketchup Rp3,500, and we have enjoyed conve-nience. Therefore, we were very happy at that time. Why? We were given explanations, and more interestingly, we were recorded in a video and ac-cordingly became more enthusiastic. We were in a video shot, ate tempe with soybean ketchup, and used banana leaves as the plate; we indeed were very glad. Then we were presented with gifts. The presents were ketchup Bango, toothpaste, and soap (as prod-ucts from Unilever).”
From the question ‘whether they request for CSR’
“… initially it commenced from the socialization made by Professor Widiastudi of UGM to cooperate with ketchup Bango. Then we agreed, and thus recommended this program to my members...”
“… when the earthquake happened, when the school buildings were totally damaged and no shelter was avail-able, children had to study under trees. Then came the firm to help. If no firm had helped reconstruct the schools and education, I could not imagine what it would have been like ...”
“… (SGM) had an idle building, some-one wanted to rent it for more than Rp150 million, but the request was declined. If the PKK could be gath-ered, perhaps this building could be used for other purposes. Then SGM contacted us, and wondered about es-tablishing a playgroup. It needed much money, but he said, “no problem…”
From the question ‘whether the firm’s CSR has an impact on the infor-mant’
“Indeed, when I was on TV advertis-ing ketchup Bango, I felt so nervous.” “… unless there is attention, the mis-chievous people, particularly the youths who consume liquor, may go on protesting, right Sir? But with the pro-gram (CSR), the people are grateful.” “If we go to a supermarket to buy daily needs and I see the products of Sari Husada being displayed there, I feel happy because the company is my sponsor”
“If I watch TV and see the advertise-ments of Honda, I will presume that the brand is superior since when the earthquake stroke I got charity from the firm. I still remember that the firm reconstructed my school building.”
“… The vehicles of the teachers are Honda, and the transportation means of our family, by chance, are all Honda.”
”... To me, I just want ketchup Bango. So if I buy a product, the ketchup must be ketchup Bango. If you go to my house, you will find ketchup Bango. I buy in the form of plastic container, and then I refill it into a bottle. The quantity is the same, but the ketchup in plastic container is cheaper. And if I want to make peyek, remember, the ketchup is ketchup Bango as it is tightly attached to my heart.”
From the question ‘whether CSR is a firm strategy’
”... in my opinion, it is not only for social motivation.”
”... They (Honda) gave pictures to schools and to the rooms too. It is renowned as the school of Honda, that’s it, Sir... and based on our expe-riences in the past, in a new academic year, some students living in distant locations would go to that school. When I asked why they went to the (distant) school, they cried and said that they just wanted to go to the school of Honda…”
From the aforementioned testi-monies of respondents, there are sev-eral important facts: (1) CSR program beneficiaries believe that the CSR pro-gram benefits them and the society, (2) CSR beneficiaries have good attitudes toward the firm, (3) since it is initiated by the firm, the program beneficiaries
do not think that the CSR is a threat to their self-esteem and competencies, and (4) they also think that the firm’s CSR is a strategy and not merely social motivation.
Phase II
After a long intensive debate, there is an agreement that attitude can be conceptualized as the total evaluation of an object (Ajzen 2001; Ajzen and Fishbein 2000). The expectancy-value model remains the most popular model to conceptualize attitude. In this model, one’s attitude toward an object is de-termined by the subjective value of the attributes that interact with the power of belief. This model assumes that evaluation decision is formed on the basis of cognitive process that relates the object of attitude to important at-tributes (Maholtra 2005). In other words, consumers usually and natu-rally like the brands that they believe to have the desired characteristics, and vice versa (Schiffman and Kanuk 1999). However, Assael (2001) find that there are cases where belief is not related to attitude, which is when con-sumers purchase products based on hedonism such that belief is not rel-evant anymore with consumer deci-sions.
percent of Americans have a more positive attitude toward companies that support activities that they are con-cerned about. On the other hand, al-most half of the sample of research carried out by Webb and Mohr (1998) revealed a negative attitude toward companies, and this was mostly caused by consumers’ cynicism on the moti-vation of the companies. Yoon et al. (2006) studied CSR activities in the cigarette industry. Although the com-panies implemented CSR program (do-nating to the study of cancer), the companies were perceived negatively by consumers. Wagner et al. (2009) show that companies which do not consistently and seriously implement CSR activities (hypocrisy) are per-ceived negatively as counter-produc-tive. Likewise, in their study on reac-tive and low-fit CSR activities, Simmons and Becker-Olsen (2004) find that the low fit between compa-nies’ core products and CSR activities will result in consumers’ lower re-sponses than the case of high fit be-tween core products and CSR activi-ties. Becker-Olsen et al. (2006) reveal that although there is high fit, but if it is considered reactive rather than pro-active, this may still result in a nega-tive reaction from consumers. Accord-ingly, predicated on the aforemen-tioned studies and using the results of this study in phase 1, the hypothesis proposed in phase 2 is:
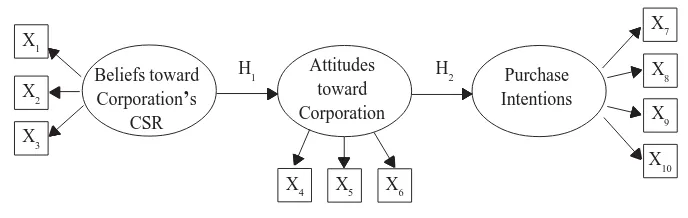
H1 : Consumer belief in a firm imple-menting CSR influences the consumer’s attitude toward the firm.
The theory of attribution suggests that attribution influences attitude and behavior. According to Takwin (2009), “Heider’s naïve theory of action” is a conceptual framework used to inter-pret, explain, and forecast other people’s behavior. In this framework, the concept of intention plays an im-portant role. Dharmmesta (1998) de-scribes intention as: (1) the captor or intermediary of motivational factors that have effects on behavior, (2) an indicator of how hard a person has attempted to do something, (3) an indi-cator of the planned attempt, and (4) something closely related to the real behavior. Brown and Dacin (1997), Creyer and Ross (1997), Ellen et al. (2000), and Lee et al. (2008) find that there is a correlation between a com-pany implementing CSR and consum-ers’ attitudes toward the firm’s prod-ucts. Barone et al. (2000) argue that CSR activities will affect consumers’ preferences for trademarks. Almost similarly, the study by Smith and Alcorn (1991) suggests that consum-ers wish to switch to another brand and even are willing to pay more expen-sive products of companies perform-ing CSR activities (for typical goods). Therefore, it is hypothesized that: H2 : Consumer’s attitude toward the
firm that implements CSR influ-ences the consumer’s purchase intention toward the products of the firm.
Method
Population and Sample
The population of this study is those who have benefited from CSR programs after the earthquake of May 27, 2006 in the form of school build-ing. The scope of the study is parents whose children are studying at schools receiving charity from CSR programs. The sample of this study is collected using the purposive sampling method. Purposive sampling is a non-probabi-listic sample taking that meets particu-lar criteria (Cooper and Schindler 2006). Bailey (1994) says that the ad-vantage of the purposive sampling tech-nique is that researchers can use their previous capabilities and experiences to select respondents. In line with the objective, the criteria used in the selec-tion of respondents are: (1) the respon-dents are adult, (2) the responrespon-dents are able to read and write (literate), and (3) the respondents are willing to get in-volved in the study.
The steps in the sample genera-tion are as follows: (1) observing schools, whose developments after the earthquake of May 27, 2006 were
sup-ported by a particular firm through the CSR program, (2) determining the schools that will be selected as objects of this study, and (3) determining stu-dents’ parents to be included in the sample.
Data Collection
Of the schools supported by firms, only the schools known to have been supported by firms that offer products (in line with the question items) were selected. Appendix 2 presents the pro-files of elementary schools selected as the objects of this study.
After determining the study ob-jects, the next step was to select classes to which the questionnaires would be handed out. The questionnaires asked students about their experiences at a school. Those who had been studying at the school which the earthquake destroyed were selected as the sample. To these students, questionnaires were handed out to their parents to be filled out. Being completed by their parents, the questionnaires were returned to the classroom teacher. When the ques-tionnaires were distributed to the par-ents, we expounded to them in details on how to complete the questionnaires.
X1
Measurements
The questionnaires comprised two major sections. The first component asked about beliefs and attitudes of respondents toward firms that imple-ment CSR, and respondents’ purchase intentions toward the products of the firms. The second part contained the profiles of respondents. The question items were modified from the previ-ous studies of Irwin et al. (2003) and Pomering and Dolcinar (2008) by con-sidering the results obtained in phase 1. Mustakini (2008) suggests that when the question items are translated from English into Indonesian, it is neces-sary to make sure that the translation has been correct and accurate. We consulted with a linguistic expert from the Faculty of Cultural Sciences of Gadjah Mada University to translate the question items from English into Indonesian. The translated version was then re-translated into English by a colleague who has studied overseas. The objective was to identify possible significant differences in translation works between the original question items and the final question items to be used in this study.
Instrument Analysis
Field test was made to measure social desirability and construct valid-ity (reliabilvalid-ity and validvalid-ity). Social desirability is defined as respondents’ tendencies to present themselves in a favorable position with regard to so-cial norm (Nunnaly in Jo et al. 1997). It is usually perceived as a personal tendency that becomes the part of some-one, putting him or her in a place that he or she likes although it may be different from the real feeling. Cooper and Schindler (2006) postulate that there is a tendency for respondents to be dishonest in answering the ques-tions in a social study as they refuse or feel ashamed of the topic of study, dislike the topic, and feel afraid of the consequences (of the answers). To anticipate this social desirability bias, Junaedi (2006) made a comparison between the answers from direct tioning and those from indirect ques-tioning.
Validity in this study was tested by calculating the values of conver-gent validity and discriminate valid-ity. Fornell and Larcker (1981) men-tion that the criteria of convergent
va-X1
lidity are as follows: (1) loading factor of more than 0.7 and significant and (2) value of AVE (Average Variance Extracted) of higher than 0.5. Mean-while, for discriminate validity the value of AVE is higher than the value of squared correlation of the construct pairs. Ghozali (2008) argues that the loading value of 0.5 to 0.6 is accept-able. Subsequently, reliability was examined by calculating the value of Cronbach’s alpha and composite reli-ability. Nunnaly in Ghozali (2005) used the cut-off point of 0.7 for composite reliability.
Data Analysis
This study uses descriptive analy-sis and component-based structural equation model/ partial least squares (Smart PLS version 2.0). PLS is a technique that generalizes and com-bines principal component analysis and multiple regression. Barclay et al. in Chwelos (2001) note that PLS is better when the focus is on theory develop-ment, whereas LISREL is preferred for confirmatory testing of the fit of a theoretical model to observed data, thereby requiring stronger theory than PLS. Citing some research, Lu et al. (2007) suggest that PLS is a com-monly used statistical analysis for la-tent variables, and it can be used to confirm the validity of the constructs of an instrument and assess the struc-tural relationships among constructs. The use of PLS, in accordance with the objective of this study, is to confirm the validity of the constructs of an instrument and identify the predictive
linear relations among variables. In PLS, optimal linear relations among latent variables are calculated and in-terpreted as the best predictive rela-tions despite their limitarela-tions (Ghozali 2008).
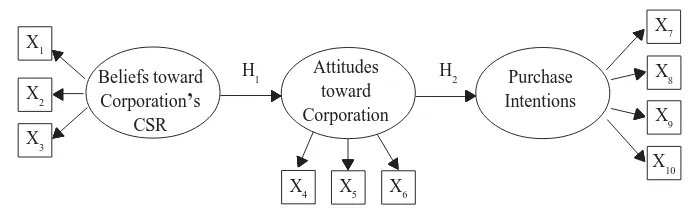
Table 1. Resume of Comparative Difference between Covariant-based and
Variant-based
No Criteria Covariant-based Variant-based
1. Assumption Multivariate normal Not necessarily normally distribution. distributed.
Requiring absence of Able to manage multicollinear multicolinearity. problems.
2. Data Unable to handle missing Able to handle (robust) to data and noise data. analyze missing data and noise
data.
Only able to handle Able to handle (robust) continuous data. nominal, ordinal, and
continuous data.
3. Number of Large. Small.
Analysis Unit
4. Complexity of Little to medium Large complexity model complexity (less than (100 constructs and 1000
100 indicators). indicators).
5. Relation Only able to handle Able to handle both reflective between latent reflective indicator. and formative indicators. variable and
the indicators
for missing and noise data, (3) it can be used for reflective and formative la-tent data, and (4) it can handle nomi-nal, ordinomi-nal, and continuous scales.
In brief, the differences between variance-based and covariance-based analyses are presented in Table 1.
Results
Answers to the questions obtained in phase 1 were then tested to 30 un-dergraduate students of Gadjah Mada
425
The Implementation of CSR in Central Java Earthquake
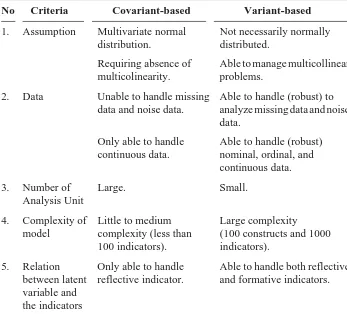
Table 2. Output of Social Desirability Test
Paired Samples Test
Paired Differences
95% Confidence Interval of the Difference
Mean Std. Dev. Std. Error Lower Upper t df Sig. (2-tailed) Mean
Pair 1 Bel_1 - Bel_1b 0.233 0.728 0.133 -0.038 0.505 1.756 29 0.090
Pair 2 Bel_2 - Bel_2b -0.167 0.747 0.136 0.445 0.112 -1.223 29 0.231
Pair 3 Bel_3 - Bel_3b 0.067 0.521 0.095 -0.128 0.261 0.701 29 0.490
Pair 4 Bel_4 - Bel_4b 0.200 0.847 0.154 -0.116 0.516 1.293 29 0.206
Pair 5 Bel_5 - Bel_5b 0.667 0.828 0.151 -0.242 0.376 0.441 29 0.662
Pair 6 Bel_6 - Bel_6b -0.133 0.681 0.124 -0.388 0.121 -1.072 29 0.293
Pair 7 Bel_7 - Bel_7b 0.067 1.229 0.225 -0.393 0.526 0.297 29 0.769
Pair 8 Bel_8 - Bel_8b 0.033 1.273 0.232 -0.441 0.508 0.143 29 0.887
Pair 9 Bel_9 - Bel_9b -0.133 1.137 0.208 -0.557 0.291 -0.643 29 0.526
Pair 10 Bel_1 0- Bel_10b -0.167 0.874 0.160 -0.493 0.160 -1.044 29 0.305
Table 3. Output of Validity Test
Attitude B_Intention Belief
Att_1 0.888
Att_2 0.656
Att_3 0.848
Bel_1 0.835
Bel_1 0.753
Bel_1 0.798
BI_1 0.511
BI_2 0.217
BI_3 0.856
BI_4 0.832
BI_5 0.903
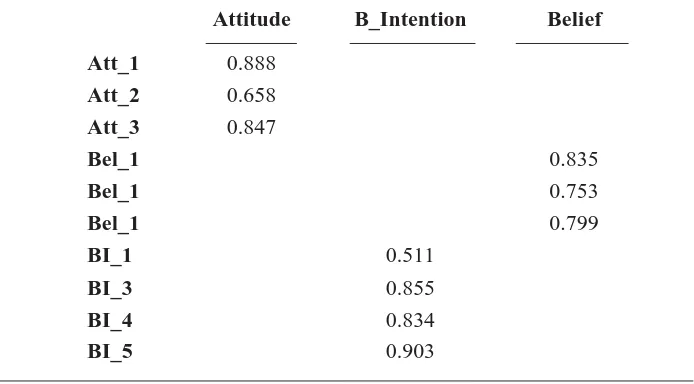
Table 4. Output of Validity Test After Item BI_2 Dropped
Attitude B_Intention Belief
Att_1 0.888
Att_2 0.658
Att_3 0.847
Bel_1 0.835
Bel_1 0.753
Bel_1 0.799
BI_1 0.511
BI_3 0.855
BI_4 0.834
Since there was no difference be-tween items of direct and those of indirect questions, in the next step only the direct questions were utilized (because the indirect questions needed a different method for validity and reliability tests). The 11 items of direct question were then examined for their validities by seeking the scores of con-vergent validity and concurrent valid-ity. Validity testing was done to 64 respondents (students’ parents) at Sawit Elementary School, Kecamatan Gantiwarno, Klaten. The initial ques-tions were filter quesques-tions. Cooper and Schindler (2006) postulate that filter questions are used to qualify respon-dents’ knowledge. In this question-naire, the filter questions are questions as to whether they know that their children’s schools were reconstructed with supports from a specific firm with specific products and brands.
The results of the validity test conclude that a question must be dropped as it does not reach the re-quired cut-off score (Table 3).
After the question was excluded from the survey instrument, the valid-ity of question items was retested. The results suggest that the question items
are valid as they have met the required conditions (Table 4).
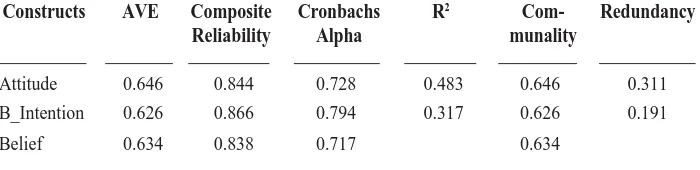
In the wake of the validity testing (from which valid questions were ob-tained), the testing was followed up by the reliability test. The results of the reliability testing provide evidence that question items have also met the re-quired reliability criteria (Table 5).
Profiles of Respondents
To the filter questions, all stu-dents’ parents answer that they know the reconstruction of their children’s schools were sponsored by a particular firm. This supports the interview an-swers by the headmaster who says that the information on the reconstruction sponsorship has been informed to the students’ parents in meetings. Of the total 166 questionnaires delivered to the students of Sanggrahan Elemen-tary School, Pesu ElemenElemen-tary School, and Dahromo Elementary School, all questionnaires returned. The high re-sponse rate was due to the coopera-tions with classroom teachers and the incentives offered to those returning the questionnaires. Of the total ques-tionnaires returned, nine question-naires are not fully completed such Table 5. Output of Validity and Realibility Test
Constructs AVE Composite Cronbachs R2 Com- Redundancy
Reliability Alpha munality
Attitude 0.646 0.844 0.728 0.483 0.646 0.311
B_Intention 0.626 0.866 0.794 0.317 0.626 0.191
Table 6. Respondent Demographic Profile (N = 157)
Variable Variable
Gender Monthly Earning
Male 46.50 < UMR 63.00
Female 53.50 1UMR - 2UMR 54.00
2UMR - 3UMR 26.00
> 3UMR 14.00
Age
Min 17.00 Occupation
Max 66.00 Civil Servant 32.00
Mean 42.60 Household Wife 38.00
Farmer 22.00
Education Trader 16.00
Elementary School 56.00 Private Company 10.00
Junior High School 33.00 Other 44.00
Senior High School 40.00
Academy 13.00
University 15.00
Graduated Program 0.00
*) UMR = Regional Minimum Subsistance Wage
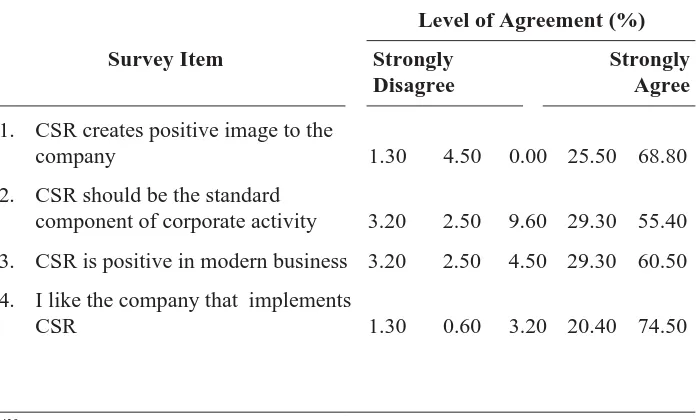
Table 7. Respondents’ Belief, Attitude, and Purchase Intention Related to
CSR Program in Bantul and Klaten
Level of Agreement (%)
Survey Item Strongly Strongly
Disagree Agree
1. CSR creates positive image to the
company 1.30 4.50 0.00 25.50 68.80
2. CSR should be the standard
component of corporate activity 3.20 2.50 9.60 29.30 55.40
3. CSR is positive in modern business 3.20 2.50 4.50 29.30 60.50
4. I like the company that implements
that only 157 can be analyzed further. The demographic profiles of respon-dents are presented in the following Table 6.
Table 6 depicts that the average age of respondents is 42.6 years. The percentage of female respondents is 53.5 percent of which 24.2 percent are housewives. Most respondents gradu-ated from elementary school (35.7%), and have incomes of less than or equal to the regional minimum wage (40.1%).
Table 7 describes the distribution of respondents’ answers to the ques-tions. The table shows that most re-spondents answer “totally agree” to the questions of the questionnaires. No respondent answers “not sure” to the question on whether CSR creates a positive image for the firm (question item 1). Although there are respon-dents saying “totally disagree” and “disagree” to the question, most re-spondents say that they “totally agree” (68.8%).
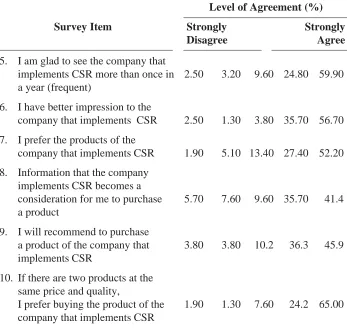
Continued from Table 7
Level of Agreement (%)
Survey Item Strongly Strongly
Disagree Agree
5. I am glad to see the company that
implements CSR more than once in 2.50 3.20 9.60 24.80 59.90 a year (frequent)
6. I have better impression to the
company that implements CSR 2.50 1.30 3.80 35.70 56.70
7. I prefer the products of the
company that implements CSR 1.90 5.10 13.40 27.40 52.20
8. Information that the company implements CSR becomes a
consideration for me to purchase 5.70 7.60 9.60 35.70 41.4 a product
9. I will recommend to purchase
a product of the company that 3.80 3.80 10.2 36.3 45.9 implements CSR
10. If there are two products at the same price and quality,
Structural Model for the Total
Sample
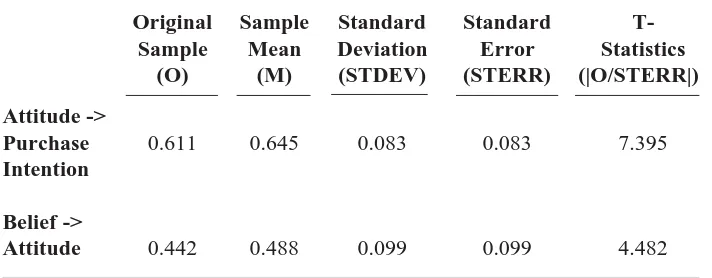
The analysis results show accor-dance with the existing data. As hy-pothesized in H1, belief positively and significantly influences attitude toward the firm. Similarly, as hypothesized in H2, attitude positively and significantly affects purchase intentions (Table 8). Charity activities began immedi-ately after the earthquake on May 27, 2006. In pro-social behavior, these activities (phenomena) are categorized as having different motivations and objectives. The beneficiaries of school reconstructions do not feel that their self-esteem is endangered or disgraced with respect to their competencies, such that their reactions are emotion-ally positive and less likely to refuse the supports. According to the attribu-tion theory, people are motivated to understand why they need help and why other people offer help. If they can relate their needs to external power that is uncontrollable or beyond their
competencies, they could maintain their self-esteem positively.
This study finds that people tend to reciprocate the received supports. With regard to the firm that has helped them in the form of CSR, it seems that the consumers have a positive attitude toward the firm. This attitude toward the firm fully mediates between belief and purchase intention toward the prod-ucts of the firm.
Conclusions, Limitations,
and Suggestions
The objective of this paper is to investigate whether CSR leads to a decrease in competitiveness by identi-fying beliefs, attitudes, and purchase intentions of the consumers of the CSR program toward the products of the firm. The findings do not support the CSR activities, especially CSR-phi-lanthropy, thereby resulting in a de-crease in competitiveness. This is clearly seen in the testing of belief, attitude, and purchase intention, where Table 8. The Cooeficient of Regression Beta and T-Value
Original Sample Standard Standard
T-Sample Mean Deviation Error Statistics
(O) (M) (STDEV) (STERR) (|O/STERR|)
Attitude ->
Purchase 0.611 0.645 0.083 0.083 7.395
Intention
Belief ->
attitude fully mediates the relation between belief and purchase inten-tion.
This research has contributed to improving our understanding of the effect of CSR activities on consumers. From the pro-social theory perspec-tive, CSR activities performed by firms indicate how the firms pro-socially respond to a particular condition. When the firms are faced with an emergency situation, they take five important steps, which include the decision making to inhibit or to give a chance to pro-social responses. The firms have to realize the emergency situation, appropriately interpret the ongoing moment, take a responsibility and capacity to help, and make a decision to help. These steps are particularly performed when the firms are interested in an event and attribute it as an uncontrollable mo-ment. From the attribution theory per-spective, CSR activities are based on the expectation that the program re-cipients can make correspondent in-ferences that the firms have performed positive activities, which in turn may improve the firms’ (and their prod-ucts’) images.
From the perspective of value-expectancy and hierarchy of effect models, the decision to have a particu-lar behavior is a result of rational pro-cesses directed to a particular goal, and it follows a logical sequence. Be-havioral preference is considered, con-sequences and results of the behavior are evaluated, and a decision on whether to take actions is then made. CSR activities result in the formation
of beliefs and attitudes of the recipi-ents toward the firms. Positive attitude toward a firm will in turn generate the intention to buy the products of the firm.
In principal, CSR communications are similar to product/service market-ing communications, which are to cre-ate a positive perception of the tar-geted public. The involvement of the targeted public in CSR communica-tions is an advantage when compared to other marketing communications. On the other hand, the disadvantage is that the results of CSR communica-tions may be capitalized on only in the long run. In some cases in Indonesia and other countries, CSR communica-tion is a crisis communicacommunica-tion, mean-ing that when firms are challenged by crisis circumstances, they will imple-ment CSR communications. One of the rationales is that those firms fear for a vast array of donation proposals and also prejudice in the society. This study suggests that it is not necessary for a firm to wait until the crisis occurs to implement CSR communications. This is in line with the results of study carried out by Fombrun et al. (2000), which finds that CSR communications could be justified as a strategy in which the company can decrease or limit the potential negative consequences of a crisis.
How-ever, in phase 2, this study uses a survey to consumers (those benefited by CSR program in the form of school reconstruction). In the future, this sur-vey can be extended to other consum-ers, including partnerships with
farm-ers and health services. It is also neces-sary to test if other forms of CSR programs, other than philanthropy, also affect the correlation between con-sumers and the firm’s products.
References
Abidin, H., A. Prihatna., Z. Saidi., R. A. Suprapto., S. Supomo and Kurniawati. 2003. Sumbangan Sosial Perusahaan. Jakarta: Piramedia.
Ajzen, I., and Fishbein, M. 2000. Attitude and the attitude-behavior relation: Reasoned and automatic processes. In Strobe, W., and Hewstone, M. (Eds.), European Review Social Psychology. Chichester England: Wiley: 1-33.
Ajzen, I. 2001. Nature and operation of attitudes. Annual Review Psychology 52 (1): 27-58.
Assael, H. 2001. Consumer Behavior and Marketing Action (6th ed.). Singapore:
Thomp-son Learning.
Baron, R. A., and D. Byrne. 2003. Social Psychology (10th ed.). New York: Pearson
Education.
Bailey, K. D. 1994. Methods of Social Research (4th ed.). New York: Free Press.
BAPPENAS. The Provincial and Local Governments of D.I.Yogyakarta, the Provincial and Local Governments of Central Java and International Partners. 2006. Prelimi-nary Damage and Loss Assessment: Yogyakarta and Central Java Natural Disaster. Jakarta: World Bank and Asian Development Bank.
Barone, M. J., A. D. Miyazaki., and K. A. Taylor. 2000. The Influence of Caused-Related Marketing on Consumer Choice: Does One Good Turn Deserve Another? Academy of Marketing Science 28 (2): 248-262.
Barry, T. E. 1987. The Development of the Hierarchy of Effects: An Historical Perspec-tive. In Leigh, J.H., and Martin, C.R. (Eds.), Current Issues and Research in Advertising 10. Ann Arbor: Division of Research, Graduate School of Business Administration, University of Michigan, 251-296.
Becker-Olsen, K. L., B. A. Cudmore., and R. P. Hill. 2006. The Impact of Perceived Corporate Social Responsibility on Consumer Behavior. Journal of Business Re-search 59: 46-53.
Berelson, B. 1952. Content Analysis in Communication Research. New York: Hafner Press.
Birkinshaw, J., A. Morrison., and J. Hulland. 1995. Structural and Competitive Determi-nants of A Global Integration Strategy. Strategic Management Journal 16 (8): 637-655.
Brown, T. J. and P. A. Dacin. 1997. The Company and the Product: Corporate Associa-tions and Consumer Product Responses. Journal of Marketing 16: 68-84.
Bryman, A. 1988. Quantity and Quality in Social Research. London: Unwin Hyman. Churchill, G. A. 2001. Basic Marketing Research (4th ed.). Chicago: The Dryden Press.
Chwelos, P., I. Benbasat., and A. Dexter. 2001. Research report: Empirical test of an EDI adoption model. Information Systems Research 12 (3): 304-321.
Cooper, D. R. and P. S. Schindler. 2006. Business Research Methods (9th ed.). Boston:
McGraw-Hill International Edition.
Copley, J. W. 1988. Relationships Between Beliefs, Attitudes, Intentions and Perception in An Hypnotic Induction: An Examination of Two Models of Estimating Future Behavior. Texas: Graduate Faculty of Texas Tech University. Dissertation, Not Published.
Creyer, E. H., and W. T. Ross. 1997. The influence of firm behavior on purchase intention: Do consumer really care about business ethics? Journal of Consumer Marketing 14 (6): 419-432.
DePaulo, B. M., P. L. Brown., S. Ishii., and J. D. Fisher. 1981. Help that works: The effects of aid on subsequent task performance. Journal of Personality and Social Psychol-ogy 41: 478-487.
Dharmmesta, B. S. 1998. Theory of planned behavior dalam penelitian sikap, niat dan perilaku konsumen. Kelola 18 (VII): 85-103.
Ellen, P. S., L. A. Mohr., and D. J. Webb. 2000. Charitable programs and retailer: Do they mix? Journal of Retailing 76 (3): 393-406.
Faturochman. 2006. Pengantar Psikologi Sosial. Yogyakarta: Pustaka.
Fishbein, M., and I. Ajzen. 1980. Understanding Attitudes and Predicting Social Behav-ior. New Jersey: Prentiss-Hall, Inc.
Fisher, D. J., A. Nadler., and S. Whitcher-Alagna. 1982. Recipient reactions to aid. Psychological Bulletin 91: 27-54.
Fombrum, C. J., N. A. Gardberg., and M. L. Barnett. 2000. Opportunity platforms and safety nets: Corporate citizenship and reputation risk. Business and Society Review 105 (1): 85-106.
Fornell, C., and D. F. Larcker. 1981. Evaluating structural equation model with unobserv-able and measurement error. Journal of Marketing Research XVIII: 39 - 50. Frederick, W. C. 1994. From CSR1 to CSR2. Business and Society 33 (2): 150-164. Ghozali, I. 2005. Aplikasi Analisis Multivariate dengan Program SPSS. Semarang: Badan
Penerbit Universitas Diponegoro.
Graham, J. L., A. T. Mintu., and W. Rodgers. 1994. Explorations of negotiation behaviors in ten foreign cultures using a model developed in the United States. Management Science 40 (1): 72-95.
Griffin, J. J. 2000. Corporate Social Performance: Research Directions for the 21st
Century. Business and Society 39 (4): 479-491.
Hendarto, K. A. 2008. Tanggung jawab sosial dan lingkungan perusahaan (CSR) di Indonesia dalam wacana pers nasional. Proceeding, Konferensi Nasional Forum Manajemen Up 2 Date. Surabaya: Universitas Airlangga.
Hervey, J. H., W. J. Ickes., and R. F. Kidd. 1976. New Directions of Attribution Research (Vol. 1). New Jersey: Lawrence Erlbaum Associates Publisher.
Holsti, O. R. 1963. The quantitative analysis of content. In Robinson, J. A., ed., Content Analysis: A Handbook With Application for the Study of International Crisis. Northwestern: Northwestern University Press: 37-53.
Inkpen, A. C., and J. Birkinshaw. 1994. International joint ventures and performance: An interorganizational perspective. Business Review 3 (3): 201-217.
Irwanto. 2006. Focused Group Discussion: Sebuah Pengantar Praktis. Jakarta: Yayasan Obor Indonesia.
Irwin, R. L., T. Lachowetz., T. B. Cornwell., and J. S. Clark. 2003. Cause-related sport sponsorship: An assessment of spectator beliefs, attitudes, and behavioral intentions. Sport Marketing Quarterly 12 (3): 131 - 139.
Jo, M. S., J. E. Nelson., and P. Kiecker. 1997. A model for controlling social responsibility bias by direct and indirect questioning. Marketing Letter 8 (4): 429-437.
Jogiyanto, H. M. 2008. Pedoman Survei Kuisioner: Mengembangkan Kuesioner, Mengatasi Bias dan Meningkatkan Respon. Yogyakarta: Badan Penerbit Fakultas Ekonomika dan Bisnis UGM dan Majelis Guru Besar UGM.
Junaedi, S. 2006. Pengaruh orientasi nilai, afek dan pengetahuan ekologikal pada komitmen pembelian produk yang berwawasan lingkungan: Studi perilaku konsumen pangan organik. Dissertation (Not Published). Yogyakarta: Sekolah Pascasarjana UGM. Kassarjian, H.H. 1977. Content analysis in consumer research. Journal of Consumer
Research 4: 8-18.
Krippendoff, K. 1980. Content Analysis: An Introduction to Its Methodology. Baverly Hill CA: Sage.
Krueger, R. A. 1994. Focus Groups: A Practical Guide for Applied Research (2nd ed.).
Thousand Oaks CA: Sage.
Lee, D. Y. 2001. Power, conflict and satisfaction in IJV supplier-Chinese distributor channels. Business Research 53 (2): 149-160.
Lee, H., T. Park., H. K. Moon., Y. Yang., and C. Kim. 2008. Corporate philanthropy, attitude toward corporations, and purchase intention: A South Korea atudy. Journal of Business Ethics. DOI 10.1016/j.busres.2008.08.007.
Mahmood, M. A., K. Bagchi., and T. C. Ford. 2004. On-line shopping behavior: Cross-country empirical research. International Journal of Electronic Commerce 9 (1): 9-30.
Malhotra, N. K. 2004. Marketing Research: An Applied Orientation (4th ed.). Upper
Saddle River: Prentice Hall.
——————. 2005. Attitude and affect: New frontiers of research in the 21st Century. Journal of Business Research 58: 477-482.
Mashoedi, S. F. 2009. Tingkah laku menolong. In Sarwono, S. W., and E. A. Meinanrno. (Eds.), Psikologi Sosial. Jakarta: Salemba Humanika: 121-144.
Mowen, J. C., and M. Minor. 2001. Consumer Behavior (5th ed.). New York: Harcout, Inc.
Nijssen, E. J., and S. P. Douglas. 2008. Consumer world-mindedness, social-mindedness and store image. Journal of International Marketing 16 (3): 84-107.
Peter, J. P., and J. C. Olson. 1996. Consumer Behavior and Marketing Strategy (4th ed.).
New York: Richard D. Irwin, Inc.
Pinto, J. R., A. I. R. Escudero., and J. G. Cillian. 2008. Order, positioning, scope, and outcomes of market entry. Industrial Marketing Management 37 (2): 154-166. Pirouz, D. M. 2006. An Overview of Partial Least Square. Accessible from: http://
www.merage.uci.edu/%7Edipirouz04/. [Accessed 6th October 2009].
Pomering, A., and S. Dolcinar. 2008. Assessing the prerequisite of successful CSR implementation: Are consumers aware of CSR initiatives? Journal of Business Ethics DOI 10.1007/S10551-008-9729-9.
Roediger, H. L., J. P. Rushto., E. D. Capaldi., and S. G. Paris. 1984. Psychology (9th ed.).
Boston: Little Brown and Company.
Sciffman, L. G., and L. L. Kanuk. 1999. Consumer Behavior (7th ed.). New Jersey: Upper
Saddle River.
Sears, D. O., J. L. Freedman., and L. A. Peplau. 1985. Social Psychology (5th ed.). Boston:
Prentice-Hall, Inc.
Scott, W. 1955. Reliability of content analysis: The case of nominal scale coding. Public Opinion Quarterly 17: 321-325.
Shaw, M. and P. H. Curtanzo. 1982. Theories of Social Psychology. New York: McGraw-Hill.
Shimp, T. A. 2000. Advertising Promotion and Supplemental Aspect of Integrated Marketing Communications (5th ed.). Ohio: South-Western College Publication.
Simmons, C. S., and K. L. Becker-Olsen. 2004. Achieving marketing objectives through social sponsorships. Journal of Marketing 70: 154-169.
Smith, S. M., and D. S. Alcorn. 1991. Cause marketing: A new direction in the marketing of corporate responsibility. The Journal of Consumer Marketing 8 (3): 19-35. Steward, D. W. and Shandasani. 1990. Focus Groups: Theory and Practice. Thousand
Oaks CA: Sage.
and E. A. Meinanrno. (Eds.), Psikologi Sosial. Jakarta: Salemba Humanika: 21-49. Tessler, R. C., and S. H. Schwartz. 1972. Help-seeking, self-esteem, and achievement
motivation. Journal of Personality and Social Psychology 21: 318-326.
Wagner T., R. J. Lutz., and B. A. Witz. 2009. Corporate hypocrisy: Overcoming the threat of inconsistent corporate social responsibility perceptions. Journal of Marketing 73: 77-91.
Webb, D. J., and L. A. Mohr. 1998. A typology of consumer responses to cause-related marketing: From skeptics to socially concerned. Journal of Public Policy and Marketing 17 (2): 226-238.
Wicaksono, B. 2005. Diskusi kelompok terarah. In Dwiyanto, A., (ed.), Mewujudkan Good Governance Melalui Pelayanan Publik. Yogyakarta: Gadjah Mada University Press: 278-301.
Woodside, A. G. 2010. Bridging the chasm between survey and case study research: Research methods for achieving generalization, accuracy, and complexity. Industrial Marketing Management 39: 64-75.
APPENDIX 2. Profile of Elementary Schools
School Address CSR’s Company Respondent
Name
Sawit Sawit, Gantiwarno, PT Astra Honda Motor 62
Klaten (validity and
realibility)
Dahromo Dahromo, Pleret, PT Astra Honda Motor 58 Bantul
Sanggrahan Kemudo, Prambanan, PT Sari Husada 46 Klaten
Pesu Pesu, Wedi, Klaten Eka Tjipta Foundation 62 (Sinar Mas Grup)
APPENDIX 1. Informants Involved in FGD
No Name Forms of CSR Companies
1 Indarti Development of Pertiwi
Kindergaten Building, PT Sari Husada Kemudo
2 Siti Subiati Development of School- PT Astra Honda building of Dahromo Motor
Elementary School, Pleret
3 Sutanto Development of Building of PT Media Group PUSKESMAS II Berbah
4 Aris Daryono “Bagimu Guru”, newspaper PT Gramedia subscription at special rate
5 Slamet Partnership with black soybean PT Unilever farmers
6 Gunarso Tobacco farming partnership PT Perkebunan Nusantara IX
7 Widiantoro Moderator Indonesia
Gadjah Mada International Journal of Business, September-December 2009, Vol. 11, No. 3
APPENDIX 4. Coding Sheet
1. Title of Program :
2. Day :
3. Date :
4. Moderator :
5. Topic :
6. Number of Participants :
7. Language(s) spoken : Indonesian Javanish Both
8. Format of Program : Interactive Interview Both
8. Participants of discussion (informan) are the persons who
have felt the benefit of corporate CSR Yes No
9. Moderator asks informan’s perception on the companies implementing CSR Yes No
10. Moderator is in neutral position to what is said by informant Yes No
11. Informans state that CSR has positive impact on them Yes No
12. Informans state that CSR also has positive impact on community Yes No
13. Informans have favour (good) feeling to companies implementing CSR Yes No
14. Informans state that they have close relation with the companies
implementing CSR Yes No
15. Informans state that CSR improve corporate image Yes No
16. Informans state that corporate CSR can be information to introduce
the company’s products Yes No
17. Informans correlate the companies implementing CSR and the products Yes No
18. Informans are likely to prefer the products from the companies
that give aid to them (loyal) Yes No
19. Informans state that CSR is a corporate strategy (marketing) Yes No
20. Informans state that CSR has to be regulated by the government Yes No
21. Some informans state that CSR is obligatory for corporates Yes No
22. Some informans state that CSR is implemented only when
corporates get profits Yes No
23. Some informans state that for particular matters, CSR
is implemented after the community request for it Yes No
24. Informans state that corporate CSR can be in
APPENDIX 5. Explanation for Coding Sheet
1. Title of Program : write the title of program 1 0
2. Day : write the-day of program 1 0
3. Date : write the date of program 1 0
4. Moderator : write the name of the moderator 1 0
5. Topic : write the topic 1 0
6. Number of Participants : write the number of participants 1 0
7. Language(s) spoken Clear enough 1 0
8. Format of Program Interactive:multilateral 1
Interview: unilateral 0
8. Participants of discussion (informan) are the
persons who have felt the benefit of corporate CSR Clear enough 1 0
9. Moderator asks informan’s perception on Perception: cognitive process
the companies implementing CSR in everybody in understanding
the information of environment, eitherby seeing, listening,
smelling, or comprehending 1 0
10. Moderator is in neutral position to what is said
by informant Neutral: impartial 1 0
11. Informans state that CSR has positive impact
on them Clear enough 1 0
12. Informans state that CSR also has positive impact
on community Clear enough 1 0
13. Informans have favour (good) feeling to
companies implementing CSR. Clear enough 1 0
14. Informans state that they have close relation with
the companies implementing CSR. Clear enough 1 0
15. Informans state that CSR improve corporate image Clear enough 1 0
16. Informans state that corporate CSR can be
information to introduce the company’s products Clear enough 1 0
17. Informans correlate the companies implementing
CSR and the products. Clear enough 1 0
18. Informans are likely to prefer the products from
the companies that give aid to them (loyal). Loyal: no change of mind
towards something 1 0
19. Informans state that CSR is a corporate strategy
(marketing). Clear enough 1 0
20. Informans state that CSR has to be regulated
Continued from APPENDIX 5
21. Some informans state that CSR is obligatory for
corporates. Clear enough 1 0
22. Some informans state that CSR is implemented
only when corporates get profits. Clear enough 1 0
23. Some informans state that for particular matters, CSR is implemented after the community
request for it. Clear enough 1 0
24. Informans state that corporate CSR can be in non-material aid. (such as waste and groundwater
treatment, etc.). Clear enough 1 0
APPENDIX 6. Reliability Test on Phase 1
No Coder-1 Coder-2 Value
Coder-1 = Coder-2 J1
Coder-1 ≠ Coder-2 J1
1 1 1 1
2 1 1 1
3 1 1 1
4 1 1 1
5 1 1 1
6 1 0 0
7 1 1 1
8 1 0 0
9 1 1 1
10 1 1 1
11 1 1 1
12 1 1 1
13 1 1 1
14 1 1 1
15 1 1 1
16 1 0 0
17 1 1 1
18 1 1 1
19 1 1 1
20 1 1 1
Continued from APPENDIX 6
No Coder-1 Coder-2 Value
Coder-1 = Coder-2 J1
Coder-1 ≠ Coder-2 J1
22 1 1 1
23 1 1 1
24 1 1 1
R =
=
=
2 (C1,2)
C1 + C2
2 (21)
24 + 24
0.875
0.483
0.000 0.315
Bel_1 Bel_2
Belief
0.835 0.753 0.798
Bel_3 0.695
Attitude
B_Intention 0.888 0.656 0.848
0.561
Inten_1 Inten_2 Inten_3 Inten_4 Inten_5
W W W
W
W
W W W W W W W W
Alt_1 Alt_2 Alt_3
0.512
0.217 0.050 0.832 0.903 APPENDIX 7. Validity and Reliability Test on Phase 2
0.483
0.000 0.317
Bel_1 Bel_2
Belief
0.835 0.753 0.799
Bel_3 0.695
Attitude
B_Intention 0.888 0.658 0.848
0.563
Inten_1 Inten_3 Inten_4 Inten_5
W W W
W
W
W W W W W W W
Alt_1 Alt_2 Alt_3
0.511