Gadjah Mada International Journal of Business Vol. 19, No. 2 (May-August 2017): 145-166
Female Directors and Firm Performance:
Evidence from UK Listed Firms
0Pananda Pasaribu
Kwik Kian Gie School of Business, Jakarta, Indonesia
Abstract: The impact of female directors on firm performance has lacked consistency in the previously conducted empirical studies, which may be due to the endogeneity problem, or certain characteristics (i.e. governance, industry, competition). This study examines the relationship between female directors and firm performance by addressing those problems. This study analyses all non-financial UK listed firms during the period 2004-2012 and employs several econometric models. The regression results indicate that there is little evidence that female directors have a positive and strong relationship with firm perfor-mance. But, further analysis reports that the UK’s small listed firms experience a positive significant effect, because small firms do not suffer from the problem of over-monitoring and they have more flexibility in composing their boards of directors.
Keywords:board diversity; female director; size effect
JEL classification: G30, G34, J16
Pasaribu
146
Introduction
Gender diversity on the boards of di-rectors has been of major interest to corpo-rate governance in recent years. Because of the apparent under-representation of females on the boards of directors, some EU coun-tries (i.e. Norway, Finland) have introduced the idea of imposing quotas for female direc-tors on the boards of large corporations (Smith et al. 2006; Nekhili and Gatfaoui 2013; Chapple and Humprey 2014).
In the UK, although there has been no formal regulation or law, the Davies report explicitly recommends a 25 percent represen-tation by females on the boards of FTSE100 firms by 2015. As a consequence, the latest figures indicate that female directorships in FTSE index firms have increased from 12 percent in 2011 to 25 percent in 2014 (Stern 2014). In other words, the government inter-vention successfully allowed female candi-dates to gain better access to the UK listed firms’ boardrooms.
Nevertheless, knowledge of the impact of female directors on firm performance lacks consistency. Some studies (Erhardt et al. 2003; Carter et al. 2003; Campbell and Minguez-Vera. 2007; Luckerath-Rovers 2013; Liu et al. 2014; Strom et al. 2014, Green and Homroy 2016) report positive impacts, while others (Smith et al. 2006; Adams and Ferreira. 2009; Carter et al. 2010; Galbreath 2011; Jurkus et al. 2011; Ahern and Dittmar 2012) fail to report the same result.
The purpose of this study is to examine the relationship between female directors and firm performance. This study contributes to the governance studies, which specifically discuss female directors, via three channels. Firstly, this study uses rigorous econometric techniques in order to address the endo-geneity problems (Adams and Ferreira 2009;
Liu et al. 2014; Strom et al. 2014). Secondly, this study uses a larger dataset than previous related studies in the UK (Ryan and Haslam 2005; Gregory-Smith et al. 2013). Finally, this study adds analysis of the firms’ sizes, as the UK’s large listed firms encounter a certain kind of pressure in the composition of their boards’ members (Mallin and Ow-Yong 2008).
The analysis reveals that female direc-tors tend not to significantly influence firm performance. At first, the estimations of fe-male directors tended to have positive and significant estimations in the OLS model, but the sign and significance change in the two stage-least-square and GMM models, which suggests female directors and firm perfor-mance suffer from an endogeneity problem. Moreover, by splitting the sample, there is strong evidence that firm size may affect the relationship between female directors and firm performance. Small firms tend to gain the most benefits from appointing female di-rectors, because these firms suffer less from outside intervention than the large firms, in terms of composing their boards’ structures. The remainder of the study is organized as follows: Section 2 discusses the theoreti-cal perspective of board (gender) diversity. Section 3 and Section 4 look at the hypoth-eses development and research methodology respectively. Section 5 provides the empiri-cal evidence of the study. Finally, Section 6 is the conclusion of the study.
Literature Review
the understanding of the current and poten-tial market. (2) Board diversity improves cre-ativity and innovation because different races, ages, and genders are associated with different attitudes, cognitives, and beliefs. (3) Board diversity improves the decision mak-ing processes that lead to better problem solv-ing. (4) Board diversity enhances effective leadership. (5) Board diversity promotes glo-bal relationships and strategic advantages in global competition.
From the agency theory’s point of view, there are several ways to link gender diver-sity on the boards and agency problems. Firstly, Carter et al. (2003) argues that board diversity is equivalent to board independence, because diverse boards do not have the tra-ditional backgrounds that insider directors have. Thus, more diverse boards will reduce agency problems. Secondly, Ahern and Dittmar (2012) argue that appointing female directors can reduce the influence of a CEO, who may be pursuing his/her own private agenda, rather than working for the share-holders’ interests (Bebchuk and Fried 2005). Appointing female directors can also reduce the agency cost.
Hillman et al. (2000), supporting the resource based theory, argues that diverse boards provide more unique resources and information, that may benefit the decision making processes. Within a diverse board, there exist diverse perspectives and non-tra-ditional alternatives to certain problems. Hillman et al. (2007) argues that a board’s diversity shows the firm’s commitment to minorities, which can add legitimacy to a firm. It gives a signal that firms do promote equal opportunities for current and potential employees.
The stakeholder theory’s view is that the board’s main duty is to maintain good rela-tionships with the stakeholders (customers,
regulators, creditors, etc.). The proponents of the stakeholder theory argue that corporations should reflect their external environment, for instance their society, which is composed of different genders, races, and ethnic groups. As a result, gender diversity on the board is a rational consequence, or even an obligatory implication, for some countries. However, Rose (2007) argues that imposing such a law may not be appropriate for listed firms, as they are different from democratic institutions. The human capital theory is related to the directors’ characteristics which are use-ful and beneficial to firms. Singh et al. (2008) reports that female directors in FTSE100 companies tend to have an MBA degree and international experience. Sealy et al. (2007) reports that female directors tend to have a title with their name, for instance an academic title (Prof, Dr), civic or political titles (Dame, Baroness), or aristocratic titles (Lady, Honourable). Terjesen et al. (2009) reports that female qualifications are relatively simi-lar to male qualifications, but females tend to be less experienced than males in terms of their business experience. Similarly, Singh and Vinnicombe (2004) argue that the lack of female networks and experience in executive positions are the main reason why females are less attractive than their male counter-parts.
effec-Pasaribu
148
tiveness and firm performance. Terjesen et al. (2009) argues that female directors can improve a board’s effectiveness and firm per-formance in many ways, but they may not directly influence a firm’s bottom line, due to multi-level processes.
Hypothesis Development
There are two objectives in the study: (1) examining the effect of gender diversity on the boards and (2) examining the effect of gender diversity on firm performance, with respect to firm size. This section tries to develop the hypotheses for each of the study’s objectives.
Gender Diversity and Firm
Performance
Gender inequality on the boards of di-rectors has been a systemic problem in the corporate world. Consequently, governments, particularly in the developed countries, have imposed quotas to increase the presence of females on the boards. They argue that in-creasing the diversity of the boards brings a larger pool of talent, in terms of their exper-tise, experience, and connections, which leads to better governance and firm performance (The Davies report 2012). This means that there is a positive relationship between fe-male directors and firm performance
However, prior empirical studies have been inconsistent in their reporting of the contribution of female directors to firm per-formance. Several studies have found a posi-tive association between gender diversity and firm performance (Carter et al. 2003; Erhardt et al. 2003; Carter et al. 2003; Campbell and Minguez-Vera 2007; Luckerath-Rovers 2013).
There are two reasons why these stud-ies successfully report a positive association.
Firstly, all of the empirical analyses in those studies are not that advanced, which makes it difficult to decide whether the result is cor-rect, or implies an endogeneity issue. Sec-ondly, most of them were conducted in the early 2000s, when the quota rules on gender diversity had not yet been introduced. Firms in the 1990s and the early 2000s had more flexibility in composing their boards than those in the middle or late 2000s do.
While most of those studies focused on firms in developed countries, Liu et al. (2014) investigated gender diversity in Chinese listed firms and Strom et al. (2014) used firms from 73 developing countries. Both studies report that female directors significantly affect firm performance in the developing markets, in which listed firms are less regulated.
By contrast, other studies do not find evidence that females directly influence firm performance. Adams and Ferreira (2009) re-port a negative association between female directors and firm performance in the US. A positive association cannot be found in the Scandinavian countries, in which gender di-versity has been mandated by law (Smith et al. 2006; Rose 2007 Ahern and Dittmar 2012).
Consistently, the UK-based studies tend to indicate that there is no positive associa-tion between gender diversity on the boards and firm performance. Haslam et al. (2010) reports that there is no association between the presence of female directors on a board and firm performance for FTSE100 compa-nies. Gregory-Smith et al. (2013) did not find evidence that the presence of females on boards is associated with higher firm perfor-mance.
boards comprising of 25 percent female di-rectors. It means that firms appoint female directors because of pressure being applied, rather than for strategic reasons or the quali-fications of the candidates. This kind of pres-sure does improve firm performance (Ahern and Dittmar 2012; Low et al. 2015). There-fore, the null hypothesis is:
H1 : Gender diversity on the boards has no impact on firm performance in the UK.
Firm Size Effect
The size of firm has been scrutinized in finance studies such as in the models of asset pricing (Fama and French 1993), the decisions of financing or capital structure (Berger and Udell 1995), the decisions of merger and acquisition (Moeller et al. 2004; Offenberg 2009), and the effectiveness of the board of directors (Setia-Atmaja 2008). In other words, the size of firms have impor-tant role in many aspects of finance studies. In the UK, the market regulator imposes different standards in terms of disclosure and governance practices, according to the size of a firm. For instance, firms that are listed on the Alternative Investment Market (AIM) are not obliged to follow all the The UK Cor-porate Governance Code (Mallin and Ow-Yong 2008). In other words, the AIM firms are in a less-regulated environment than the large firms (e.g. FTSE100 and FTSE250). Dahya et al (2002) reported that there is a significant difference between large firms and small firms with regard to their compliance with the Cadbury recommendations. More-over, the recommendation to appoint more female directors is aimed at the FTSE100 firms (Davies Report 2012).
The recent report indicates that small firms may have different governance practices from the large firms among the Russell 3000 companies.1 Small firms tend to have less board committee (audit, compensation, nomi-nation) meetings, staggered boards, less in-dependent directors, and fewer females on their boards. This report supports previous studies, in which larger firms tend to have more non-executive directors (Denis and Sarin 1999) and entrenched CEOs (Hazarika et al. 2012), which leads to their low levels of gov-ernance index (Farag et al. 2014).
Appointing female directors is highly associated with a board’s effectiveness (Adams and Ferreira 2009; Jurkus et al. 2011; Abbot et al. 2012; Srinidhi et al. 2011; Kyaw et al. 2015; Chen et al. 2016) in terms of: (1) better governance and a good atmosphere in the board room; (2) accountability and trans-parency in financial reporting; (3) improved decision-making in investment and financing decisions. Appointing female directors to firms with strong governance, which is proxied by the large firms, leads to the prob-lem of over-monitoring. Therefore, the null hypotheses with respect to firm size are:
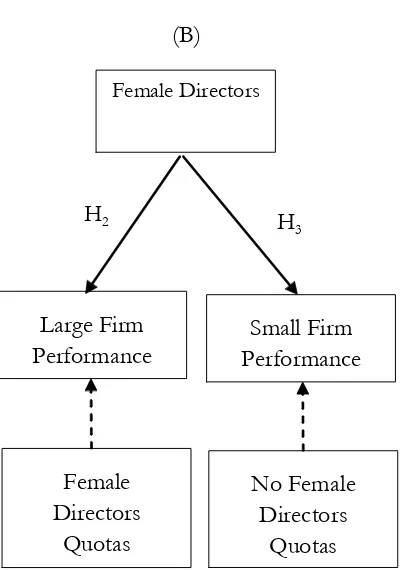
H2 : Gender diversity on the boards has no impact for large listed firms in the UK
H3 : Gender diversity on the boards has no impact for small listed firms in the UK
Research Framework
This study tries to investigate the rela-tionship between female directors and firm performance by examining without (Figure 1.a) and with (Figure 1.b) the effect of firm size. As the composition of the boards of large firms tends to suffer from government
Pasaribu
150
interference, particularly in the developed countries, the effect of female directors in large firms may be less significant than in the small firms. The research framework can be seen in Figure 1.
Methods
This section is divided into three parts, which are the sample and data, the regres-sion model and variables, and the instrumen-tal variables.
Sample Selection and Data
Sources
This study uses all the non-financial firms listed in the UK over a nine-year pe-riod (2004-2012), as the quality of the data on directorships is poor prior to 2004. In or-der to be included in this study, there are sev-eral requirements which needed to be fulfilled:
(1) the firms must be non-financial firms, those that have an Industry Classification Benchmark (ICB) equal to 8 are excluded from the sample; (2) due to the lack of avail-able data on boards of directors, the head-quarters of the selected firms must be in the UK.
This study uses multiple sources to ob-tain the variables under investigation. The data on firms’ board characteristics were mostly obtained from the Financial Analysis Made Easy (FAME) database, such as thename, date of birth, nationality, gender, date of appointment, of directors. The posi-tions (e.g. CEO, chairman, financial director) and functions (e.g. executive and non-execu-tive) are obtained from the Thomson ONE Banker and the Bloomberg databases, which were hand-collected. Proxies for firms’ per-formance came from the FAME and the Bloomberg databases.
Female Directors
Firm Performance Large Firm
Performance Female Directors
Small Firm Performance (A)
H2
Female Directors
Quotas
No Female Directors
Quotas
H1 H3
Regression Model and Variables
The general form of the regression model is as Equation 1.
Firm
Perfomanceit =
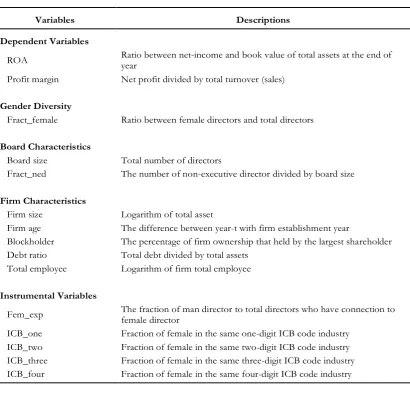
...(1) Where i indexes the firms and t is a yearly time index. The kand t variables represent the firms’ industry and year respectively. The female directors’ measure is the fraction of female directors on the boards, while the boards’ characteristics, and firms’
character-istics contain several variables which can be seen in Table 1.
There were three regression models used in this study, which were the OLS model, the two-Staged Least Square (2SLS) model and the Arellano-Bond model. Previ-ous studies (Adams and Ferreira 2009; Liu et al. 2014) indicate that the OLS model is prone to causal problems, in which positive estima-tions mean well-performing firms tend to appoint female directors rather than the pres-ence of female directors increasing firm per-formance. This term is known as the endogeneity problem.
+ Female_Directors_Measureit + Board_Characteristicsit + Firm_Characteristicsit + k
+ t + eit
Variables Descriptions
Dependent Variables
ROA Ratio between net-income and book value of total assets at the end of year
Profit margin Net profit divided by total turnover (sales)
Gender Diversity
Fract_female Ratio between female directors and total directors
Board Characteristics
Board size Total number of directors
Fract_ned The number of non-executive director divided by board size
Firm Characteristics
Firm size Logarithm of total asset
Firm age The difference between year-t with firm establishment year
Blockholder The percentage of firm ownership that held by the largest shareholder
Debt ratio Total debt divided by total assets
Total employee Logarithm of firm total employee
Instrumental Variables
Fem_exp The fraction of man director to total directors who have connection to female director
ICB_one Fraction of female in the same one-digit ICB code industry
ICB_two Fraction of female in the same two-digit ICB code industry
ICB_three Fraction of female in the same three-digit ICB code industry
ICB_four Fraction of female in the same four-digit ICB code industry
Pasaribu
152
Wooldridge (2010) recommends a two-step procedure to address this endogeneity. The first step is to regress the suspected en-dogenous variable, which is the female direc-tors, with all the possible predetermined vari-ables. The second step is to use the predicted values of the endogenous variable from the 1st regression as an explanatory variable in the model of interest.
In order to employ the 2SLS models, it is necessary to find the instrumental ables. This study used two instrumental vari-ables to address them. The varivari-ables are the male directors’ connection to the female di-rectors (Adams and Ferreira 2009; Levi et al. 2013) and the fraction of female directors in the same industry (Brammer et al. 2007; Liu et al. 2014). It is expected that both variables are positive.
The Instrumental Variable model (1st stage regression) is:
Female Directorsit =
...(2) The final model is the Arellano-Bond model. This model is known as a dynamic model because the model includes the lagged firm performance as an explanatory variable. Thus Equation 2 is transformed into:
Female Directorsit =
The specification of the Arellano-Bond model is very important when addressing the endogeneity issue. This study employs the same approach as Adams and Ferreira (2009),
who used two lagged periods and all the sub-sequent lagged periods of firm performance, and the one period lag of the independent variables as the instrumental variables.
This study used two dependent vari-ables, which are the Return On Assets (ROA) and the profit margin. Both measures have been widely used in previous female director related studies, for instance ROA is in Erhardt et al. (2003), Adams and Ferreira (2009), and Strom et al. (2014) while the profit margin has been used by Smith et al. (2006) and Liu et al. (2014). The full definitions of the de-pendent and indede-pendent variables can be seen in Table1.
Results
This section is divided into four sections, which are the descriptive analysis, instrumen-tal variable analysis, regression analysis, and research discussion.
Descriptive Analysis
Table 2 indicates the development of female directors in the UK’s non-financial listed firms. There is a tendency that more listed firms are hiring female directors. In 2004, 73.8 percent of the total number of firms did not have a female on their board, but that figure has reduced to 59 percent by 2012. The fraction of female directors who sit on the boards has increased gradually, from 5.0 percent to 8.8 percent during the period 2004 to 2012.
Even though more female directors have been appointed, the proportion of females who are hired as executive directors has tended to be stagnant. The fraction of non-executive female directors has increased by more than twice between 2004 and 2012, while the fraction of executive directors re-mains at around 2.5 percent.
+ Male_connectionit + Demale_industryit
Outsider_code equals to 1 if the CEO is not the owner or CEO joins the firm less than 1 year, owner_code equals to 0 if else. Board_size is total of director. prop_ned is the fraction of non-executive director. prop_ined is the fraction of independent non-executive director. roa is net profit divided by total asset (ROA). prof_margin is net profit divided by total sales (profit margin). Asset is total firm assets. Employf2 is total firm employee. firm_age is the difference between end date of calendar year and firm establishment date. block is percentage owned by top blockholder. Debt_ratio is total debt divided by total asset. ICB_three is the fraction of female director within the same 3-digit industry code. Fem_exp is the fraction of male director who ever works with female director on other board. roa, prof_margin, asset, employe and debt_ratio are winsorized at 1 percent and Table 3. Descriptive Statistics
Table 2. The Development of Female Director in the UK listed Firms between 2004 and 2012
Directors are total individuals (directors) in the sample. Fraction of female is total female director divided by total directors. Female NED is total female non-executive director divided by directors. Female exec is total female executive director divided by total director. No female director is the fraction of firms with no female director. One female director is the fraction of firm with one female director. Two female directors is the fraction of firms with two female directors. Three or more female director is the fraction of firms with three or more female director. Female CEO is the fraction of firms with female CEO. Female Chair is the fraction of firm with chairwoman.
Variable N Mean StdDev Q1 Median Q3
CEO characteristics
Outsider_code 10,656 0.31 0.46 0.00 0.00 1.00
Board Characteristics
board_size 10,680 6.43 2.28 5.00 6.00 8.00
prop_ned 10,680 0.51 0.16 0.40 0.50 0.63
prop_ined 10,680 0.40 0.19 0.29 0.40 0.55
Firm Performance
roa 10,217 -0.08 0.37 -0.10 0.03 0.09
prof_margin 9,473 -2.10 10.95 -0.10 0.03 0.08
Firm Characteristics
asset ('000) 10,249 890,411 3,433,844 10,132 42,200 218,414
employ 10,049 4,533 14,035 53 255 1,714
firm_age 10,680 23.19 28.23 5.58 10.98 26.23
block 10,467 0.22 0.15 0.12 0.17 0.27
debt_ratio 10,246 0.51 0.34 0.28 0.48 0.67
Instrumental Variables
icb_three 10,656 0.07 0.03 0.04 0.06 0.09
fem_exp 10,680 0.30 0.26 0.00 0.25 0.50
Year Firms Number of Directors
Fraction of Females
Fraction of NED Females
Fraction of Executive
Females
Firms with no Female Director
Female
CEO Female Chair
2004 1,181 7,628 0.050 0.026 0.024 0.738 0.025 0.007
2005 1,366 8,787 0.056 0.030 0.026 0.717 0.031 0.007
2006 1,401 8,882 0.058 0.032 0.026 0.707 0.037 0.009
2007 1,373 8,765 0.059 0.032 0.027 0.706 0.039 0.012
2008 1,241 7,922 0.060 0.034 0.026 0.695 0.038 0.013
2009 1,119 7,104 0.063 0.038 0.025 0.685 0.036 0.013
2010 1,053 6,809 0.067 0.043 0.024 0.666 0.036 0.015
2011 998 6,500 0.074 0.050 0.024 0.643 0.035 0.018
P
a
s
a
r
ib
u
1
54
Variables 1 2 3 4 5 6 7 8 9 10 11 12 13 14 15 16 17 18
roa (1) 1.00
prof_margin (2) 0.35 1.00
dwomen (3) 0.13 0.07 1.00
fract_female (4) 0.10 0.06 0.87 1.00 owner_code (5) -0.08 -0.02 -0.09 -0.05 1.00 outsider_CEO (6) -0.04 0.00 0.01 0.00 -0.47 1.00 ln_bsize (7) 0.24 0.10 0.33 0.15 -0.25 0.06 1.00 prop_ned (8) 0.12 0.04 0.12 0.04 -0.28 0.15 0.35 1.00 debt_ratio (9) -0.19 0.13 0.06 0.02 -0.09 0.07 0.08 0.06 1.00 block (10) -0.06 -0.01 -0.05 0.00 0.12 -0.04 -0.15 -0.08 0.03 1.00 ln_firm_age (11) 0.23 0.16 0.11 0.09 -0.29 0.05 0.17 0.08 0.11 -0.09 1.00 ln_asset (12) 0.43 0.17 0.31 0.18 -0.34 0.09 0.68 0.42 0.12 -0.21 0.28 1.00 ln_employf (13) 0.39 0.24 0.30 0.18 -0.33 0.08 0.61 0.36 0.24 -0.19 0.35 0.88 1.00 icb_one (14) 0.03 0.04 0.23 0.23 -0.02 0.00 0.09 0.10 0.12 0.02 0.07 0.13 0.14 1.00 icb_two (15) 0.04 0.05 0.25 0.26 -0.02 -0.01 0.08 0.08 0.11 0.02 0.10 0.13 0.14 0.93 1.00 icb_three (16) 0.05 0.04 0.28 0.29 -0.02 -0.02 0.11 0.10 0.11 0.01 0.06 0.16 0.17 0.79 0.85 1.00 icb_four (17) 0.06 0.05 0.32 0.34 -0.02 -0.01 0.12 0.08 0.13 0.02 0.04 0.17 0.19 0.67 0.72 0.85 1.00 fem_exp (18) 0.18 0.08 0.25 0.18 -0.26 0.14 0.32 0.32 0.12 -0.19 0.12 0.54 0.51 0.15 0.15 0.17 0.17 1.00
Roa is the return on assets. Prof_margin is the profit margin. Dwomen equals 1 if the firm has at least one female director, Dwomen equals 0 if otherwise. Fract_female is the fraction of female directors. Female_exec is the fraction of female executive directors. Owner_code equals 1 if the CEO is a substantial shareholder (>3%), or a member of the family, or a founder, owner_code equals 0 if otherwise. Outsider_code equals 1 if the CEO is not the owner or the CEO joined the firm less than 1 year ago, owner_code equals 0 if otherwise. Block is the percentage owned by the top shareholder. Board_size is total number of directors. Prop_ned is the fraction of non-executive directors. Debt_ratio is the total debt divided by the total assets. Ln_Asset is the natural logarithm of the firm’s total assets. Ln_employf is the natural logarithm of the firm’s total employees. Ln_firm_age is the natural logarithm of (1 + firm_age). ICB_one is the fraction of female directors within the same 1-digit industry code. ICB_two is the fraction of female directors within the same 2-digit industry code. ICB_three is the fraction of female directors within the same 3-digit industry code. ICB_four is the fraction of female directors within the same 4-digit industry code. Fem_exp is the fraction of male directors who ever worked with female directors on other boards. Roa, prof_margin, asset, employeef, firm_age, block, debt_ratio are winsorized at 1 percent and 99 percent.
Yet, less than 4 percent of the total number of firms have appointed a female as their CEO. These results are relatively simi-lar to previous studies (Ahern and Dittmar 2012; Gregory-Smith et al. 2013), in which the increase in female participation on boards is more likely to be through the non-execu-tive function rather than any execunon-execu-tive func-tion, which could suggest that there still ex-ists gender bias in the appointment of the executive directors.
Table 3 shows the mean, median, stan-dard deviation, and 25th and 75th percentiles of the variables that are possibly used in the regression analyses. There is a significant dif-ference in the available observations in rela-tion to the firms’ profit margins. This discrep-ancy may be as a result of using two data-bases, which are the FAME database (UK-based) and the Bloomberg database (US-based). In this case, the Bloomberg database may not provide financial information on the firms that are being delisted or acquired by other firms.
The mean of board size for UK listed firms is between 6 and 7 directors, of which about half are non-executive directors. The final section in Table 3 shows the instrumen-tal variables, which are the fraction of females within the same 3 digit-ICB code and the fraction of male directors who work with a female director on other boards. The means of both variables are 7 percent and 28 per-cent respectively. The detail of these vari-ables is discussed in the next section.
Table 4 show the correlation between firm performance measures, female represen-tative measures and the other controls vari-ables. Multicolinearity is likely to happen when the absolute value of the coefficient correla-tion is close to 0.7 or higher. This study uses two proxies to measure firm size, which are firms’ total assets and firms’ total
employ-ees. Both variables have a strong positive correlation with board size. Large firms tend to have large boards as well. As a conse-quence, this study uses the total employees as a proxy of firm size rather than the total assets in the regression analysis.
The instrumental variables also have positive correlations with the fraction of fe-male directors, as previously expected. There is an early sign that firms tend to follow other firms with the same ICB code, in terms of the level of female participation on their boards. Likewise, the fraction of male direc-tors who work with female direcdirec-tors on other boards has a positive correlation with the number of female directors. Those relation-ships are substantially higher for firms with non-executive female directors than for firms with female executive directors.
Table 5 compares the firm characteris-tics between firms that have at least one fe-male director and firms with no fefe-male di-rectors, across firm-years. Most of the char-acteristics of a firm that hires at least one female director are different from those of firms with no female directors. Firms with female directors tend to be bigger (in terms of their total number of employees and board’s size), more profitable, more efficient, and be well established than the firms with no female directors. Table 5 indicates that firms with female directors tend to be more profitable than firms with no female direc-tors.
Instrumental Variable Analysis
Pasaribu
156
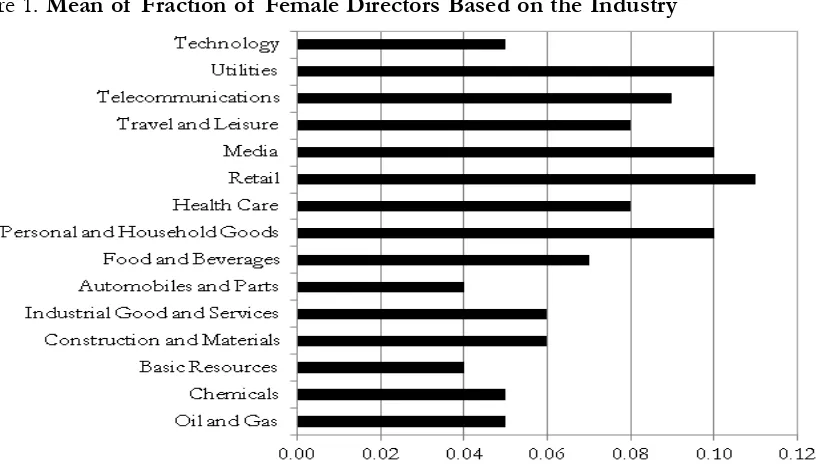
The participation of females on boards is also relatively high in the utilities and telecom-munications sectors. Conversely, the number of female directors is low for firms in auto-mobiles and parts, chemicals, basic resources,
and the oil and gas sectors. This instrumen-tal variable is expected to have a positive as-sociation with the fraction of female direc-tors in the regression analysis.
Figure 1. Mean of Fraction of Female Directors Based on the Industry
ROA is net profit divided by total asset. profit margin is net profit divided by total sales. Board size is total of director. Fraction of NED is the fraction of non-executive director. Total employee is total firm employee. Blockholder is percentage owned by top blockholder. Firm age is the difference between end date of calendar year and firm establish-ment date. Debt ratio is total debt divided by total asset. *** indicates significance at the 1 percent level
Table 5. Comparisons between Firm with and without Female Director
Firms Characteristics
Firms with Female
Director Female Director Firms without Difference
N Mean N Mean
ROA 3,233 -0.01 6,984 -0.11 0.10***
Profit Margin 3,093 -1.01 6,380 -2.63 1.62***
Board Size 3,337 7.59 7,343 5.89 1.70***
Fraction of NED 3,337 0.54 7,343 0.49 0.05***
Total Employee 3,199 12,501.50 6,850 2,361.40 10,140.10***
Blockholder 3,280 0.20 7,187 0.22 0.02***
Firm Age 3,337 26.85 7,343 21.54 5.31***
The Regression Analysis
This section is divided into two sec-tions, which are the analysis of all the obser-vations and the analysis of the small and large firms.
Analysis of female directors on firm performance
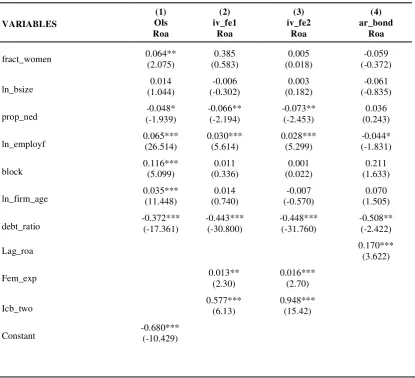
Table 6 presents the regression estima-tions between the ROA (dependent variable) and the independent variables for all the ob-servations.2 The fraction of female directors in the OLS regression analysis is positively associated with firms’ ROA, which is rela-tively the same as found by previous studies (Adams and Ferreira 2009; Liu et al. 2014). However, the results are prone to endogeneity problems
In Model 2 and Model 3, this study employs a two-stage least regression. Model 2 and Model 3 usethe fraction of males with connections to female directors (fem_exp) and the fraction of female directors in the same industry (icb_code) as the instrumen-tal variables. There are several ways to check the reliability and effectiveness of the instru-mental variables in the STATA software.
Firstly, it can be done by checking the signifi-cance of the instrumental variables in the first stage regression. When the instrumental vari-ables are statistically significant, the fraction of female directors is successfully instru-mented. Secondly, by checking the F-test in the first stage regression; when the F-test is lower than 10, then the models experience a weak instrumental variables problem. Thirdly, by checking the p-value of the Sargan statis-tics in the second stage regression. Fourthly, this study conducted an endogeneity test for
the suspected endogenous variable in the sec-ond stage regression. For the last two ap-proaches, when the P-value is higher than the 10 percent level, it can be inferred that the instrumental variables work properly and the problem can be fully addressed.
The results of first stage regression (Model 2 and Model 3) in Table 6 indicate that the instrumental variables are highly cor-related with the endogenous variable (the fraction of female directors). The signs of both Instrumental Variables (IVs) are posi-tive, which means that the more male direc-tors there are who have connections with fe-male directors then the more likely it is that firms will hire female directors. Moreover, it is likely that firms follow the composition of male and female directors in other firms within the same industry code.
Both Model 2 and Model 3 use the same instrumental variables, which are the fraction of male directors who work with female di-rectors (fem_exp) and the 2-digit industry code (icb_two). Generally, the more specific the industry classification is, the larger the F-test value is in the first stage regression, which may also be associated with the higher P-val-ues in the Sargan and endogeneity tests in the second stage regression. Both instrumental variables are relatively strong, with F-values in the first regression of more than 10. The Sargan statistic test and the endogeneity test are not significant at the 10 percent level per-cent.3 However, strong instrumental variables might affect the significance of the fraction of female directors. The estimations of fe-male directors are no longer statistically sig-nificant, although the coefficients are still positive.
2 This study also uses profit margin as a dependent variable, but the estimations are not presented in this publication. The estimations can be requested from the author.
Pasaribu
158
Model 4 is the Arellano-Bond two-step approach. The lag of one period of ROA is added in the regression as this model is a dy-namic model. As a consequence, the number of observations decreases. Two important statistics for creating the model are the Arellano-Bond for AR(2) value and the Hansen test for over-identification restric-tions. At the first attempt, the study uses one period of lag of the fraction of women di-rectors, but the Hansen test still reports sig-nificance at the 5.7 percent level. Conse-quently, the Arellano-Bond model is re-speci-fied by using a two period lag of the fraction of women directors. The endogeneity is fully addressed, with the P-value of Hansen’s test at more than the 10 percent level.
The findings in Table 6 show that there is a tendency that female directors can posi-tively influence firm performance. But, the estimations lack significance. Yet, there is the possibility that the effects may be negative in Model 4 (Table 6). Thus, this finding can-not reject the first hypothesis, in which there might be no association between female di-rectors and firm performance. This finding can be deemed robust as endogeneity has been addressed in both analyses.
The effects of female directors on firm performance with respect to firm size
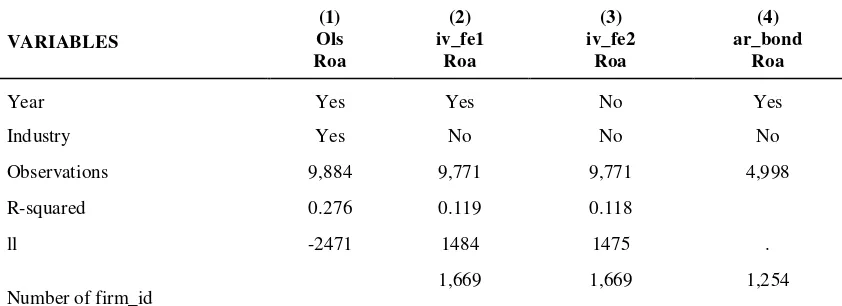
This analysis divides the observations into two sub-samples according to the size of the firms, which is the proxy of firm gov-Table 6. The Regression Estimations: ROA and Fraction of Female Directors
VARIABLES
(1) (2) (3) (4)
Ols iv_fe1 iv_fe2 ar_bond
Roa Roa Roa Roa
fract_women 0.064** 0.385 0.005 -0.059
(2.075) (0.583) (0.018) (-0.372)
ln_bsize (1.044) 0.014 (-0.302) -0.006 (0.182) 0.003 (-0.835) -0.061
prop_ned (-1.939) -0.048* -0.066** (-2.194) -0.073** (-2.453) (0.243) 0.036
ln_employf 0.065*** (26.514) 0.030*** (5.614) 0.028*** (5.299) (-1.831) -0.044*
block 0.116*** (5.099) (0.336) 0.011 (0.022) 0.001 (1.633) 0.211
ln_firm_age 0.035*** (11.448) (0.740) 0.014 (-0.570) -0.007 (1.505) 0.070
debt_ratio -0.372*** (-17.361) -0.443*** (-30.800) -0.448*** (-31.760) -0.508** (-2.422)
Lag_roa 0.170***
(3.622)
Fem_exp 0.013** 0.016***
(2.30) (2.70)
Icb_two 0.577*** (6.13) 0.948*** (15.42)
VARIABLES
(1) (2) (3) (4)
Ols iv_fe1 iv_fe2 ar_bond
Roa Roa Roa Roa
Year Yes Yes No Yes
Industry Yes No No No
Observations 9,884 9,771 9,771 4,998
R-squared 0.276 0.119 0.118
ll -2471 1484 1475 .
Number of firm_id 1,669 1,669 1,254
Weak-instrument-robust inference from 1st stage regression
Test of joint significance of endogenous regressors B1 in main equation
Ho: H1=0 and orthogonality conditions are valid
Anderson-Rubin Wald test F(28,086) = 1.25 p-val= 0.2875
Anderson-Rubin Wald test Chi-sq(2)= 2.50 p-val= 0.2867
Stock-Wright LM S statistic Chi-sq(2)= 2.50 p-val= 0.2868
Number of Regressors K = 15
Number of Endogenous Regressors K1= 1
Number of Instruments L= 16
Number of Excluded Instruments L1= 2
Test for IV (2SLS) Estimation
Sargan statistics (over identification test of all instruments): 2.153
Chi-sq (1) P-val= 0.1423
-Endog- option:
Endogeneity test of endogenous regressors:
0.133
Chi-sq (1) P-val= 0.7151
Table 6. Continued
Pasaribu
160
ernance. The analysis uses firms with total employees that are lower than the 25th quartile and higher than the 75th quartile, for small and large firms respectively.
Table 7 presents the estimations be-tween female directors and the ROA for small firms. Almost all of the coefficients of fe-male directors are positive and statistically significant. The endogeneity problem in Model 2 and Model 3 can be fully addressed. Consistently, the Arellano-Bond model shows that female directors can positively and sig-nificantly affect the ROA at the 5 percent level percent. Thus, the study rejects the third hypothesis.
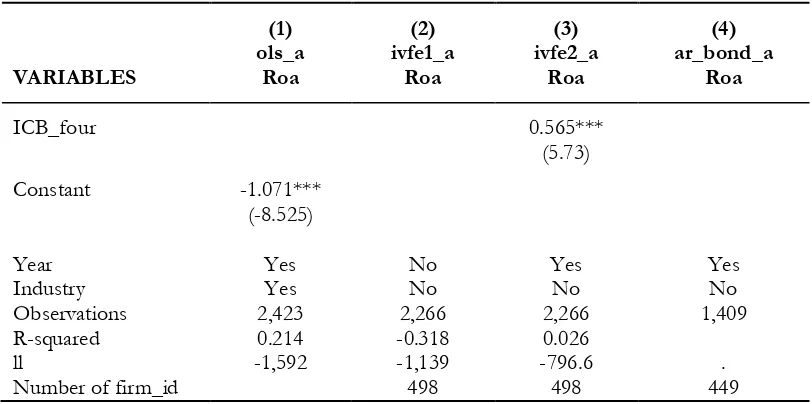
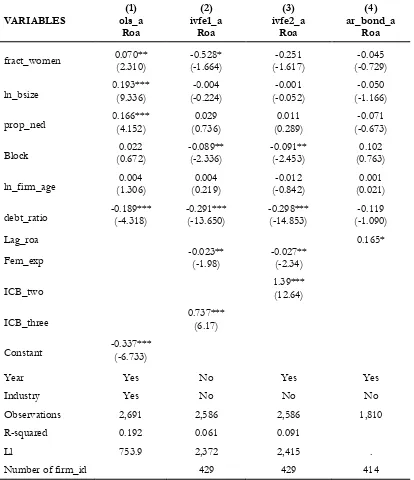
The next regression uses large firms only as the research observation. The effects of
female directors on large firms are substan-tially different from their effects on small firms. Table 8 shows that most of the esti-mations of female directors are negative. The effects are even statistically significant at the 10 percent level, after addressing the endogeneity problem (Model 2). The Arellano-Bond model supports the negative relation of female directors and the ROA for large firms although it lacks significance. Thus, the study cannot reject the second hy-pothesis.
One interesting result in Table 8 is the male directors’ connections with female di-rectors has an opposite direction to that ex-pected. The male directors’ connections do not affect the percentage of female directors
(1) (2) (3) (4)
ols_a ivfe1_a ivfe2_a ar_bond_a
VARIABLES Roa Roa Roa Roa
fract_women 0.216** 5.590 3.056** 0.751**
(2.086) (1.483) (2.438) (2.136)
ln_bsize 0.121*** -0.080 -0.025 -0.228*
(3.364) (-0.781) (-0.438) (-1.652)
prop_ned 0.027 -0.130 -0.157* -0.006
(0.424) (-1.220) (-1.729) (-0.026)
block 0.193*** 0.027 0.000 0.409*
(3.060) (0.213) (0.002) (1.871)
ln_firm_age 0.100*** 0.157* 0.024 0.181**
(8.481) (1.771) (0.723) (2.082)
debt_ratio -0.482*** -0.451*** -0.506*** -0.721***
(-13.832) (-5.442) (-11.764) (-3.184)
Lag_roa 0.145***
(2.911)
Fem_exp 0.015 0.017
(1.10) (1.26)
ICB_two 0.397
on the boards. It is likely that the females’ connections are not an essential feature for female director candidates to be appointed to large firms.
Research Discussion
There is a little evidence that the frac-tion of female directors can positively and directly influence firm performance as the relationship lacks significance. This study supports previous studies, which found diffi-culty in finding a direct and positive associa-tion between female directors and firm per-formance, such as those by Smith et al. (2006) Adams and Ferreira (2009), Jurkus et al. (2011), and Ahern and Dittmar (2012).
One of the possible reasons is due to imposing quotas, which forces the firms to appoint more female directors. The latest fig-ures have shown that firms tend to appoint women as non-executive directors, while the number of female executive directors – who are responsible for running the firm – remains stagnant (Stern 2014). The contributions of these non-executive female directors to firm performance are less visible, as they are re-sponsible for the monitoring roles, for ex-ample the CEOs’ turnover and financial re-porting standards.
Furthermore, the imposition of gender diversity is applied in the developed markets, while most of the stock market regulators in Table 7. Continued
Firm performance is regressed with the female directors’ measure and control variables. Small firms refer to firms with total assets lower than the 25th quartile. Roa is the net profit divided by the total assets (ROA). Fract_women is the fraction of
female directors on the board. ln_bsize is the natural logarithm of the total number of directors. Prop_ned is the fraction of non-executive directors. ln_emplyf is the natural logarithm of the total number of employees of the firm. Block is the percentage owned by the top shareholder. Ln_firm_age is the natural logarithm of (firm age +1). Debt_ratio is the total debt divided by the total assets. Lag_roa is a one period lag of ROA. ICB_two is the fraction of female directors within the same 2-digit industry code. ICB_four is the fraction of female directors within the same 4-digit industry code. Fem_exp is the fraction of male directors who ever worked with female directors on other boards. Model 1 employs the OLS estimation. Model 2 and Model 3 employ 2SLS with IV (Instrumental Variables). Model 4 employs the Arellano-Bond method. Roa and debt_ratio are winsorized at 1 percent and 99 percent. The robust t-statistics of each coefficient are shown in parentheses.
(1) (2) (3) (4)
ols_a ivfe1_a ivfe2_a ar_bond_a
VARIABLES Roa Roa Roa Roa
ICB_four 0.565***
(5.73)
Constant -1.071***
(-8.525)
Year Yes No Yes Yes
Industry Yes No No No
Observations 2,423 2,266 2,266 1,409
R-squared 0.214 -0.318 0.026
ll -1,592 -1,139 -796.6 .
Pasaribu
162
Table 8. Female Directors and ROA for Large Firms
(1) (2) (3) (4)
VARIABLES ols_a ivfe1_a ivfe2_a ar_bond_a
Roa Roa Roa Roa
fract_women 0.070** (2.310) (-1.664) -0.528* (-1.617) -0.251 (-0.729) -0.045
ln_bsize 0.193*** (9.336) (-0.224) -0.004 (-0.052) -0.001 (-1.166) -0.050
prop_ned 0.166*** (4.152) (0.736) 0.029 (0.289) 0.011 (-0.673) -0.071
Block (0.672) 0.022 -0.089** (-2.336) -0.091** (-2.453) (0.763) 0.102
ln_firm_age (1.306) 0.004 (0.219) 0.004 (-0.842) -0.012 (0.021) 0.001
debt_ratio -0.189*** (-4.318) -0.291*** (-13.650) -0.298*** (-14.853) (-1.090) -0.119
Lag_roa 0.165*
Fem_exp -0.023** (-1.98) -0.027** (-2.34)
ICB_two 1.39*** (12.64)
ICB_three 0.737*** (6.17)
Constant -0.337*** (-6.733)
Year Yes No Yes Yes
Industry Yes No No No
Observations 2,691 2,586 2,586 1,810
R-squared 0.192 0.061 0.091
Ll 753.9 2,372 2,415 .
Number of firm_id 429 429 414
Firm performance is regressed with the female directors’ measure and control variables. Large firms refer to firms with total assets higher than the 75th quartile. Roa is the net profit divided by the total assets (ROA). Fract_women is the fraction of female
the developing countries do not restrict it. In other words, firms in the developed countries have less flexibility to compose their optimal board structures, because their boards are assembled as a result of certain types of pres-sure being applied, rather than purely from their businesses’ perspectives.
In the UK’s case, the London Stock Exchange (LSE) is slightly more unique, in terms of its governance standards. Large listed firms experience stricter rules for their governance structures than the small listed firms do. The recommendation of gender di-versity on the boards is aimed at the FTSE100 firms rather than all the LSE listed firms. The UK’s small listed firms have the flexibility to appoint female directors, which can lead to better firm performance. There-fore, this study fails to show that female di-rectors do have positive and direct impacts on firm performance.
This result also can be explained from the theoretical perspective, namely the agency theory, the resource dependence theory, the stakeholder theory, and the human capital theory. The insignificance might be a result of the incompetency of female directors, or certain external pressures to appoint female directors (i.e. female directors’ quotas). In other words, the relationship between female directors and firm performance is not straight-forward because there are many theories that are involved in that relationship.
Consequently, the next analysis is to split the dataset into two categories, which are small firms and large firms. This analysis is so useful because the UK’s large listed firms are more regulated than the small listed ones. The findings indicate that female direc-tors significantly affect small firms’ perfor-mance after controlling the endogeneity prob-lem, while similar findings cannot be found for the large listed firms.
The results can be explained in two ways. Firstly, the over-monitoring problem: according to Carter el al (2003), board diver-sity may be equivalent to board indepen-dence, and its main role is monitoring. Ap-pointing female directors will cause over-monitoring problems for well-governed firms (Adams and Ferreira 2009; Jurkus et al. 2011). Consequently, large firms, which are the proxy of well-governed firms, do not experience positive impacts on firm performance by ap-pointing female directors.
Secondly, the recommendations (manda-tory requirements) by the UK regulator for appointing more females to the boards could be the plausible reason why the female direc-tors’ contributions in large firms is less sig-nificant than in small firms. Wintoki (2007) reports that there is no evidence the Sarbanes-Oxley Act of 2002 (SOX) improved firm value in the US. Similarly, Ahern and Dittmar (2012) report that quotas for females did not improve firm values in Norway. The recom-mendation of gender diversity on boards in the UK is mainly aimed at the FTSE100 and FTSE250 firms. As a result, large firms tend to hire female directors in order to meet the regulations (quotas) rather that out of neces-sity or for strategic reasons. On the other hand, small firms have the flexibility to de-cide the make-up of their boards of direc-tors in the absence of such regulations.
Conclusion and Implications
Pasaribu
164
Rose 2007; Adams and Ferreira 2009; Ahern and Dittmar 2012) did not find the same re-sult. Moreover, it is reported that the rela-tionship between female directors and firm performance is not straightforward (Adams and Ferreira 2009; Jurkus et al 2011). Given these findings, the study did not only exam-ine the influence of female directors on firm performance, but also tried to employ a cer-tain condition, namely firm size, in the analy-sis.
This study has two important findings to report. Firstly, it is less likely that female directors have a significant influence on firm performance in the UK. Even though the estimations of the effect female directors have on the ROA are positive, they are not statistically significant. Secondly, the positive impact of female directors is stronger in small firms. This may be caused because: (1) large firms, which are associated with strong gov-ernance, encounter over-monitoring problems after appointing female directors (Adams and Ferreira 2009; Jurkus et al. 2011) and (2) large firms encounter greater external intervention
than small firms when it comes to the com-position of their boards of directors.
This study has several implications. For firms, they should consider certain aspects when deciding to appoint female directors, in order to optimize their contribution, e.g. the firms’ current levels of governance. More-over, when firms encounter certain pressures from external parties regarding the appoint-ment of female directors, firms must assess and select the candidates very carefully to get the most benefit from them.
For governments or market regulators, imposing quotas has successfully increased females participation on the boards, particu-larly in the UK. This means governments can push their agendas onto the corporate world. But, such regulations should not be too strict as the policy may not lead to a better bot-tom-line for the firms. Lastly, the study has confirmed that the relationship between fe-male directors and firm performance is prone to the endogeneity problem. Further study into this topic should not rely entirely on the OLS model, as it will result in biased estima-tions.
References
Abbot, L. J., S. Parker, and T. J. Presley. 2012. Female board presence and the likelihood of financial restatement. Accounting Horizons 26 (4): 607-629.
Adams, R. B., and D. Ferreira. 2009. Female in the boardroom and Their impact on governance. Journal of Financial Economics 94 (2): 291-309.
Ahern, K. R., and A. K. Dittmar. 2012. The changing of the boards: The impact on firm valuation of mandated female board representation. The Quarterly Journal of Economics 127 (1): 137-197. Bebchuk, L. A., and J. M. Fried. 2005. Pay without performance: Overview of the issues. Journal of
Applied Corporate Finance 17 (4): 8-23.
Berger, A. N., and G. F. Udell. 1995. Relationship lending and lines of credit in small firm finance. The Journal of Business 68 (3): 351-381.
Brammer, S., A. Millington, and S. Pavelin. 2007. Gender and ethnic diversity among UK corporate boards. Corporate Governance: An International Review 15 (2): 393-403.
Carter, D. A., B. J. Simkins, and W. G. Simpson. 2003. Corporate governance, board diversity, and firm value. The Financial Review 38 (1): 33-53.
Carter, D. A., F. D'Souza, B. J. Simkins, and W. G. Simpson. 2010. The gender and ethnic diversity of US boards and board committees and firm financial performance. Corporate Governance: An Interna-tional Review 18 (5): 396-414.
Chapple, L., and J. E. Humphrey. 2014. Does board gender diversity have a financial impact? Evidence using stock portfolio performance. Journal of Business Ethics 122 (4): 709-723.
Chen, Y., J. D. Eshleman, and J. S. Soileau. 2016. Board gender diversity and internal control weakness. Advances in Accounting 33: 11-19.
Dahya, J., J. J. McConnell, and N. G. Travlos. 2002. The Cadbury Committee, corporate performance, and top management turnover. The Journal of Finance 57 (1): 461-483.
Davies, E. M. 2012. Women on boards. The Davies Report.
Denis, D. J., and A. Sarin. 1999. Ownership and board structures in publicly traded corporations. Journal of Financial Economics 52: 187-223.
Erhardt, N. L., J. D. Werbel, and C. B. Shrader. 2003. Board of director diversity and firm financial performance. Corporate Governance 11 (2): 102-111.
Fama, E. F., and K. R. French. 1993. Common risk Factors in the returns on stocks and bonds. Journal of Financial Economic 33 (1): 3-56.
Farag, H., C. Mallin, and K. Ow-Yong. 2014. Governance, ownership structure, and performance of entrepreneurial IPOs in AIM companies. Corporate Governance: An International Review 22 (2): 100-115.
Galbreath, J. 2011. Are there gender-related influences on corporate sustainability? A study of females on boards of directors. Journal of Management and Organization 17 (1): 17-38.
Green, C. P., and S. Homroy. 2016. Female directors, board committee, and firm performance. Working Paper. Lancaster University, Lancaster, LA1 4YX.
Gregory-Smith, I., B. G. M. Main, and C. A. O'Reilly III. 2013. Appointments, pay and performance in UK Boardrooms by gender. The Economic Journal 124 (574): F109-F128.
Haslam, S. A., M. K. Ryan, C. Kulich, G. Trojanowski, and C. Atkins. 2010. Investing with prejudice: The relationship between female's presence on company boards and objective and subjective measures of company performance. British Journal of Management 21: 484-497.
Hazarika, S., J. M. Karpoff, and R. Nahata. 2012. Internal corporate governance, CEO turnover, and earning management. Journal of Financial Economics 104: 44-69.
Hillman, A. J., A. A. Cannela Jr., and R. L. Paetzold. 2000. The resource dependence role of corporate directors: Strategic adaptation of board composition in response to environment change. Journal of Management Studies 37 (2): 235-255.
Hillman, A. J., C. Shropshire, and A. A. Cannella Jr. 2007. Organizational predictors of female on corpo-rate boards. The Academy of Management Journal 50 (4): 941-952.
Jurkus, A. F., J. C. Park, and L. S. Woodard. 2011. Female in top management and agency cost. Journal of Business Research 64 (2): 180-186.
Kyaw, K., M. Olugbode, and B. Petracci. 2015. Does gender diverse board mean less earnings manage-ment? Finance Research Letter 14: 135-141.
Pasaribu
166
Low, D. C. M., H. Roberts, and R. H. Whiting. 2015. Board gender diversity and firm performance: Empirical evidence from Hong Kong, South Korea, Malaysia, and Singapore. Pacific-Basin Finance Journal 35: 381-401.
Luckerath-Rovers, M. 2013. Female on boards and firms performance. Journal of Management and Gover-nance 17 (2): 491-509.
Moeller, S. B., F. P. Schlingemann, R. M. Stulz. 2004. Firm size and the gains from acquisitions. Journal of Financial Economics 73 (2): 201-228.
Nekhili, M., and H. Gatfaoui. 2013. Are demographic attributes and firm characteristics drivers of gen-der diversity? Investigating women's positions on French Boards of Directors. Journal of Business Ethics 118 (2): 227-249.
Offenberg, David. 2009. Firm size and the effectiveness of the market for corporate control. Journal of Corporate Finance 15 (1): 66-79.
Robinson, G., and K. Dechant. 1997. Building a business case for diversity. The Academy of Management Executive 11 (3): 21-31.
Rose, C. 2007. Does female board representation influence firm ferformance? The Danish evidence. Corpo-rate Governance 15 (2): 404-413.
Ryan, M. K., and S. A. Haslam. 2005. The glass Cliff: Evidence that women are over-represented in precarious leadership positions. British Journal of Management 16 (2): 81-90.
Sealy, R., S. Val, and S. Vinnicombe. 2007. The Female FTSE Report 2007: A Year of Encouraging Process. Cranfield University School of Management: UK.
Setia-Atmaja, Lukas Y. 2008. Does board size really matter? Evidence from Australia. Gadjah Mada Inter-national Journal of Business 10 (3): 331-252.
Simpson, W. G., D. A. Carter, and F. D'Souza. 2010. What do we know about females on boards. Journal of Applied Finance 20 (2): 27-39.
Sing, V., and S. Vinnicombe. 2004. Why so few female directors in Top UK Boardrooms? Evidence and theoretical explanations. Corpporate Governance 12 (4): 479-488.
Singh, Val, Siri Terjesen, and Susan Vinnicombe. 2008. Newly appointed directors in the boardroom: How do women and men Differ? European Management Journal 26 (1): 48-58.
Smith, N., V. Smith, and M. Verner. 2006. Do females in top management affect firm performance? A panel study of 2500 Danish Firms. International Journal Productivity and Performance Management 55 (7): 569-593.
Srinidhi, B., F. A. Gul, and J. Tsui. 2011. Female directors and earnings quality. Contemporary Accounting Research 28 (5): 1610-1644.
Stern, S. 2014. 'Men in skirts' do not enhance diversity. Financial Times: Executive Appointment 3 (April): 3. Strom, R. O., B. D'Espallier, and R. Mersland. 2014. Female leadership, performance, and governance in
microfinance institution. Journal of Banking and Finance 42: 60-75.
Terjesen, S., R. Sealy, and V. Singh. 2009. Women directors on corporate boards: A review and research agenda. Corporate Governance: An International Review 17 (3): 320-337.
Wintoki, M. B. 2007. Corporate boards and regulation: The effect of Sarbanes-Oxley Act and the ex-change listing requirements on firm value. Journal of Corporate Finance 13: (2-3): 229-250.
Wooldridge, J. 2010. Econometric Analysis of Cross Section and Panel Data (2nd ed.). MIT: Cambridge,