Gadjah Mada International Journal of Business
May-August 2010, Vol. 12, No. 2, pp. 257–286
Soegiharto
School of Business YKPN, Yogyakarta, Indonesia
WHAT DRIVES DAMAGE ON
POST-MERGER OPERATING
PERFORMANCE?
Keywords: capital liquidity; CEO overconfidence; merger waves, method of pay-ment operating performance
258
Gadjah Mada International Journal of Business, May-August 2010, Vol. 12, No. 2
Introduction
The results of the tests on post-merger operating performance indi-cate that performance following merg-ers undertaken during the wave period is worse than that during other periods Soegiharto (2008). On the other hand, Harford’s (2005) study does not find evidence that performance following the wave period mergers is worse than that during other periods. Instead, post-merger changes in sales growth are significantly greater inside the waves. While the findings by earlier studies are consistent with the behavioral explana-tion of merger waves, the results of latter studies are in line with the neo-classical explanation of merger waves. This suggests that both the neoclassi-cal and the behavioral explanation of merger waves have some supports.
The aim of this study is to examine whether there is a difference in post-merger operating performance between mergers occurring during merger waves and those outside the waves, between mergers undertaken by over-confident and those by less overconfi-dent CEOs, between stock and cash mergers, between within and cross-industrial mergers, and between merg-ers conducted in a high and those in a low liquidity year. Moreover, this study also investigates whether five vari-ables—CEO overconfidence, merger period, payment method, the industry of merged firms, and capital liquidity— and premium paid to the target firm predict post-merger operating perfor-mance.
This study re-examines the rela-tionship between post-merger operat-ing performance and payment method used to finance the merger, and also between post-merger operating per-formance and the industry of merged firms since empirical evidence on these relationships are mixed and research-ers of the previous studies did not take into account merger waves and CEO overconfidence in their analyses (see e.g., Ghosh 2001; Healy et al. 1992; Heron and Lie 2002; Linn and Switzer 2001). The findings of this study indi-cate that merger period and the indus-try of merged firms positively and sig-nificantly affect the post-merger oper-ating performance. Additionally, the premium paid to target firms is nega-tively and significantly associated with post-merger operating performance. It is also found that the pre-merger per-formance has a positive and significant effect on the post-merger performance. Eventually, CEO overconfidence, the variable of principal interest in this study, does not exert any effect on the post-merger operating performance.
The outline of this paper is as follows: Literature review and empiri-cal predictions are presented in Sec-tions 2 and 3, respectively. Section 4 describes data and methods employed, and Section 5 presents and discusses the results of this paper. Section 6 concludes the paper.
Literature Review
firm’s entire board of directors, it is widely recognized that the CEO ini-tiates the M&A and oversees its progress. In other words, the CEO plays a central role in the M&A deci-sion-making process (see e.g., Roll 1986; Shleifer and Vishny 1988). Dur-ing the decision-makDur-ing process, the CEO may be influenced by the time when the merger is undertaken (in-wave or non-(in-wave), his or her own behavior (overconfident or not), the industry of the target firm (intra- or inter-industry), and the method of pay-ment (stock or cash) to be used to complete the M&A. These factors, which potentially affect the bidder’s post-merger operating performance, are examined in this study. This section provides the review of relevant litera-ture on these factors and the variable that they might influence, which is the post-merger operating performance.
Post-Merger Operating
Performance
A number of studies have investi-gated the changes in the long-term operating performance of acquiring and target firms using post-merger account-ing and cash flow data. The results of those empirical studies are in general inconsistent. While some research in-dicates a significant improvement in the post-merger operating performance (e.g., Healy et al. 1992; Heron and Lie 2002; Switzer 1996), others document a significant decline in the operating performance following mergers (e.g., Clark and Ofek 1994; Kruse et al.
2002). In addition, some other studies reveal insignificant changes in the post-merger operating performance (e.g., Ghosh 2001; Herman and Lowenstein 1988).
A study by Healy et al. (1992), which examined the operating perfor-mance of the 50 largest mergers be-tween 1979 and 1983 and compared the post-merger performance to the pre-merger performance of the merg-ing firms, indicates that the merged firms’ operating cash flows perfor-mance in five years after the mergers improve significantly relative to their industry averages, substantiating the conjecture that mergers are capable of improving operating performance. Employing the methodology of Healey et al. (1992), Switzer (1996) examined the changes in operating performance of firms involved in 324 acquisitions between 1967 and 1987. He verifies several Healy et al.’s (1992) findings and concludes, in particular, that the results of Healy et al. (1992) are robust to both sample size and the period of examination. Moreover, the results of Switzer’s (1996) study indicate that the performance of the merged firms typi-cally improves following their combi-nation, which is consistent with that presented by Healy et al. (1992).
260
Gadjah Mada International Journal of Business, May-August 2010, Vol. 12, No. 2
operating margin of combined firms and the median operating margin of corresponding industry. Their results suggest that the operating performance of the combined target and acquirer is strong relative to their industry peers preceding the merger, and slightly im-proves in the wake of the merger transaction. Also similar to Healy et al. (1992), Heron and Lie (2002) find that acquiring firms demonstrate greater operating performance relative to their industry counterparts prior to mergers and, consistent with Healy et al. (1992) and Switzer (1996), these firms con-tinue to exhibit an operating perfor-mance level in excess of their respec-tive industries following the mergers. Moreover, those firms significantly outperform control firms with compa-rable pre-event operating performance. Clark and Ofek (1994) also ana-lyze post-merger operating perfor-mance. However, their study was de-signed to specifically examine the ef-fectiveness of mergers in restructuring distressed firms, and investigate some determinants of the success of those mergers (using EBITD deflated by sales revenues instead of market value of equity, as in Healy et al. (1992)). They collected a sample of takeovers undertaken to restructure distressed targets for the period between 1981 and 1988. They find that, unlike the mergers of healthy firms studied by Healy et al. (1992), the performance of bidders that acquire distressed targets tend to decline in the post-merger pe-riod.
Merger Waves and Post-Merger
Operating Performance
Two general classes of explana-tions of merger waves are: (1) neoclas-sical model, where industries respond-ing to shocks reorganize through M&As and thereby generate a clustering of merger activity (Harford 2005; Mitchell and Mulherin 1996); and (2) behavioral model, where rational CEOs take ad-vantage of consistent pricing errors in the market to buy real assets with their overvalued stocks (Rhodes-Kropf and Viswanathan 2004; Shleifer and Vishny 2003). Under the first explanation, if the wave is an efficient response to economic shocks, it should be related to more rational behavior. Hence, it is expected that the improvement in post-merger operating performance for in-wave mergers is equal to or greater than that for non-wave mergers. This is more likely to occur as the bidder and the target merge for synergy (there is an economic rationale behind the merger).
perfor-mance in the market-misvaluation1
mergers can also be explained by the fact that these mergers are not under-lain by economic factors that could drive the merged firms to perform better.
None of the behavioral papers explicitly formulates predictions con-cerning operating performance. How-ever, as explained above, one can de-rive a prediction that the costs of inte-grating two firms with no real com-bined synergy (and hence no opera-tional motive to merge) would produce generally poor post-merger operating performance for in-wave mergers. Harford’s (2005) tests of operating performance shows no evidence that the changes in actual performance fol-lowing in-wave mergers are worse than those during other periods. Rather, he argues that the post-merger change in one of his measures of post-merger performance (sales growth) remains significantly greater inside the waves.
CEO Overconfidence and
Post-Merger Operating Performance
CEOs are particularly likely to display overconfidence for three rea-sons. First, individuals are more over-confident about outcomes that they believe are under their control (Weinstein, 1980). Second, individuals are especially overconfident about out-comes to which they are highly com-mitted (Weinstein, 1980). Third, over-confidence is likely to be strongest
when the reference point is abstract (Alicke et al., 1995). Linking overcon-fidence to corporate finance, Roll (1986) advances the idea that in corpo-rate takeovers, the overconfidence managers engage in M&As with an overly optimistic opinion of their abili-ties to create value. Similarly, Heaton (2002) shows that common distortions in corporate investments may be the result of managers overestimating the returns on their investments. These, in turn, often lead to bidding firms paying higher premiums for their targets. Roll also argues that the mistake of paying too much stems from management who overrate the synergistic gains from an M&A. Such overpayment is a prin-cipal mechanism by which hubris ulti-mately damages the operating perfor-mance following the M&A.
Method of Payment and
Post-Merger Operating Performance
Empirical evidence suggests that the means of payment is an important determinant of the long-term post-ac-quisition performance: cash offers are associated with a stronger improve-ment than takeovers involving other forms of payment (Ghosh 2001; Linn and Switzer 2001; Moeller and Schlingemann 2004). A study by Healy et al. (1992), which examined the oper-ating performance of the 50 largest merger transactions, reports that oper-ating performance improves following the transactions. However, they do not
1 Market-misvaluation merger is defined as a merger that results from managerial timing of market
262
Gadjah Mada International Journal of Business, May-August 2010, Vol. 12, No. 2
find any relationship between post-merger operating performance and the method of payment utilized to finance the mergers. Heron and Lie (2002) also examined the relation between the method of payment in mergers and operating performance. Similar to Healy et al. (1992), they also find that the trends in industry-adjusted operating performance (before and after merg-ers) do not differ across cash mergers, stock mergers, and mixed (cash and stock) mergers. They subsequently suggest that the method of payment does not appear to convey information with respect to future operating perfor-mance. Likewise, Powell and Stark (2005) and Sharma and Ho (2002) find no significant relationship between the method of payment and post-merger operating performance.
As in Healy et al. (1992) and Heron and Lie (2002), Ghosh (2001) investigated the impact of the method of payment on the acquiring firms’ post-merger operating cash flows. He included 50 largest acquisitions each year from 1981 to 1988, and adopted the methodology harnessed by Healy et al. (1992). Unlike Healy et al. (1992) and Heron and Lie (2002), Ghosh (2001) provides evidence that the combined firms’ cash flows strengthen signifi-cantly following cash mergers but de-teriorate subsequent to stock mergers. He argues that the improvement in cash mergers results from the increase in assets turnover (sales per dollar of assets) and the decline in stock merg-ers is due to a significant drop in the assets turnover.
Industry of Merged Firms and
Post-Merger Operating
Performance
The establishment of diversified firms is related to divisional managers who have rent-seeking behavior (Scharfstein and Stein 2000), bureau-cratic rigidity (Shin and Stulz 1998), and a bargaining problem within the firm (Rajan et al. 2000). As these drawbacks may outpace the alleged synergies, the bidder CEOs may fail to enhance post-merger operating per-formance. Moreover, as suggested by Shleifer and Vishny (1989), diversify-ing mergers may be a consequence of the agency problems between manag-ers and shareholdmanag-ers. This, in turn, may also produce the decline in corporate performance following the mergers. Several studies have been undertaken to examine these assumptions. While research conducted by Healy et al. (1992) and Heron and Lie (2002) con-firms these assumptions, other studies done by Powell and Stark (2005), Linn and Switzer (2001), Switzer (1996) and Sharma and Ho (2002) find an insignifi-cant relationship between diversifying mergers and poor post-merger operat-ing performance. In addition, the study by Kruse et al. (2002) and Ghosh (2001) find evidence that the inter-industry mergers significantly outper-form the intra-industry mergers.
Bid Premium and Post-Merger
Operating Performance
from target firms by bidder CEOs are reflected in the premiums paid to the targets. Premium also emphasizes a bidder CEO’s belief that the target’s present performance is poor and that its stock price poorly reflects the value of the firm’s resources and prospect. In addition, premium is important not only due to its function as the statement of pricing and the bidder’s expectation, but also because of its effect on the ultimate merger performance (Hay-ward and Hambrick 1997).
Roll (1986) argues that the mis-take of paying too much which stems from management overrating the value created and synergistic gains from an M&A ultimately damages the operat-ing performance followoperat-ing the M&A. Contrary to this argument, McCauley (1997) examined whether the size of an acquisition premium is an important determinant of the ultimate success of the M&A, and finds no correlation between the percentage of premium paid and the “success” of the M&A based on an industry benchmark stan-dard. Nevertheless, ceteris paribus, it is axiomatic that the higher the pre-mium paid, the lower the ultimate oper-ating performance to the acquirer in a given acquisition.
Empirical Predictions
This study examines the effects of the period of merger, CEO behavior, the method of payment, the industry of merged firms, and premiums paid to target firms on post-merger operating
performance. For the interest of com-pleteness, the impacts of liquidity pe-riod, CEO tenure, CEO stock owner-ship, pre-merger operating perfor-mance, free cash flows, and leverage are also tested.
Roll (1986) argues that bidder CEOs are infected by hubris (overcon-fidence). Their overconfidence may cause them to overestimate the values of target firms, overestimate their abili-ties to manage the targets and reap the gains/returns from the mergers, and thereby not to act in the best interests of shareholders. CEO hubris leads them to pay higher premiums, and accord-ingly those mergers are more likely to be negative NPV projects for the bid-ders. Hence, it is argued that CEO overconfidence and the payment of higher premium lead to poor post-merger operating performance.
264
Gadjah Mada International Journal of Business, May-August 2010, Vol. 12, No. 2
would result in poor post-merger oper-ating performance.
Bidder CEOs may pay higher pre-miums for mergers that involve bidders and targets from different industries. This may occur since the bidder CEOs might only have little experience, lim-ited capabilities, and insufficient knowl-edge of the targets’ businesses, and, in turn, they may overvalue the targets. Bidders tend to use stocks to finance mergers when they believe their stocks are overvalued. As their stocks are overvalued, they are more readily avail-able to pay higher premiums to the target firms. In addition, the bid premi-ums paid to the targets may be higher when capital liquidity is high. As the transaction costs are low (when the capital liquidity is high), the bidder CEOs may be more willing to pay more pre-miums to complete the mergers. Hence, it is more likely that inter-industry merg-ers, stock mergmerg-ers, and mergers un-dertaken during the period of high li-quidity would result in poor post-merger operating performance.
A CEO with long tenure logically has proven his or her skills in both good and bad times, and the board of direc-tors should have already obtained al-most all required information on him or her. As his or her tenure gets longer, he or she might have more control over the firm and has a stronger influence on the board. With this power in hand, CEOs tend to act not for the best interests of shareholders, and may de-stroy the values of mergers they under-take by paying higher premiums to the target firms in order to complete the
mergers which may be part of their organizational strategy. On the other hand, since a merger typically results in a decrease in the acquirer’s stock price, it follows that a CEO with more equity or whose pay is more heavily weighted towards equity-based incentives might be less likely to undertake an M&A or overpay the target firm. Therefore, CEOs with high stock ownership may have interests which are aligned with those of shareholders. For this reason, they may pay “fair” premiums in the mergers they execute. Hence, it is more likely that CEOs with longer tenure would produce poorer post-merger operating performance, and CEOs with higher stock ownership would generate better post-merger operating performance.
CEOs with better pre-merger per-formance may believe that their mana-gerial abilities to run their firms suc-cessfully can be applied to firms they are acquiring. As they believe that the acquired firms’ prospects will be better in their hands or they could bring more benefits to those firms, they would be very willing to incur high premiums. It is also convinced that CEOs with a high level of free cash flows and a low level of leverage will pay higher premiums. Mergers that involve these CEOs may also result in poor post-merger operat-ing performance.
Predicated on the arguments dis-cussed above, it is predicted that: 1. The post-merger operating
mergers undertaken during the in-wave period is poorer than that made during other (non-wave) pe-riods, (c) of inter-industry mergers is poorer than that of intra-industry mergers, (d) of stock mergers is poorer than that of cash mergers, and (e) of mergers undertaken fol-lowing a high liquidity year is poorer than that following a low liquidity year.
2. CEO overconfidence, in-wave mergers, stock overvaluation, higher bid premiums, higher capital liquid-ity, inter-industry mergers, better pre-merger performance, higher pre-merger free cash flows, lower pre-merger leverage, longer CEO tenure, and lower CEO stock own-ership lead to the bidders’ poor post-merger operating perfor-mance.
The two predictions formulated above are summarized in Table 1, and the empirical findings, discussed in Section 1.4, are also previewed in the table.
Data and Methods
Data
Data employed in this study are identical to those used in the study of Soegiharto (2010). They are collected
266
Gad
jah
Ma
da I
nte
rna
tion
al Jo
urna
l of B
usin
ess
,
May
-Au
gu
st 201
0, Vo
l. 12,
No. 2
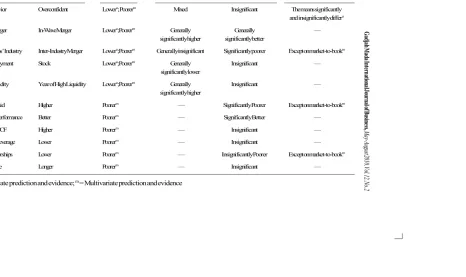
Table 1. Predictions and Findings for the Drivers of Poor Post-Merger Operating Performance
The Means of and the Predictors Effect onPost-Merger Operating Performance
Univariate Multivariate
Predictors Predictions Findings Remark
CEOs’ Behavior Overconfident Loweru; Poorerm Mixed Insignificant The means significantly
and insignificantly differu
Period of Merger In-Wave Merger Loweru;Poorerm Generally Generally —
significantly higher significantly better
Merged Firms’ Industry Inter-Industry Merger Loweru;Poorerm Generally insignificant Significantly poorer Except on market-to-bookm
Method of Payment Stock Loweru;Poorerm Generally Insignificant —
significantly lower
Capital Liquidity Year of High Liquidity Loweru;Poorerm Generally Insignificant —
significantly higher
Premiums Paid Higher Poorerm — Significantly Poorer Except on market-to-bookm
Pre-Merger Performance Better Poorerm — Significantly Better —
Pre-Merger FCF Higher Poorerm — Insignificant —
Pre-Merger Leverage Lower Poorerm — Insignificant —
CEOs’ Ownerships Lower Poorerm — Insignificantly Poorer Except on market-to-bookm
CEOs’ Tenure Longer Poorerm — Insignificant —
Measures of Overconfidence
This study uses measures of CEO overconfidence designed by Soegiharto (2010) who formulates the measures based on several variables extracted from the Execucomp database. Since information on options held by the CEO until the year of expiration is available only for a small number of CEOs, it is not possible for Soegiharto (2010) and also this present study to apply Malmendier and Tate’s (2003) method, which collects the sample of CEOs from Hall and Liebman’s data (1989) and classifies a CEO as overconfident when he or she holds stock options until the last year before expiration. Soegiharto (2010) proposes several measures of CEO overconfidence gauged prior to the year of merger announcement. He argues that as his measures of CEO overconfidence are assessed prior to merger announce-ment, they may better reflect the CEO overconfidence in undertaking M&As. The measures of CEO overconfidence employed by Soegiharto (2010) and applied in this study are listed below (the Execucomp’s accessed items pre-sented in italic)2:
1. Measure A. The proportion of stock
options exercised: soptexsh/
(soptexsh+uexnumex). Soptexsh is the number of stock options exer-cised by CEOs and uexnumex is the number of unexercised vested stock options. CEOs are classified as overconfident if the percentage of options they exercise is smaller than both the annual average per-centage and industry-year average percentage.
2. Measure B. The number of shares owned (shrown). CEOs are classi-fied as overconfident if the number of shares they own shows an in-crease at the end of the year, irre-spective of whether or not they exercise their options.
3. Measure C. CEO behavior is mea-sured using the net average value realized from exercising options (soptexer/soptexsh) and the aver-age value the CEOs would have realized at year end if they had exercised all of their vested options that had an exercise price below the
market price (inmonex/
uex-numex). CEOs are classified as
overconfident if inmonex/
uex-2 Initially, Soegiharto’s study (2010) proposes five measures of CEO behavior. The association
268
Gadjah Mada International Journal of Business, May-August 2010, Vol. 12, No. 2
numex is greater than soptexer/ soptexsh.
CEO overconfidence is a dummy variable that takes the value of one for an overconfident CEO and zero for a less overconfident CEO.
Identification of Merger Waves
Soegiharto (2008) and Soegiharto (2010) followed Harford’s (2005) simu-lation procedure to identify M&A waves. The procedure is implemented as follows: each bidder and target is sorted into one of 48 industry groups, based on their respective SIC codes (as per Fama and French 1997) at the time of the bid announcement. Bidders and targets from various sectors are assigned to their own industries. For each industry, the highest concentra-tion of completed and uncompleted merger bids involving firms in that in-dustry within a 24-month period (over-lap)—as per Mitchell and Mulherin (1996)—is identified and tagged as a potential wave. To confirm a potential wave as an actual wave, the following simulation procedure is followed to construct the distribution of merger concentrations that facilitates the test-ing of the economic significance of each merger wave concentration. The total number of merger bids for a given industry over the 120-month sample period (i.e., 10 years x 12 months) is identified. Each bid is then randomly assigned to one of the 120 months with the probability of assignment being 1/ 120 for each month. This is repeated 1,000 times. Subsequently, the highest concentration of merger activity within
a 24-month period from each of the 1,000 draws is calculated. The actual concentration of activity from the po-tential wave is compared with the em-pirical distribution based on the simu-lated data. If the actual peak concen-tration exceeds the 95th percentile from that empirical distribution, that period is coded as a wave. The final result of the merger simulation in the study of Soegiharto (2008) is 28 waves. He indicates that the average number of bids during the 24-month wave period over the 10-year sampling period is 53 whereas the average number of bids during the 24-month non-wave period is 14.3. This present study employs the identical waves identified in the study of Soegiharto (2008). Merger period is a dummy variable that takes the value of one for mergers that occur during the waves and zero for those that occur outside the waves.
Measure of Bid Premium
days prior to the first bid announce-ment.
Measures of Operating
Performance
Similar to Harford (2005), this study employs a set of measures of operating performance, which consist of net income [A172] to sales [A12], assets turnover (sales [A12]/average of total assets [A6]), return on assets (operating income [A13]/average of total assets [A6]), sales [A12] growth, and market [A24xA25] to book [A60]. The pre-merger operating performance is the average of years -3 to -1 relative to the announcement industry-adjusted performance while the post-merger industry-adjusted operating perfor-mance is the average of years +1 to +3 relative to merger completion. This study does not employ market-based measures of performance because, as explained by Healy et al. (1992), it is difficult to distinguish whether the eq-uity gains are due to real economic gains or market inefficiency. In addi-tion, to unravel this dilemma, they sug-gest examining merger-related operat-ing performance usoperat-ing accountoperat-ing- accounting-based measures instead of market-based measures.
Results
Univariate Tests
To test Prediction 1, this study compares the means of post-merger operating performance of five of the
following dummy variables (1 and 0 indicate the value taken): (i) bidders with overconfident (1) and less over-confident (0) CEOs, (ii) in-wave (1) and non-wave (0) mergers, (iii) intra-(1) and inter- (0) industry mergers, (iv) stock (1) and cash (0) mergers, and (v) mergers undertaken following a high liquidity year (1) and a low liquidity year (0). The redundant (highly corre-lated) measures of operating perfor-mance are removed using the principal component analysis. Post-merger op-erating performance is assessed using the return on assets, net income to sales, and/or market-to-book ratio. A high liquidity year is the year in which the rate spread is below its time-series median and the industry’s market-to-book ratio is simultaneously above its time-series median. The low liquidity years are all other years.
270
Gadjah Mada International Journal of Business, May-August 2010, Vol. 12, No. 2
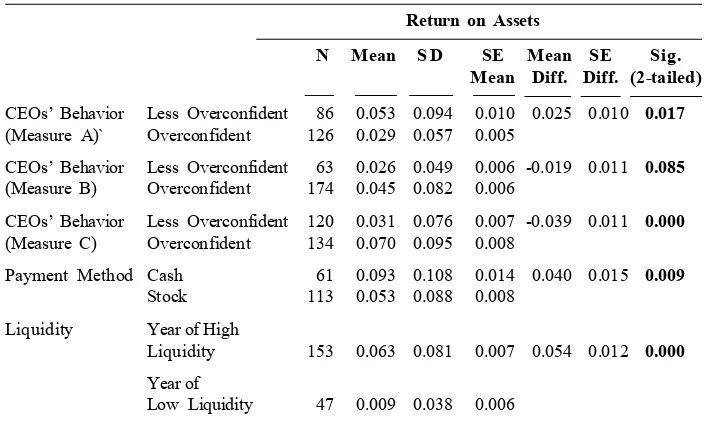
Table 2. The Difference in the Means of Post-Merger Operating Perfor-mance
The means are for the following classifications of merger: mergers undertaken by overconfident and less overconfident CEOs, mergers conducted during merger waves and outside the waves, mergers that involve bidders and targets from the same and different industries, mergers that use stock and cash as method of payment, and mergers conducted following the year of high and low liquidity. Measure A, Measure B, and Measure C are used as measures of CEOs’ behavior. The differences in numbers of observation are due to the missing data and only significant results are presented.
(Panel A) The difference in the means of post-merger return on assets (ROA)
Return on Assets
N Mean S D SE Mean SE Sig.
Mean Diff. Diff. (2-tailed)
CEOs’ Behavior Less Overconfident 86 0.053 0.094 0.010 0.025 0.010 0.017
(Measure A)` Overconfident 126 0.029 0.057 0.005
CEOs’ Behavior Less Overconfident 63 0.026 0.049 0.006 -0.019 0.011 0.085
(Measure B) Overconfident 174 0.045 0.082 0.006
CEOs’ Behavior Less Overconfident 120 0.031 0.076 0.007 -0.039 0.011 0.000
(Measure C) Overconfident 134 0.070 0.095 0.008
Payment Method Cash 61 0.093 0.108 0.014 0.040 0.015 0.009
Stock 113 0.053 0.088 0.008 Liquidity Year of High
Liquidity 153 0.063 0.081 0.007 0.054 0.012 0.000
Year of
Low Liquidity 47 0.009 0.038 0.006
(Panel B) The difference in the means of post-merger net income to sales (NIS)
Return on Assets
N Mean S D SE Mean SE Sig.
Mean Diff. Diff. (2-tailed)
CEOs’ Behavior Less Overconfident 80 0.071 0.091 0.010 0.031 0.011 0.006
(Measure A) Overconfident 135 0.040 0.073 0.006
CEOs’ Behavior Less Overconfident 109 0.038 0.059 0.006 -0.022 0.010 0.031
(Measure C) Overconfident 129 0.060 0.089 0.008
Merger Period Non-Wave Mergers 172 0.042 0.062 0.005 -0.026 0.011 0.026
The differences in the means of the three measures of post-merger operat-ing performance employed are signifi-cantly higher for overconfident CEOs than for less overconfident CEOs, which correspond with the results of Mea-sure B in Panel A. However, these results are in conflict with those in Panel A (return on assets) and Panel B (net income to sales) when Measure A is used. These conflicting results, which generally do not support Prediction 1a, are prevalent since the measures of CEO overconfidence employed in this study may capture the CEO overcon-fidence in different ways.
Up to this point, in general, the results of the tests indicate that the less overconfident CEOs are more likely to generate poorer post-merger
operat-dent CEOs. This finding is in line with that of Soegiharto (2010) that the less overconfident CEOs pay higher premi-ums than do the overconfident CEOs. Perhaps, the less overconfident CEOs who pay higher premiums overesti-mate the value they can create from the mergers, and do not use their re-sources optimally following the merg-ers. As a result, they generate poor post-merger operating performance.
The other results in Table 2 dem-onstrate that the means of post-merger net income to sales (see Panel B) and the means of post-merger market-to-book (see Panel C) for in-wave and non-wave mergers are significantly different. The means of these two measures of performance are higher for in-wave mergers than for
non-Continued from Table 2
(Panel C) The difference in the means of post-merger market-to-book (M/B)
Return on Assets
N Mean S D SE Mean SE Sig.
Mean Diff. Diff. (2-tailed)
CEOs’ Behavior Less Overconfident 104 0.428 0.745 0.073 -0.940 0.164 0.000
(Measure C) Overconfident 134 1.368 1.543 0.133
Merger Period Non-Wave Mergers 160 0.784 0.935 0.074 -0.565 0.181 0.002
Wave Mergers 78 1.349 1.853 0.210
Industry of Inter-Industry 106 1.612 1.868 0.181 0.992 0.180 0.000
Merged Firms Intra-Industry 140 0.621 0.886 0.075
Payment Method Cash 56 1.616 1.614 0.216 0.725 0.211 0.001
Stock 102 0.890 1.032 0.102 Liquidity Year of
High Liquidity 133 0.946 0.941 0.082 0.698 0.140 0.000
Year of
272
Gadjah Mada International Journal of Business, May-August 2010, Vol. 12, No. 2
do not confirm Prediction 1b, may oc-cur as there are many targets available during merger waves, and bidders could choose targets that are most favorable to them and, ultimately, they could produce better post-merger operating performance.
For mergers that involve bidders and targets from the same or different industries, a significant difference only appears in the means of post-merger market-to-book (see Panel C). The means of this measure is higher for inter-industry mergers than for intra-industry mergers. This evidence, which does not support Prediction 1c, sug-gests that bidders that acquire targets from different industries may have an opportunity to take advantage from conglomeration, for instance, by bring-ing down the level of their exposure to risks.
The means of post-merger return on assets (see Panel A) and post-merger market-to-book (see Panel C) are significantly different for mergers financed with stock and those with cash, and for mergers undertaken fol-lowing a year of high liquidity and those following a year of low liquidity. The means of these two measures of per-formance are higher for cash mergers than for stock mergers (supporting Prediction 1d) but are also higher for mergers undertaken following the year of high liquidity than those conducted following the year of low liquidity (Pre-diction 1e is not substantiated). The finding that stock mergers produce poorer post-merger operating
perfor-mance relative to cash mergers is con-sistent with the argument that bidder CEOs are more likely to pursue their personal interests at the expense of shareholders. Meanwhile, the finding that mergers undertaken following the high liquidity years generate better post-merger operating performance may be due to the bidder CEOs’ better access to the sources of funds to accommo-date the reallocation of assets effi-ciently.
Multivariate Tests
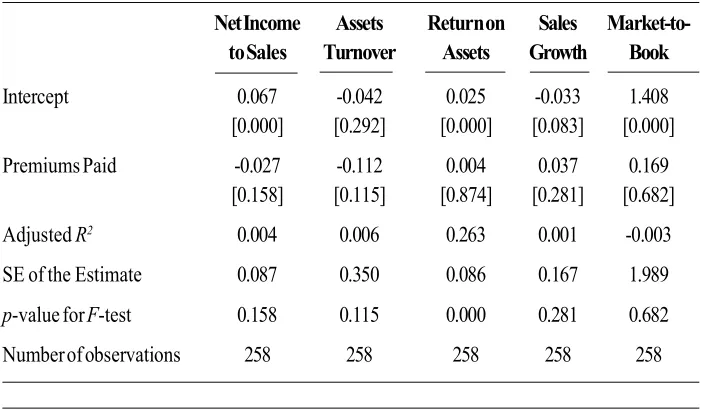
It is generally acknowledged that the extra value that can be extracted from the target firms by the bidder CEOs are reflected on the premiums paid to the targets. Hayward and Hambrick (1997) argue that premium is important not only on account of its function as the statement of pricing and the bidder’s expectation, but also due to its effect on post-merger operating performance. Similarly, Roll (1986) reveals that the mistake of paying too much, stemming from management who overrate the value created and synergistic gains from an M&A, ulti-mately damages the operating perfor-mance following the M&A. This argu-ment implies that the bidders’ poor post-merger performance may be driven by the high premiums they have paid to the target firms. Prior to the test of Prediction 2, this study examines this relation using the regression analysis
and employs the following measures of post-merger performance: net income to sales, assets turnover, return on assets, sales growth, and market-to-book ratio. The results of the regres-sion analysis, as presented in Table 3, indicate that the amount of premiums paid do not exert any effect on the bidders’ post-merger operating perfor-mance.
It is hypothesized that the relation-ship between the amount of premiums paid and the post-merger operating performance may be affected by CEO behavior, merger period, the method of payment, and the industry of merged firms. However, as there is not any relationship between the premiums paid and post-merger operating perfor-mance, it is not possible to test the indirect effect of the four influencing factors mentioned on the relationship between the two variables. This paper,
Table 3.Predicting Post-Merger Operating Performance Using Premiums
Paid to Targets
Net Income Assets Return on Sales Market-to-to Sales Turnover Assets Growth Book
Intercept 0.067 -0.042 0.025 -0.033 1.408
[0.000] [0.292] [0.000] [0.083] [0.000]
Premiums Paid -0.027 -0.112 0.004 0.037 0.169
[0.158] [0.115] [0.874] [0.281] [0.682]
Adjusted R2 0.004 0.006 0.263 0.001 -0.003
SE of the Estimate 0.087 0.350 0.086 0.167 1.989
p-value for F-test 0.158 0.115 0.000 0.281 0.682
274
Gadjah Mada International Journal of Business, May-August 2010, Vol. 12, No. 2
therefore, investigates the direct effect of the explanatory variables employed on the post-merger operating mance. As the post-merger perfor-mance is measured using several vari-ables, the redundant (highly correlated) variables are removed using the princi-pal component analysis. This analysis indicates that post-merger performance is best assessed by return on assets (which has the highest score in the component matrix), net income to sales, and/or market-to-book ratio.
Although the results in Table 3 do not show any effect of premiums paid on post-merger operating performance, it remains sensible to test the influence of variables on the premiums paid to the targets firms. These variables, col-lectively, may also affect the bidders’ post-merger operating performance.
The Effects of the Combination of Measures of CEO Behavior and Classified Predictors on Post-Merger Performance
Firstly, in the multivariate tests, this study individually regresses thir-teen predictors (see Appendix 1) on return on assets (Panel A), net income to sales (Panel B), and market-to-book (Panel C). Secondly, each of the mea-sures of CEO overconfidence (three of the predictors used) is added to the other individual predictors employed to construct new regression models. The results of these two tests are discussed along with the results of the third test (this section). Tables for the results of the first two tests are not presented, but are available upon request.
hand, in Model C (Panel A, Appendix 1), the overconfident CEOs are more likely to generate better post-merger return on assets. Nevertheless, only Model A2, Model C3, and Model C4 (Panel A of Appendix 1) show signifi-cant effects on the dependent variable examined.
In Panel B of Appendix 1, the effects of the period of merger and CEO ownership on post-merger net income to sales are not significant, which are unlike the effects obtained from the first and the second tests. The results of the effect of CEO overcon-fidence on post-merger net income to sales in Model A (Panel B, Appendix 1) indicate that the overconfident CEOs are more likely to produce poorer post-merger net income to sales. In con-trast, in Model C (Panel B, Appendix 1), the overconfident CEOs are more likely to produce better post-merger net income to sales. The significant models include Models A2 to A4, and Model C4 (see Panel B, Appendix 1). These results are similar to those emerge in the first and the second tests.
In Panel C of Appendix 1, the effect of pre-merger free cash flows on post-merger market-to-book ratio in all models (Model 1, Model A1, Model B1, and Model C1) is significant. These results are parallel with those from the second test. However, the coefficient on this predictor is close to zero, mean-ing that the impact is economically unimportant. Capital liquidity also re-mains a significant predictor in all mod-els (Model 2, Model A2, Model B2, and
Model C2), which is also consistent with the results of the second test. Similarly, the result for the industry of merged firms in Model C3, Panel C, Appendix 1 is also in line with that in the second test, i.e., it significantly and negatively affects the dependent vari-able.
For CEO overconfidence, the re-sults presented in Model A1, Panel C, Appendix 1 indicate that the overcon-fident CEOs generate poorer post-merger market-to-book. In contrast, the results presented in Model C3 and Model C4 in the same panel and table demonstrate that the overconfident CEOs produce better post-merger market-to-book. They are consistent with the findings in the first and the second tests. This may occur as over-confident CEOs pay less amount of premiums to the target firms (see Soegiharto 2010), and perhaps because they are convinced that they estimate the values of the targets correctly. The results of CEO stock ownership indi-cate that the effect of this variable on post-merger market-to-book, in Model 1 and Model A1, is significantly nega-tive. In addition, the results of CEO tenure, in all models, indicate a positive and significant impact of this variable on post-merger market-to-book. In the second test, these last two predictors, however, show no significant effect on the dependent variable.
276
Gadjah Mada International Journal of Business, May-August 2010, Vol. 12, No. 2
hand, when Measure C is employed, the results in general exhibit that CEO overconfidence significantly and posi-tively affects each of the three post-merger performance measures. On the other hand, when Measure A is used, the results also demonstrate a significant but negative effect of CEO overconfidence on each of the depen-dent variables employed. Additionally, when Measure B is used, none of CEO overconfidence significantly affects the measures of post-merger performance. These findings suggest that each of the measures of CEO behavior may cap-ture CEO overconfidence differently. It is argued that Measure A— classifying a CEO as overconfident if the percentage of options he or she exercises is smaller than both the an-nual average percentage and industry-year average percentage—better gauges the CEO overconfidence as holding options until certain date, indi-cating the CEO conviction that his or her company will perform better and its stock price will increase further. In addition, the comparison with the an-nual average percentage and the in-dustry-year average percentage en-hances the validation of this measure. Measure B only focuses on the in-crease in the number of shares the CEO owns (irrespective of whether he or she exercises the options). Ignoring the exercising/unexercising of stock options may weaken this measure. On the other hand, Measure C disregards the increase in the number of shares owned by the CEO, and the CEO is classified as overconfident if the
aver-age value that the CEO would have realized at year end—if he or she had exercised all of the vested options that had an exercise price below the market price—is greater than the net average value realized from exercising the op-tions. This measure is valid to gauge individual CEO overconfidence, but it is not as robust as Measure A since it does not take into account the annual average difference and the industry-year average difference. Hence, it is concluded that the findings that indi-cate a negative and significant effect of CEO overconfidence on post-merger operating performance support the pre-diction developed.
The Effects of the Combination of Measures of CEO Behavior and Groups of Classified Predictors on Post-Merger Performance
the industry of merged firms becomes a variable that positively and signifi-cantly affects post-merger return on assets and post-merger net income to sales (see Panel A and Panel B). This suggests that intra-industry mergers lead to better post-merger perfor-mance, substantiating the conjecture made and consistent with the finding of Heron and Lie (2002) that operating performance improvement is signifi-cantly greater when the bidder and the target firm belong to the same industry. The premiums paid to the target firms, included in the full model, also becomes a factor that negatively and significantly explains return on assets and net income to sales (see Panel A and Panel B). These findings mean that the higher the premiums paid, the lower the post-merger performance, supporting the prediction made. The results are also in line with Roll’s (1986) study which finds that the payment of higher premiums to the target firms damages the performance following the mergers. In addition, pre-merger free cash flows, in general, also be-come a factor that positively and sig-nificantly affects the post-merger re-turn on assets and the post-merger market-to-book (see Panel A and Panel C). However, the coefficient on this predictor is close to zero, suggesting that the effect of this predictor is eco-nomically unimportant.
The period of merger is also a variable that generally has a positive and significant impact on the three
dependent variables employed (see the full model). This suggests that in-wave mergers lead to better post-merger performance, which does not support the hypothesis. It can also be seen in Appendix 2 that pre-merger return on assets, pre-merger net income to sales, and pre-merger market-to-book have positive and significant effects on post-merger return on assets, post-post-merger net income to sales, and post-merger market-to-book, respectively (see the full model). This proves that the higher the bidders’ pre-merger performance, the better their post-merger perfor-mance will be. Finally, as shown in all panels of Appendix 2, CEO behavior, in general, has no effect on post-merger performance.
Conclusion
278
Gadjah Mada International Journal of Business, May-August 2010, Vol. 12, No. 2
In some models employed, CEO overconfidence—the major predictor examined in this study—has a conflict-ing effect on the post-merger operatconflict-ing performance. On one hand, when Measure C is employed, the results of the tests, in general, indicate that CEO overconfidence significantly and posi-tively affects the post-merger perfor-mance. On the other hand, when Mea-sure A is used, the results of the tests, overall, also demonstrate a significant but negative effect of the CEO over-confidence on the post-merger perfor-mance. When Measure B is used, however, none of CEO overconfidence significantly affects the measures of post-merger performance. These con-firm the mixed findings in the univariate tests conducted. Overall, the findings suggest that each of the behavioral measures designed in this study may capture CEO overconfidence in differ-ent ways. Therefore, a better measure needs to be designed, and its effect on post-merger performance needs to be re-examined by future researchers.
The result for the period of merger generally indicates that mergers un-dertaken during merger waves have a positive and significant effect on the post-merger operating performance. This basically means that in-wave mergers lead to better post-merger operating performance, this may occur as there are many targets available during the merger waves and bidders could choose one which is the most favorable to them. This, in turn, will result in better post-merger operating performance for the merged firms.
This finding is also consistent with that in the univariate tests.
Another result of this study indi-cates that the industry of merged firms, in general, positively and significantly affects the post-merger operating per-formance, implying that intra-industry mergers lead to better post-merger performance. This evidence is perhaps caused by the fact that managing a focused firm is relatively less difficult than managing a diversified firm, and the bidder CEO might already have better experience and knowledge of the target’s businesses. The result of univariate tests, however, does not show any significant difference in the post-merger operating performance between intra- and inter-industry merg-ers.
In addition, the results of this study shows that the pre-merger operating performance generally has a positive and significant effect on the post-merger operating performance. This finding indicates that bidders with higher pre-merger operating perfor-mance are more likely to generate better post-merger operating
perfor-mance. In summary, this study pro-vides evidence that mergers under-taken outside the waves, inter-industry mergers, the payment of higher premi-ums, and poor pre-merger operating performance lead to the bidders pro-ducing poor post-merger operating per-formance.
References
Alicke, M. D., M. L. Klotz, D. L. Breitenbecher, and T. J. Yurak. 1995. Personal contact, individuation, and the better-than-average effect. Journal of Personality & Social Psychology 68 (5): 804-825.
Andrade, G., M. Mitchell M., and E. Safford. 2001. New evidence and perspectives on mergers. Journal of Economic Perpectives 15 (2): 103-120.
Bradley, M., A. Desay, and E. Kim. 1988. Synergistic gains and their division between the stockholders of target and acquiring firms. Journal of Financial Economics 21 (May): 3-40.
Clark, K., and E. Ofek. 1994. Mergers as a means of restructuring distressed firms: An empirical investigation. Journal of Financial and Quantitatvie Analysis 29 (4):541-565.
Crawford, D., and T. A. Lechner. 1996. Takeover premiums and anticipated merger gains in the US market for corporate control. Journal of Business Finance and Accounting
23 (5-6): 807-830.
Fama, E., and K. French. 1997. Industry costs of equity. Journal of Financial Economics
43: 153–193.
Ghosh, A. 2001. Does operating performance really improve following corporate acquisi-tions? Journal of Corporate Finance 7: 151-178.
Harford, J. 2005. What drives merger waves? Journal of Financial Economics 77: 529–560. Hayward, M. L. A., and D. C. Hambrick. 1997. Explaining the premium paid for large acquisitions: Evidence of CEO Hubris. Administrative Science Quarterly 42 (1): 103-127.
Healy, P., C. Palepu, and R. Ruback. 1992. Does corporate performance improve after mergers? Journal of Financial Economics 31 (2): 135-175.
Heaton, J. B. 2002. Managerial optimism and corporate finance. Financial Management 31: 33-45.
280
Gadjah Mada International Journal of Business, May-August 2010, Vol. 12, No. 2
Heron R., and E. Lie. 2002. Operating performance and the method of payment in takeovers.
Journal of Financial and Quantitative Analysis 37 (1): 137-155.
Kruse T. A., H. Y. Park, K. Park, and K. Suzuki. 2002. The value of corporate diversification: Evidence from post-merger performance in Japan. Working Paper. University of Arkansas.
Linn, S., and J. Switzer. 2001. Are cash acquisitions associated with better post combination operating performance than stock acquisitions? Journal of Banking and Finance 25: 1113- 1138.
Malmendier, U., and G. Tate. 2003. Who makes acquisitions? CEO overconfidence and the market’s reaction. Working Paper. Stanford University and Harvard University. McCauley, D. 1997. Executing the successful merger: Smart play in a high-risk game. CSC
Index Genesis [now Cap Gemini/Ernst&Young]
Mitchell, M. L., and H. J. Mulherin. 1996. The impact of industry shocks on takeover and restructuring activity. Journal of Financial Economics 41 (2): 193-229.
Moeller, S. B., and F. P. Schlingemann. 2004. Are cross-border acquisitions different from domestic acquisitions? Evidence on Stock and Operating Performance of U.S. Acquirers. Journal of Banking and Finance.
Powell, R., and A. W. Stark. 2005. Does operating performance increase post-takeover for UK takeovers? A comparison of performance measures and benchmarks. Journal of Corporate Finance 11: 293-317.
Raj, M., and M. Forsyth. 2003. Hubris amongst U.K. bidders and losses to shareholders.
International Journal of Business 8 (1): 1-16.
Rajan, R., H. Serveas, and L. Zingales. 2000. The cost of diversity: The diversification discount and ineffcient investment. Journal of Finance 55: 35-80.
Rhodes-Kropf, M., and S. Viswanathan. 2004. Market valuation and merger waves. Journal of Finance 59 (6): 2685-2718.
Roll, R. 1986. The hubris hypothesis of corporate takeovers. The Journal of Business 59 (2): 197-216.
Scharfstein, D., and J. Stein. 2000. The dark side of internal capital markets: Divisional rent seeking and inefficient investment. Journal of Finance 55: 2537-2564.
Sharma, D. S., and J. Ho. 2002. The impact of acquisitions on operating performance: Some Australian evidence. Journal of Business Finance and Accounting 29 (1/2): 155-200. Shin, H., and R. Stulz. 1998. Are internal capital markets efficient? Quarterly Journal of
Economics 113: 531-552.
Shleifer, A., and R. Vishny. 1989. Management entrenchment: The case of manager-specific investments. Journal of Financial Economics 25: 123 - 139.
Shleifer, A., and R. W. Vishny. 1988. Value-maximization and the acquisition process.
Journal of Economic Perspectives 2 (Winter): 7-20.
Soegiharto, S. 2008. Drivers of merger waves: A revisit. Gadjah Mada International Journal of Business 10 (1).
Soegiharto, S. 2010. What drives the payment of higher merger premiums? Gadjah Mada International Journal of Business 11 (2): 191-228.
282
Gad
jah
Ma
da I
nte
rna
tion
al Jo
urna
l of B
usin
ess
,
May
-Au
gu
st 201
0, Vo
l. 12,
No. 2
Appendix 1. Predicting Post-Merger Operating Performance Using Each of Measures of CEOs’ Behavior and Classified Predictors
The predictors employed in the regression analysis are classified as follows: accounting numbers factors that consist of free cash flows and leverage, financing factors that consist of method of payment and capital liquidity, merger factors that comprise the period of merger and the industry of merged firms, and CEOs factors that contain CEO tenure and CEO stock ownerships. Measure A, Measure B, and Measure C are used in Model A, Model B, and Model C, respectively, as measures of CEOs’ behavior.
(Panel A) Predicting post-merger return on assets (ROA)
Without Measure of CEOs’ Behavior With Measure A (Model A) With Measure B (Model B) With Measure C (Model C)
1 2 3 4 A1 A2 A3 A4 B1 B2 B3 B4 C1 C2 C3 C4
Intercept 0.075 0.107 0.049 0.048 0.081 0.104 0.044 0.070 0.080 0.115 0.031 0.069 0.066 0.094 0.039 0.033
[0.000] [0.000] [0.000] [0.000] [0.000] [0.000] [0.000] [0.000] [0.000] [0.000] [0.000] [0.000] [0.000] [0.000] [0.000] [0.002]
Pre-Merger FCF 0.000 0.000 0.000 0.000
[0.105] [0.154] [0.102] [0.092]
Pre-Merger Lev. -0.105 -0.083 -0.103 -0.104
[0.001] [0.007] [0.001] [0.001]
Method of Payment -0.019 -0.011 -0.017 -0.028
[0.298] [0.418] [0.339] [0.085]
Capital Liquidity -0.021 -0.060 -0.022 -0.007
[0.336] [0.003] [0.315] [0.719]
Period of Merger 0.006 0.001 0.002 0.004
[0.594] [0.951] [0.854] [0.700]
Firms’ Industry -0.015 -0.007 -0.010 -0.015
[0.155] [0.440] [0.209] [0.138]
CEO Stock Ownerships 0.062 0.008 0.007 0.008
[0.098] [0.303] [0.335] [0.269]
CEO Tenure 0.000 0.000 0.000 0.000
[0.476] [0.923] [0.802] [0.562]
CEOs’ Behavior -0.023 -0.035 -0.011 -0.016 -0.009 -0.013 0.002 -0.019 0.016 0.009 0.023 0.045
[0.200] [0.012] [0.234] [0.256] [0.640] [0.494] [0.853] [0.198] [0.382] [0.543] [0.021] [0.000]
Adjusted R2 0.065 0.000 0.001 0.004 0.057 0.104 -0.003 -0.002 0.061 -0.004 -0.007 0.001 0.064 0.002 0.018 0.059
SE of the Estimate 0.114 0.105 0.078 0.085 0.104 0.072 0.065 0.100 0.114 0.105 0.059 0.099 0.114 0.092 0.077 0.087
p-value for F-test 0.002 0.379 0.341 0.254 0.012 0.001 0.513 0.483 0.006 0.493 0.657 0.345 0.004 0.347 0.058 0.001
ihar
to—
W
hat D
rive
s Da
mag
e on
Post
-M
erge
r O
pera
ting
Perf
orm
ance
?
(Panel B) Predicting post-merger net income to sales (NIS)
Without Measure of CEOs’ Behavior With Measure A (Model A) With Measure B (Model B) With Measure C (Model C)
1 2 3 4 A1 A2 A3 A4 B1 B2 B3 B4 C1 C2 C3 C4
Intercept 0.039 0.072 0.049 0.064 0.056 0.093 0.073 0.082 0.040 0.036 0.041 0.060 0.035 0.077 0.045 0.050
[0.001] [0.000 [0.000 [0.000 [0.001 [0.000 [0.000 [0.000 [0.008 [0.020 [0.000 [0.000 [0.015 [0.000 [0.000 [0.000
Pre-Merger FCF 0.000 0.000 0.000 0.000
[0.181] [0.205] [0.181] [0.174]
Pre-Merger Lev. -0.046 -0.053 -0.046 -0.046
[0.067] [0.053] [0.074] [0.067]
Method of Payment -0.003 -0.001 -0.001 0.000
[0.852] [0.955] [0.936] [0.988]
Capital Liquidity -0.017 -0.027 -0.005 -0.019
[0.383] [0.195] [0.788] [0.310]
Period of Merger 0.003 0.010 0.013 0.003
[0.768] [0.399] [0.217] [0.737]
Firms’ Industry -0.012 0.000 -0.010 -0.013
[0.158] [0.982] [0.280] [0.134]
CEO Stock Ownerships -0.014 -0.016 -0.011 -0.012
[0.699] [0.015] [0.103] [0.071]
CEO Tenure 0.000 0.000 0.000 0.000
[0.939] [0.891] [0.663] [0.918]
CEOs’ Behavior -0.026 -0.030 -0.037 -0.025 -0.002 0.035 0.009 -0.001 0.006 -0.010 0.007 0.024
[0.129] [0.067 [0.001] [0.037] [0.905] [0.018] [0.338] [0.943] [0.669] [0.502] [0.396] [0.043]
Adjusted R2 0.019 -0.009 0.000 -0.010 0.038 0.018 0.045 0.044 0.012 0.021 0.002 -0.001 0.013 -0.011 0.000 0.017
SE of the Estimate 0.090 0.085 0.065 0.084 0.092 0.087 0.077 0.083 0.091 0.078 0.068 0.086 0.091 0.084 0.065 0.086
p-value for F-test 0.097 0.679 0.362 0.898 0.049 0.159 0.006 0.006 0.198 0.120 0.334 0.426 0.184 0.704 0.385 0.078
284
Gad
jah
Ma
da I
nte
rna
tion
al Jo
urna
l of B
usin
ess
,
May
-Au
gu
st 201
0, Vo
l. 12,
No. 2
(Panel C) Predicting post-merger market-to-book (M/B)
Without Measure of CEOs’ Behavior With Measure A (Model A) With Measure B (Model B) With Measure C (Model C)
1 2 3 4 A1 A2 A3 A4 B1 B2 B3 B4 C1 C2 C3 C4
Intercept 0.840 0.864 0.923 1.094 1.059 0.781 0.853 1.166 0.947 0.838 0.829 1.326 0.613 0.800 0.676 0.889
[0.002] [0.000] [0.000] [0.000] [0.003] [0.000] [0.000] [0.000] [0.008] [0.000] [0.000] [0.000] [0.071] [0.000] [0.000] [0.000]
Pre-Merger FCF 0.007 0.007 0.007 0.007
[0.000] [0.000] [0.000] [0.000]
Pre-Merger Lev. -1.682 -1.631 -1.657 -1.668
[0.004] [0.006] [0.005] [0.004]
Method of Payment 0.069 -0.001 0.067 0.052
[0.629] [0.993] [0.641] [0.719]
Capital Liquidity -0.330 -0.311 -0.329 -0.319
[0.045] [0.055] [0.046] [0.053]
Period of Merger -0.058 0.015 -0.066 -0.282
[0.691] [0.924] [0.640] [0.023]
Firms’ Industry -0.283 -0.197 -0.171 -0.284
[0.039] [0.197] [0.200] [0.013]
CEO Ownerships -1.319 -1.340 -1.038 -1.173
[0.058] [0.070] [0.133] [0.103]
CEO Tenure 0.000 0.000 0.000 0.000
[0.013] [0.010] [0.012] [0.019]
CEOs’ Behavior -0.655 0.228 0.075 0.000 -0.174 0.036 -0.020 -0.306 0.387 0.136 0.330 0.507
[0.072] [0.106] [0.625] [1.000] [0.637] [0.811] [0.887] [0.264] [0.269] [0.312] [0.003] [0.038]
Adjusted R2 0.158 0.023 0.012 0.027 0.202 0.034 -0.006 0.025 0.153 0.015 -0.004 0.025 0.159 0.023 0.083 0.038
SE of the Estimate 2.170 0.702 0.970 1.615 2.109 0.634 1.023 1.742 2.176 0.705 0.934 1.709 2.168 0.702 0.777 1.700
p-value for F-test 0.000 0.104 0.094 0.025 0.000 0.104 0.609 0.056 0.000 0.207 0.554 0.046 0.000 0.137 0.000 0.014
ihar
to—
W
hat D
rive
s Da
mag
e on
Post
-M
erge
r O
pera
ting
Perf
orm
ance
?
The predictors employed in the regression analysis are classified as follows: accounting numbers factors that consist of free cash flows and leverage, financing factors that consist of method of payment and capital liquidity, merger factors that comprise the period of merger and the industry of merged firms, and CEOs factors that contain CEO tenure and CEO stock ownerships. Measure A, Measure B, and Measure C are used in Model A, Model B, and Model C, respectively, as measures of CEOs’ behavior.
(Panel A) Predicting post-merger return on assets (ROA)
Without Measure of Behavior With Measure A (Model A) With Measure B (Model B) With Measure C (Model C)
1 2 3 4 A1 A2 A3 A4 A5 B1 B2 B3 B4 B5 C1 C2 C3 C4 C5
Intercept 0.082 0.046 0.022 0.032 0.060 0.042 0.036 0.007 0.067 0.099 0.066 0.033 0.023 0.055 0.086 0.052 0.025 -0.010 0.036
[0.007] [0.161] [0.554] [0.411] [0.058] [0.257] [0.387] [0.859] [0.137] [0.005] [0.069] [0.438] [0.555] [0.194] [0.005] [0.136] [0.524] [0.787] [0.377]
Pre-Merger FCF 0.000 0.000 0.000 0.000 0.000 0.000 0.000 0.000 0.000 0.000 0.000 0.000 0.000 0.000 0.000 0.000 0.000 0.000 0.000
[0.086][0.120] [0.105] [0.037] [0.001] [0.012] [0.103] [0.173] [0.041] [0.075] [0.106] [0.103] [0.182][0.036] [0.032] [0.131] [0.114] [0.165][0.037]
Pre-Merger Lev. -0.091 -0.084 -0.067 0.009 -0.087 -0.057 -0.063 -0.012 -0.010 -0.084 -0.075 -0.062 0.010 0.023 -0.116 -0.083 -0.066 -0.013 0.002
[0.064] [0.082][0.185] [0.852][0.053][0.227] [0.208] [0.809] [0.834][0.091] [0.120] [0.222] [0.834] [0.622] [0.016] [0.088][0.194] [0.782] [0.969] Meth. of Payment 0.030 0.011 0.016 -0.015 0.045 0.034 0.027 0.012 0.000 0.032 0.012 0.016 -0.003 -0.016 0.030 0.015 0.018 -0.005 -0.009 [0.287] [0.705] [0.587] [0.574][0.091][0.262] [0.360] [0.662] [0.988] [0.262] [0.669] [0.578] [0.917] [0.547] [0.285] [0.624] [0.559] [0.865] [0.735] Capital Liquidity -0.022 -0.030 -0.020 0.026 -0.019 -0.026 -0.037 -0.023 0.004 -0.025 -0.036 -0.023 -0.012 0.019 -0.015 -0.029 -0.020 -0.005 0.013
[0.536] [0.392] [0.579] [0.426] [0.549] [0.449] [0.291] [0.487] [0.911] [0.473] [0.309] [0.529] [0.713] [0.573] [0.647] [0.404] [0.582] [0.868] [0.706]
Period of Merger 0.029 0.042 0.062 0.032 0.062 0.037 0.058 0.027 0.040 0.023 0.050 0.027 0.040 0.035 0.062
[0.345] [0.174] [0.049] [0.330] [0.078] [0.275] [0.114] [0.381] [0.199] [0.440] [0.124] [0.389] [0.195] [0.247][0.059]
Firms’ Industry 0.065 0.052 0.045 0.040 0.053 0.048 0.044 0.070 0.054 0.053 0.047 0.065 0.052 0.049 0.048
[0.028] [0.089] [0.100] [0.173] [0.075] [0.086] [0.130] [0.019] [0.081] [0.052] [0.085] [0.029] [0.092] [0.075] [0.087]
CEO Ownerships -0.003 -0.001 -0.006 -0.006 0.001 -0.003 -0.007 -0.001 -0.003 -0.006 0.001
[0.407] [0.842] [0.651] [0.615] [0.947] [0.470] [0.239] [0.815] [0.406] [0.412] [0.958]
CEO Tenure 0.000 0.000 0.000 0.000 0.000 0.000 0.000 0.000 0.000 0.000 0.000
[0.291] [0.422] [0.558] [0.574] [0.762] [0.353] [0.483] [0.597] [0.282] [0.416] [0.640]
Pre-Merger ROA 0.445 0.377 0.299 0.460 0.492 0.409 0.419
[0.000] [0.003] [0.003] [0.000] [0.000] [0.001] [0.001]
Premiums Paid -0.104 -0.109 -0.096 -0.106
[0.022] [0.021] [0.033] [0.024]
CEOs’ Behavior -0.038 -0.037 -0.019 -0.013 -0.019 -0.030 -0.037 -0.016 -0.042 -0.038 -0.025 -0.015 -0.007 0.016 0.002
[0.131] [0.195] [0.527] [0.647] [0.516] [0.299] [0.190] [0.590] [0.118] [0.160] [0.343] [0.592] [0.793] [0.554] [0.933]
286
Gad
jah
Ma
da I
nte
rna
tion
al Jo
urna
l of B
usin
ess
,
May
-Au
gu
st 201
0, Vo
l. 12,
No. 2
(Panel B) Predicting post-merger net income to sales (NIS)
Without Measure of Behavior With Measure A (Model A) With Measure B (Model B) With Measure C (Model C)
1 2 3 4 A1 A2 A3 A4 A5 B1 B2 B3 B4 B5 C1 C2 C3 C4 C5
Intercept 0.032 0.007 0.001 0.008 0.054 0.032 0.041 0.006 0.043 0.026 0.001 -0.013 -0.038 -0.006 0.040 0.012 0.008 -0.016 0.028
[0.131] [0.763] [0.980] [0.785] [0.053] [0.292] [0.235] [0.827] [0.182] [0.275] [0.962] [0.680] [0.198] [0.862] [0.070] [0.598] [0.770] [0.557] [0.359]
Pre-Merger FCF 0.000 0.000 0.000 0.000 0.000 0.000 0.000 0.000 0.000 0.000 0.000 0.000 0.000 0.000 0.000 0.000 0.000 0.000 0.000
[0.045][0.109] [0.197] [0.191][0.060][0.222] [0.577] [0.658] [0.326][0.052] [0.121] [0.209] [0.246] [0.218] [0.043][0.106] [0.201] [0.352] [0.172] Pre-Merger Lev. -0.027 -0.017 -0.018 0.003 0.001 -0.001 0.022 0.019 0.009 -0.030 -0.020 -0.025 -0.014 -0.004 -0.025 -0.016 -0.021 0.005 0.000
[0.438] [0.608] [0.616] [0.934] [0.978] [0.982] [0.584] [0.566] [0.788] [0.393] [0.548] [0.499] [0.682] [0.913] [0.470] [0.617] [0.550] [0.876] [0.996]
Meth. of Payment 0.031 0.015 0.013 0.009 0.048 0.028 0.026 0.019 0.008 0.030 0.014 0.013 0.019 0.009 0.037 0.019 0.019 0.030 0.015
[0.131] [0.469] [0.532] [0.666][0.044][0.267] [0.301] [0.368] [0.691] [0.136] [0.475] [0.532] [0.328] [0.644] [0.077][0.368] [0.396] [0.150] [0.437] Capital Liquidity -0.005 -0.001 -0.002 0.003 -0.021 -0.022 -0.033 -0.027 -0.020 -0.003 0.001 0.003 -0.002 0.007 -0.003 -0.001 -0.003 -0.012 0.003
[0.858] [0.958] [0.929] [0.921] [0.465] [0.461] [0.268] [0.293] [0.442] [0.918] [0.969] [0.913] [0.935] [0.780] [0.899] [0.954] [0.902] [0.639] [0.895]
Period of Merger 0.051 0.051 0.060 0.027 0.023 0.022 0.029 0.052 0.054 0.046 0.064 0.046 0.044 0.026 0.045
[0.025] [0.040] [0.011] [0.401] [0.461] [0.392] [0.283] [0.024] [0.032] [0.046] [0.008] [0.052] [0.092] [0.276][0.064]
Firms’ Industry 0.040 0.045 0.055 0.048 0.052 0.049 0.051 0.039 0.043 0.041 0.053 0.041 0.046 0.048 0.056
[0.050] [0.049] [0.012] [0.058] [0.043] [0.018] [0.016] [0.060] [0.062] [0.052] [0.014] [0.050] [0.040] [0.024] [0.009]
CEO Ownerships -0.003 0.004 -0.022 -0.015 -0.008 -0.003 0.003 0.003 -0.003 0.003 0.003
[0.396] [0.313] [0.045] [0.102] [0.364] [0.353] [0.480] [0.384] [0.337] [0.410] [0.438]
CEO Tenure 0.000 0.000 0.000 0.000 0.000 0.000 0.000 0.000 0.000 0.000 0.000
[0.495] [0.318] [0.390] [0.318] [0.339] [0.412] [0.407] [0.249] [0.432] [0.427] 0.182]
Pre-Merger NI/Sls 0.467 0.549 0.554 0.375 0.459 0.467 0.478
[0.000] [0.000] [0.000] [0.001] [0.000] [0.000] [0.000]
Premiums Paid -0.100 -0.077 -0.100 -0.108
[0.004] [0.022] [0.004] [0.002]
CEOs’ Behavior -0.053 -0.041 -0.037 -0.028 -0.043 0.010 0.010 0.019 0.021 0.020 -0.026 -0.016 -0.018 -0.030 -0.042
[0.022][0.117] [0.166] [0.202] [0.063][0.624] [0.606] [0.388] [0.313] [0.348] [0.187] [0.423] [0.397] [0.137][0.035]
Adjusted R2 0.033 0.116 0.100 0.396 0.088 0.121 0.145 0.445 0.516 0.024 0.107 0.097 0.239 0.395 0.043 0.112 0.102 0.318 0.428
SE of the Est. 0.088 0.084 0.087 0.078 0.096 0.095 0.094 0.076 0.072 0.089 0.085 0.087 0.080 0.078 0.088 0.085 0.087 0.081 0.076
p-value for F-test 0.155 0.016 0.047 0.000 0.045 0.027 0.023 0.000 0.000 0.231 0.027 0.059 0.001 0.000 0.136 0.023 0.051 0.000 0.000
ihar
to—
W
hat D
rive
s Da
mag
e on
Post
-M
erge
r O
pera
ting
Perf
orm
ance
?
Without Measure of Behavior With Measure A (Model A) With Measure B (Model B) With Measure C (Model C)
1 2 3 4 A1 A2 A3 A4 A5 B1 B2 B3 B4 B5 C1 C2 C3 C4 C5
Intercept 0.631 0.289 -0.994 -0.469 0.754 0.517 -0.002 -0.152 0.178 1.473 0.611 -1.016 -0.968 -0.393 1.178 0.370 -1.063 -0.999 -0.513 [0.306] [0.669] [0.177] [0.510] [0.214] [0.442] [0.998] [0.837] [0.831] [0.033] [0.411] [0.227] [0.257] [0.624] [0.069] [0.607] [0.165] [0.206] 0.503]
Pre-Merger FCF 0.008 0.007 0.010 0.010 0.010 0.010 0.010 0.008 0.010 0.007 0.008 0.010 0.010 0.010 0.007 0.007 0.010 0.010 0.010
[0.000] [0.001] [0.000] [0.000] [0.000] [0.000] [0.000] [0.000] [0.000] [0.000] [0.000] [0.000] [0.000] [0.000] [0.001] [0.001] [0.000] [0.000] [0.000]
Pre-Merger Lev. -1.667 -1.612 -1.064 -0.498 -1.119 -1.005 -1.336 -1.109 -0.867 -1.690 -1.435 -1.075 -1.043 -0.466 -1.872 -1.606 -1.095 -1.049 -0.499
[0.089][0.104] [0.267] [0.539] [0.180] [0.236] [0.149] [0.198] [0.315][0.075] [0.152] [0.275] [0.293] [0.575] [0.048][0.107] [0.250] [0.281] [0.541] Meth. of Payment 0.981 0.765 0.928 -0.356 1.017 0.845 0.787 -0.223 -0.331 0.733 0.800 0.926 0.882 -0.358 0.754 0.812 0.790 0.871 -0.365
[0.096][0.219] [0.118] [0.484][0.049][0.137] [0.175] [0.680] [0.540] [0.196] [0.199] [0.121] [0.149] [0.485] [0.193] [0.205] [0.190] [0.159] [0.479] Capital Liquidity -0.789 -0.975 -0.373 -0.093 -0.858 -0.747 -0.612 -0.507 -0.198 -1.032 -1.053 -0.368 -0.422 -0.119 -0.953 -0.975 -0.357 -0.415 -0.089 [0.270] [0.184] [0.591] [0.880] [0.157] [0.239] [0.355] [0.426] [0.766] [0.132] [0.154] [0.602] [0.559] [0.851] [0.166] [0.187] [0.605] [0.562] [0.886]
Period of Mergers -0.067 0.426 1.158 0.597 1.043 0.997 0.822 -0.108 0.430 0.331 1.135 -0.097 0.587 0.351 1.186
[0.920] [0.494] [0.063] [0.350] [0.131] [0.140] [0.256] [0.871] [0.495] [0.629][0.075] [0.885] [0.353] [0.614] [0.068]
Firms’ Industry 0.878 0.316 -0.206 0.045 0.089 0.041 -0.206 0.957 0.313 0.306 -0.202 0.879 0.353 0.308 -0.203
[0.155] [0.601] [0.699] [0.934] [0.875] [0.938] [0.707] [0.124] [0.609] [0.618] [0.706] [0.156] [0.556] [0.615] [0.704]
CEO Ownerships 0.049 0.216 0.214 0.311 0.388 0.049 0.036 0.218 -0.006 0.038 0.219
[0.517] [0.007] [0.386] [0.179] [0.098] [0.533] [0.668][0.007] [0.945] [0.658] [0.008]
CEO Tenure 0.000 0.000 0.000 0.000 0.000 0.000 0.000 0.000 0.000 0.000 0.000
[0.095] [0.661] [0.584] [0.772] [0.757] [0.101] [0.102] [0.699] [0.101] [0.103] [0.688]
Pre-Merger M/B 0.749 0.655 0.717 0.037 0.752 0.034 0.746
[0.000] [0.000] [0.000] [0.702][0.000] [0.732] [0.000]
Premiums Paid -0.327 -0.416 -0.313 -0.310
[0.695] [0.631] [0.710] [0.713]
CEOs’ Behavior -1.126 -0.931 -0.685 -0.528 -0.610 -0.732 -0.625 0.033 -0.003 -0.108 -0.325 -0.198 0.292 0.065
0.081
[0.023] [0.083] [0.233] [0.340] [0.293] [0.195] [0.293] [0.955] [0.996] [0.833] [0.550] [0.729] [0.595] [0.909] [0.870]
Adjusted R2 0.155 0.155 0.225 0.530 0.308 0.298 0.295 0.481 0.538 0.162 0.156 0.215 0.207 0.524 0.149 0.147 0.220 0.207 0.524