Gadjah Mada International Journal of Business Vol. 19, No. 1 (January-April 2017): 59-76
The Performance of Socially Responsible Investments
in Indonesia: A Study of the Sri Kehati Index (SKI)
Abdul Hadi Zulkafli,
*Zamri Ahmad,
and
Eky Ermal M.
School of Management, Universiti Sains Malaysia, MalaysiaAbstract: This study examines the performance of the Sri Kehati Index (SKI) against the Jakarta Com-posite Index (JCI) as the market index, using respective daily index prices from the 1st of January 2009 to
the 31st of December 2014. This study uses the risk-adjusted return of Sharpe’s Index, the Adjusted
Sharpe’s Index (ASI), Treynor’s Index, Jensen’s Alpha Index, the Adjusted Jensen’s Alpha Index (AJI) and Sortino’s Ratio to examine the performance of the SKI and the JCI. Except for Sharpe’s Index and the Adjusted Sharpe’s Index, the risk-adjusted return performance of the SKI (Treynor, Jensen’s Alpha, Adjusted Jensen’s Alpha and Sortino) outperforms the JCI as the conventional benchmark. However, Jensen’s Alpha is the only performance measure that is significant and therefore supports that the SKI outperforms the JCI during the overall period from 2009 to 2014. As there is a contradiction between the adjusted returns of Sharpe’s Index/Adjusted Sharpe’s Index and Jensen’s Alpha Index, the hypothesis that the SKI presents a higher risk adjusted performance than the JCI does, it cannot be accepted. Even though the performance of SKI in this study is slightly lower over the whole period of the study, it is still generating competitive returns.
Abstrak:Penelitian ini menguji kinerja Sri Kehati Indeks (SKI) terhadap Indeks Harga Saham Gabungan (IHSG) sebagai indeks pasar, dengan menggunakan harga indeks harian masing-masing dari 1 Januari 2009 sampai 31 Desember 2014. Penelitian ini menggunakan risk-adjusted return of Sharpe’s Index, Adjusted Sharpe’s Index (ASI), Treynor’s Index, Jensen’s Alpha Index, Adjusted Jensen’s Alpha Index (AJI), dan Sortino Ratio untuk menguji kinerja SKI dan IHSG. Kecuali untuk Sharpe’s Index dan Adjusted Sharpe’s Index, kinerja risk-adjusted return dari SKI (Treynor, Jensen’s Alpha, Adjusted Jensen’s Alpha dan Sortino) melebihi IHSG sebagai patokan konvensional. Namun, Jensen Alpha adalah satu-satunya ukuran kinerja yang signifikan dan karena itu mendukung bahwa SKI melebihi IHSG selama periode keseluruhan dari 2009 sampai 2014. Seperti ada kontradiksi antara adjusted returns of Sharpe’s Index/Adjusted Sharpe’s Index and Jensen’s Alpha Index, hipotesis bahwa SKI menyajikan kinerja sesuaian risiko lebih tinggi dari IHSG tidak dapat diterima. Meskipun kinerja SKI dalam penelitian ini adalah sedikit lebih rendah selama seluruh periode penelitian, masih menghasilkan keuntungan kompetitif.
Keywords: Indonesian Stock Exchange; socially responsible investment; Sri Kehati Index (SKI)
Introduction
Socially Responsible Investment (SRI), which is concerned with ethical investment decisions, has grown significantly in the last four decades. Socially responsible investors use a combination of financial and social cri-teria to focus on their investment decisions, hence the investments they select are consis-tent with their personal value’s system and beliefs, (Das and Rao 2013; Hamilton et al. 1993; Sauer 1997). SRI describes an invest-ment process which considers and adopts the issues of Environmental, Social, Governance (ESG) or ethical considerations. According to The Forum for Sustainable and Respon-sible Investment (2012), this process is inte-grated into an investment’s selection, by the inclusion of one or more of the ESG’s prac-tices in the analysis and monitoring of an in-vestment
An awareness of SRI also exists in In-donesia. This is manifest by the creation of an index called the Sri Kehati Index (SKI). This index was developed by the KEHATI Foundation, in collaboration with the Indo-nesian Stock Exchange (IDX) in 2009. The creation of this index was triggered partly by the environmental destruction caused by some Indonesian companies, such as PT Newmont Nusa Tenggara and PT Newmont Minahasa Raya Mine. It was expected that the public would be made aware of the exist-ence of an index showing companies regarded as beneficial and constantly managing sus-tainable development. The SKI was estab-lished as an ethical index for SRI investors to review the performance of companies’ prof-itability, supported by their ESG perfor-mances. The establishment of a socially re-sponsible investment index aimed to raise awareness of the conservation of biodiversity among the shareholders, the
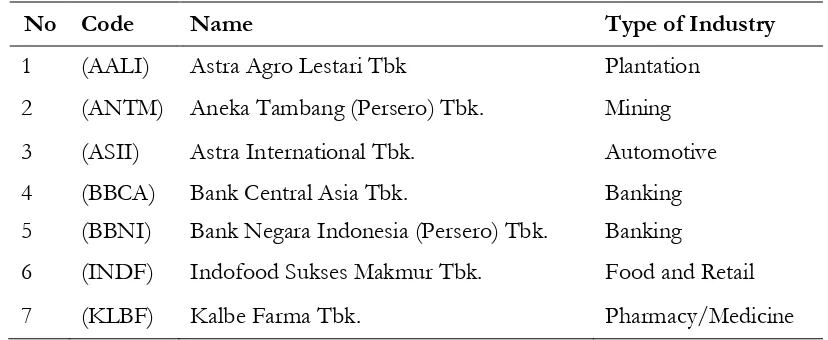
in-dustry and the capital market’s players. It also had the objective of providing open infor-mation to the public regarding the selection and identification of companies included in the index. The inclusion of the companies is evaluated twice a year, in April and October. The screening process involves an initial ex-clusion selection of negative line-of-business aspects [such as pesticide use, nuclear, weap-ons, tobacco, alcohol, pornography, gambling, and Genetically Modified Organisms (GMO)]. This is then followed by the finan-cial screening of the companies i.e. their market capitalization and an asset ownership of above Rp 1 trillion, based on their latest audited financial reports, with a 10 percent public ownership on the Indonesian Stock Exchange. The companies must also have maintained a positive Price/Earnings (PE) Ratio during the last six months. A further screening also evaluates the fundamental as-pects of the companies (such as their corpo-rate governance, environmental record, com-munity involvement, business manners, hu-man resources, and huhu-man rights record). Eventually, the selection process de-termines 25 companies that are qualified to be included in the SKI. Table 1 shows the companies which were consistently listed in the SKI during five years (2009 to 2014) on the Indonesian Stock Exchange.
(2014), where Layungasri’s (2010) study con-cerned the mining companies that were listed in the SKI. This study discussed “green com-panies” i.e. the way mining companies car-ried out their CSR as part of their responsi-bilities to the environment. It concluded that the mining companies obeyed the laws and the requirements for SRI screening and SRI criteria, so that they would be accepted and recognized as part of the SKI. Furthermore, Khotim (2014) only conducted his analysis with a single index model of a portfolio, with-out calculating Sharpe, Jensen and Treynor’s measurements over the 2010 to 2013 period. However, this does not specifically discuss a comparison of the risk-return performance of the SKI with conventional benchmarks. A SRI study from a neighboring country (Ma-laysia) also showed the existence of SRI em-pirical literature on emerging markets. Nev-ertheless, this Malaysian SRI study did not focus on financial performance analyses. It was conducted by Adam and Shauki (2012) and directed towards the behavior of SRI in-vestors’ decision making processes. Using Jensen’s Alpha for equally weighted portfo-lios of ethical and conventional funds from Asia-Pacific countries (Australia, Japan,
Ma-laysia and Singapore), Renneboog et al. (2008a) found a striking finding that SRI funds in all the countries underperformed both the stock market index and the conven-tional funds.
SKI has been realized as a potential tool for social and economic change. As stated by Waring and Lewer (2004), investors found out that their funds were invested according to social concerns, without consideration of the financial returns. In addition, SRI is perceived as an investment that essentially results in lower risks to the investor (Sauer 1997). Con-sistent with this argument, studies by Hamilton et al. (1993) and McGuire et al. (1988) indicated that they mostly agreed that socially-ethical investments are associated with lower risks. One important question that must be asked here is: ‘Are the risks and re-turns of socially responsible stocks equal to the risk and returns of conventional stocks?’ Studies into this issue have increased signifi-cantly in the recent years, but the results have been rather mixed. Hence, this study will ex-amine and compare the performance of the SKI against the benchmark market index of the Jakarta Composite Index (JCI) in order to ascertain whether socially responsible
invest-No Code Name Type of Industry
1 (AALI) Astra Agro Lestari Tbk Plantation
2 (ANTM) Aneka Tambang (Persero) Tbk. Mining
3 (ASII) Astra International Tbk. Automotive
4 (BBCA) Bank Central Asia Tbk. Banking
5 (BBNI) Bank Negara Indonesia (Persero) Tbk. Banking
6 (INDF) Indofood Sukses Makmur Tbk. Food and Retail
7 (KLBF) Kalbe Farma Tbk. Pharmacy/Medicine
ments do indeed provide superior perfor-mance.
The result of this socially responsible investment study is expected to contribute to both investors and listed companies as well. Stockholders can get benefits, not only from the returns on their investments, but also help the companies get ESG benefits for bet-ter sustainable and responsible practices. The result of this study is also expected to pro-vide information to help investors make bet-ter investment decisions in order to get the best risk-return profile.
The rest of the paper is organized as follows. Section 2 will review the previous studies into socially responsible investments, and discuss the performance measures used in previous empirical research. The method-ology is explained in Section 3. In Section 4, the findings and discussion will be presented. Section 5 will conclude the paper.
Literature Review
Theoretical Perspective of
Socially Responsible Investment
Neo-classical economics assumes that investors care about two characteristics of their investment decisions, i.e. the investment’s expected risk and its expected return (Hickman et al. 1999). From the per-spective of responsible investment, SRI is not only focused on the risk-return relationship of an investment but also the impact of the investment on society (Plantinga and Scholtens 2001)
Triple Bottom Line Perspective
Different investors might have differ-ent mindsets (Sandberg 2007). SRI investors avoid companies that produce goods related
to any of the negative screenings. They se-lect companies which have a positive record with good social, environmental and gover-nance histories (Renneboog et al. 2008b). This is consistent with the triple bottom line theory stating that the planet for environment, people for social and profit for good gover-nance (Elkington 1994). The investors should not only consider their return on a financial investment, but also care about the impor-tance of its social value, business place, the characteristics of a company’s goods or ser-vices, and the way a business is run. Conse-quently, a corporation should play a part in its long-term impact on the environment and society (Sparkes 2002; Vives and Wadhwa 2012). This is one of the reasons why the focus for the motivation of SRI investors re-quires changes in their mindset and personal beliefs for a better environment, social mat-ters and governance without sacrificing the return on the investment. With this triple bottom line investment strategy (people, planet and profit), they not only want to achieve the goal of a return on their invest-ment but also integrate their environinvest-mental, social and governance considerations into the investment decision (Budde 2008; Sandberg 2008; Schueth 2003).
Portfolio Theory Perspective
particu-larly in choosing a portfolio’s asset allocation. Markowitz’s contribution specifically de-scribes how a well-diversified portfolio re-duced the risk of equity investments.
It is argued by Black and Litterman (1992) that investors with a global portfolio are rewarded for their asset allocation deci-sions. However with different asset classes, the portfolio’s performance is consistent with the theory that higher risks are associated with greater returns (Larsen, 2013). The portfolio theory showed that a restriction on financial investments will generate a poorer risk ad-justed return (Jansson et al. 2011; Schröder 2004). Based on that, selecting a portfolio determined by ethical screening can be iden-tified as a high value practice that may last with no negative impact on the investment’s return (Bauer et al. 2006). Therefore, inves-tors are willing to receive lesser returns in return for better sustainability in the world (Hamilton et al. 1993).
As mentioned earlier, SRI offers a portfolio that is based on ESG screening. How-ever, social screens could constrain a portfolio’s improvement (Bollen 2007). Undoubtedly, prior studies demonstrate that a significant number of investors want a portfolio that is consistent with their personal values, which therefore limits diversification. In other words, they refuse to invest in a “sin-stock” portfolio and so the SRI provides them with the ability to invest in firms that support ESG (Kinder 2005). This is consistent with Statman (2013) who gave an idiom regarding investment portfolios which states that “The frying pan of investments is sometimes very hot, but we should pause and think before we jump into the fire”.
Doing Well While Doing Good Perspective
Despite providing a better perfor-mance, SRI is against “sin-stocks”. Instead, SRI argues that an investment should follow the term “Doing well while doing good” as noted by Hamilton et al. (1993). In this context, SRI funds use screening to distinguish them from other investments without neglecting the main purpose of an investment; its returns. This argument is also supported by Derwall et al. (2005) who specifically discussed what is called the “eco-efficiency premium puzzle” which explains that SRI portfolio funds have a bet-ter risk-return profile than the conventional funds. By applying screening to an investment portfolio, the investor is open to risk adjusted returns that are matched to their mindset. In line with this, the investors are more con-vinced about the performance of SRI invest-ments. This can be connected to Galema et al. (2008) who argued that the establishment of SRI portfolios with good implementation in the environmental, diversity and technol-ogy fields of eco-friendly products had a sig-nificant impact on stock returns.
Empirical Evidence and
Hypothesis Development
Studies about SRI’s performance are varied. Besides socially responsible indices, the previous empirical studies integrated the comparison of SRI mutual funds with the conventional benchmark’s performance. The socially responsible mutual fund’s literature, for the majority, were focused on the US and Europe. The common measurements of funds’ performance are Sharpe’s Ratio, Treynor’s Ratio, Jensen´s Alpha Ratio, and Sortino’s Ratio, that all have the specific pur-pose of explaining the funds’ risks and re-turns. Most studies used these models to measure the comparative performance of SRI funds. The following sections describe each one of these risk-adjusted performance mea-sures used in the previous research.
Sharpe Index Performance Measure Ferruz et al. (2010) defines Sharpe’s Ratio as a measurement calculating unit of the return from the less risk free-rate asset portfolio that is related to the total risk. This Sharpe’s Ratio measurement is aimed at evalu-ating portfolios with diversifiable or unsys-tematic risks. The higher that the value of Sharpe’s Ratio is, this indicates a better risk-adjusted performance. A study by Sauer (1997) specified the Sharpe’s Ratio for a so-cially responsible index, namely the DSI In-dex, together with the S&P 500 Index and the CRSP Value Weighted Market Index, as conventional benchmarks indices. The find-ings indicated a positive impact for SRI’s per-formance using risk adjusted returns. With a higher Sharpe’s Ratio, it can be concluded that the application of socially screened in-vestment index selections justifies that this ratio would not eliminate the benefits of SRI’s diversification.
Another study using Sharpe’s Ratio, to compare between sustainability indices and the conventional benchmark, was done by Le Maux and Le Saout (2004). This study used the sustainability indices data, consisting of the DJSI World, FTSE4Good Global 100, FTSE4Good UK50, FTSE4Good US100 and FTSE4Good Europe 50. Segregating the data into two sub periods, the findings con-cluded that the majority of the sustainability indices had higher values for Sharpe’s Ratio (= outperform) than the conventional bench-marks.
benchmarks, namely the FTSE100 and FTSE4GOOD, over the whole period. Treynor’s Index Performance Measure
Ferruz et al. (2010) described the return premium of Treynor’s Ratio Index perfor-mance measure, which was obtained from the asset or portfolio per unit of systematic risk. This Treynor’s Ratio assessed the returns earned in excess of a riskless investment, per unit of market risk (Beer et al. 2011). Kreander et al. (2005) used Treynor’s Ratio as the risk-adjusted performance returns for the comparative performance analysis in a sample of 13 domestic ethical funds that were recognized as Euro Zone funds. Treynor’s Ratio showed that 8 (UK and Sweden) from 13 domestic ethical funds outperformed their non-ethical mutual funds’ benchmarks. An-other study by Cummings (2000) indicated that SRI ethical trusts outperformed the trust’s industry average index as the conven-tional benchmark. Meanwhile, Collison et al. (2008) analyzed the risk-adjusted return per-formance of SRI indices using Treynor’s Ra-tio over two periods. However, unlike the earlier studies, the analysis resulted in nega-tive values, which indicated that the SRI in-dices underperformed their conventional counterparts.
Jensen’s Alpha Index Performance Measure
Jensen’s Alpha measurement is also used to identify whether an index outperforms or underperforms a market portfolio. In another interpretation, it estimates the extra or excess returns earned by a fund. DiBartolomeo and Kurtz (1999) considered the return perfor-mance by using Jensen’s Alpha measurement and found positive alphas for the Domini Social Index (DSI) and the S&P 500. More-over, the DSI had a higher alpha than the S&P 500 as the conventional benchmark. The
outperformance of the DSI was considered as evidence that the social screening factor made a contribution to the performance of the investment index.
A study by Kreander et al. (2005) was conducted to analyze the Jensen’s Alpha Ra-tio of 17 internaRa-tional ethical mutual funds. The results of this study showed that the average of the overall Jensen’s Alpha Ratio of the funds was 0.00032, higher than their conventional mutual fund benchmark at -0.0019. A higher Jensen’s Alpha for socially responsible portfolios was also observed in a study by Bello (2005). The study compared socially responsible portfolios between the S&P 500 (the conventional index benchmark) and the DSI 400 (the SRI benchmark). From the risk-adjusted return performance measure of Jensen’s Alpha, the socially responsible portfolios recorded an alpha of 0.0777 points which was higher than the Jensen’s Alpha of the S&P 500.
Therefore, from the discussion and em-pirical evidence of the risk-adjusted return measures above, the hypothesis is developed as follows:
H: The SKI presents significantly higher risk-ad-justed returns than the Jakarta Composite In-dex (JCI).
Data and Methods
The daily closing indices are used to measure the performance of the SKI and the Jakarta Composite Index. The daily closing indices were collected from IDX monthly sta-tistics and the IDX stasta-tistics daily report. The data for this study were collected from Janu-ary 2009 to December 2014, as the SKI was only introduced on December the 28th, 2006 and launched in January 2009.
The first step to identifying the return is by calculating the average daily raw returns of both the SKI and the Jakarta Composite Indices. The actual daily return (Rt) for both indices are formulated as shown in Equation 1, and then averaged over the period by di-viding them by the number of days (N), as in Equation 2.
Sharpe’s Index (SI) performance mea-sure indicates the risk premium return per unit of the total risk. Sharpe’s Ratio also measures the performance of the SRI index, the mean of excess return, standard deviation and re-turn of the risk-free interest asset (Derwall et al. 2005). Sharpe’s Index (1966) for indi-ces can be expressed as follows:
...(3)
Where:
Ri = average return for the index RFR =risk-free rate (SBI)
i = standard deviation of the indices re-turns.
The standard deviation for both indi-ces (i) is computed by using the equation below.
...(4)
Where E (Ri,t) is the expected return of the index.
As the next stage of Sharpe’s Index per-formance test, this study will calculate the Adjusted Sharpe’s Index performance mea-sure (ASI). This adjustment is due to the bias in the estimation of the standard deviation (Jobson and Korkie (1981)). Similar studies conducted using this method include those by Hamzah et al. (2009), and Ahmad and Ibrahim (2002). Those studies used the equa-tion as follows:
..(5)
of the average return to the beta of the fund. The performance measurement of Treynor’s Ratio is different from Sharpe’s measurement because the former only treats the system-atic risks or beta (â) for the indices when ex-amining performance. The TI ratio for both indices (TIi,t) are calculated using the follow-ing:
...(6)
where Ri,t and RFR are as previously defined. The TI measure is a relative measurement which needs to be compared to the market portfolio. A portfolio with a higher TI value than the market indicates that the portfolio has a better risk-adjusted performance.
The beta coefficient () of the SKI was obtained by regressing past returns of the in-dex against the market returns by using the market model given below.
...(7) Where:
Ri,t = average monthly return of the index in month t
i = standard deviation (regression inter-cept)
i = beta coefficient of the index
Rm,t = daily return of the market portfolio in day t, proxied index
ei,t = regression’s unexplained residual return in day t, where E(ei,t) = 0
Jensen’s Alpha Index is the next perfor-mance measure used. It represents the aver-age risk premium per unit of the systematic risk. Consequently, Jensen’s Alpha is a spe-cific measurement for the risk-adjusted return of a portfolio’s performance, for investors with a well diversified SRI portfolio and is
primarily concerned with their exposure to systematic risk (Sauer 1997). Jensen’s Alpha is usually interpreted as a measurement of out-or-under performance relative to the benchmark (Le Maux and Le Saout 2004). Like Treynor, the measurement considers the systematic risk (beta) as the relevant risk. Therefore, Jensen’s Alpha measurement (i) is expressed as follows:
Rmt = the return on the relevant equity bench-mark in month t and eit an error term. Nevertheless, this Jensen measure can-not be used to compare the performance of different level indices that have different av-erage performance levels. Therefore, this Jensen’s Alpha measurement has been ad-justed for systematic factor risks and is called the Adjusted Jensen’s Alpha Index (AJI). A positive (negative) AJI shows the superior (or inferior) performance of portfolios relative to the market. The equation for the AJI is computed as follows:
...(9)
The last performance measure em-ployed is Sortino’s Ratio. This ratio describes the differential return of a portfolio by a unit of downside risk. The downside risk is the calculation of the risk of a portfolio, consid-ering only its probability of incurring a re-turn inferior to that accepted by the investor. Sortino’s Ratio is computed as follows:
where, Ri and RFR are as explained previously i is the downside deviation of the rate of return of index i during the specified time pe-riod.
The downside risk äi of Sortino’s Ratio is obtained by the following:
...(11)
Where:
i = the downside deviation
Rp = return portfolio (index)
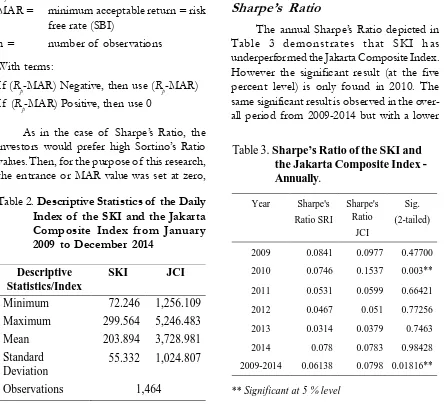
MAR = minimum acceptable return = risk free rate (SBI)
n = number of observations
With terms:
If (Rp-MAR) Negative, then use (Rp-MAR) If (Rp-MAR) Positive, then use 0
As in the case of Sharpe’s Ratio, the investors would prefer high Sortino’s Ratio values. Then, for the purpose of this research, the entrance or MAR value was set at zero,
as rational investors are averse to negative fund returns (Viviers et al. 2008).
Result and Discussion
The descriptive statistics of the daily SKI and Jakarta Composite Index (JCI) are shown in Table 2. It can be seen that the SKI involved 1,464 daily index prices during the overall period which were then matched by the same number of observations from the JCI.
Sharpe’s Ratio
The annual Sharpe’s Ratio depicted in Table 3 demonstrates that SKI has underperformed the Jakarta Composite Index. However the significant result (at the five percent level) is only found in 2010. The same significant result is observed in the over-all period from 2009-2014 but with a lower
Year Sharpe's
Ratio SRI
Sharpe's Ratio
JCI
Sig. (2-tailed)
2009 0.0841 0.0977 0.47700
2010 0.0746 0.1537 0.003**
2011 0.0531 0.0599 0.66421
2012 0.0467 0.051 0.77256
2013 0.0314 0.0379 0.7463
2014 0.078 0.0783 0.98428
2009-2014 0.06138 0.0798 0.01816**
Descriptive Statistics/Index
SKI JCI
Minimum 72.246 1,256.109
Maximum 299.564 5,246.483
Mean 203.894 3,728.981
Standard Deviation
55.332 1,024.807
Observations 1,464
Table 2. Descriptive Statistics of the Daily Index of the SKI and the Jakarta Composite Index from January 2009 to December 2014
Table 3. Sharpe’s Ratio of the SKI and the Jakarta Composite Index -Annually.
** Significant at 5 % level
value. These results safely reject the hypoth-esis that SKI presents higher risk-adjusted return performance (Sharpe’s Ratio) against the Jakarta Composite Index (JCI). The out-come of this study is consistent and relevant with the SRI’s empirical literature that high-lights the lower performance of Sharpe Ratio’s, such as Schröder (2004) and Ortas et al. (2012). Lyn and Zychowicz (2010).
Due to possible bias in the estimation of the standard deviation, the study calcu-lates the performance of the adjusted Sharpe’s Index ratio which represents the rel-evant risk-adjusted measurement of perfor-mance with the average risk premium per unit of total risk.
As can be observed in Table 4, the re-sult of the Adjusted Sharpe’s Index (ASI) is relatively similar to the Sharpe’s Ratio index’s performance. The mixed results begin from 2009 until 2014. The results again show that SKI was outperformed by the JCI at a signifi-cant level of five percent, but only in 2010. Results from the overall period confirm that the JCI outperformed SKI and this is also sig-nificant at the five percent level. Therefore, the result from the adjusted Sharpe’s Ratio rejects the hypothesis that the SKI presents higher risk-adjusted return performance than the Jakarta Composite Index (JCI).
Treynor’s Ratio
The results using Treynor’s Ratio in Table 5 conclude that SKI has a superior per-formance against the JCI. Except for 2009
Year Treynor's Ratio
SRI
Treynor's Ratio
JCI
Sig. (2-tailed)
Beta SRI
Sig. (2-tailed)
2009 0.00184 0.00195 0.77061 0.96857 1.064E-22***
2010 0.00099 0.00146 0.0767* 0.97075 1.686E-21***
2011 0.00016 -2.67E-04 0.23924 0.97063 4.326E-20***
2012 -0.0005 -0.00097 0.29555 0.85373 1.496E-06***
2013 -0.0004 -0.00049 0.65938 0.96948 2.147E-20***
2014 0.00089 0.00068 0.0973* 0.96956 2.866E-20***
2009-2014 0.00051 0.00043 0.54909 0.95045 7.5E-63***
Year Adjusted Sharpe's Ratio SRI
Adjusted Sharpe's Ratio JCI
Sig. (2-tailed)
2009 0.08122 0.09428 0.47809
2010 0.07197 0.14815 0.00347**
2011 0.05134 0.058 0.66244
2012 0.04521 0.0493 0.77479
2013 0.03047 0.03668 0.74687
2014 0.07512 0.07538 0.98566
2009-2014 0.05922 0.07697 0.0182**
Table 4. Adjusted Sharpe’s Index of the SKI and the Jakarta Composite Index - Annually
** Significant at 5 percent level
Table 5.Treynor’s Ratio and Beta Value of the SKI and the Jakarta Composite Index -Annually
and 2010, the evidence of a positive value for Treynor appears during the other annual periods, indicating an outperform condition for the SKI. However, the significant result is only found in 2014, which is higher than the JCI, which is also significant in 2010, This result demonstrates that Treynor’s Ratio gives some support to the hypothesis that the SKI presents higher risk-adjusted return perfor-mance than the Jakarta Composite Index (JCI). This finding is consistent with previ-ous empirical studies by Goldreyer et al. (1999), Le Maux and Le Saout (2004) and Kreander et al. (2005) and Goldreyer et al. (1999).
Jensen’s Alpha
Referring to Table 6, the evidence of a positive Jensen’s Alpha (except for 2010) shows that the SKI outperforms the market benchmark of the JCI. This is corroborated by the results from the overall period with a positive Jensen’s Alpha at the significant level of ten percent.
This result supports the hypothesis that Jensen’s Alpha presents a more positive,
sig-nificant, high risk-adjusted return perfor-mance than the JCI do es. The positive sig-nificant alpha indicates that the socially re-sponsible index performs better than the con-ventional market index. This is consistent with the findings by Cortez et al., 2009; Fabozzi, Gupta, and Markowitz, 2002).
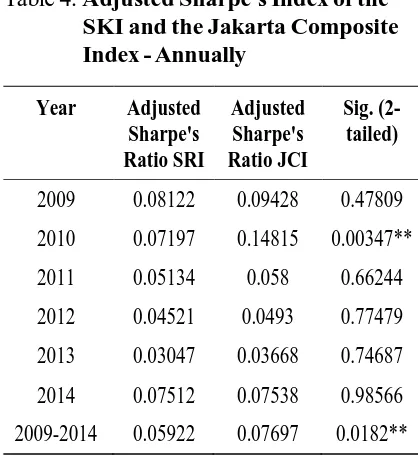
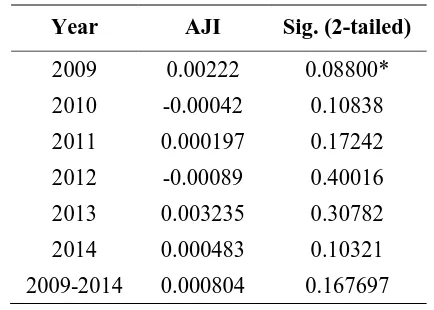
To reinforce the performance outcome of Jensen’s Alpha, the Adjusted Jensen’s Al-pha Index measurement (AJI) is constructed for systematic factors that are represented by beta. The value of the positive (negative) adjusted Jensen’s Alpha Index shows the su-perior (inferior) performance of portfolios relative to the market. From Table 7, we can observe that the results of Jensen’s Alpha are similar to those of the Adjusted Jensen’s Al-pha.
From the results tabulated above, the annual Adjusted Jensen’s Alpha during 2010 and 2012 produced a negative alpha, while the other periods generate a positive alpha, with 2009 being the only year which has a significant result at the ten percent level. For the whole period from 2009 to 2014, Jensen’s Alpha is positive, indicating that SKI had a
Year Jensen's
2009-2014 0.000972 0.0743*
Table 6. Jensen’s Alpha of the SKI -Annually
2009-2014 0.000804 0.167697
Table 7.Adjusted Jensen’s Alpha of the SKI - Annually
superior performance to the JCI. However, the result is found to be insignificant. The Adjusted Jensen’s Alpha Index (AJI), to a cer-tain extent, provides evidence to support Jensen’s Alpha in explaining the superior per-formance of the SKI against the Jakarta Com-posite Index.
Sortino’s Ratio
The outcomes of Sortino’s Ratio, as a performance measure for the period from 2009 to 2014 are tabulated in Table 8. It is shown that, Sortino’s Ratios of the SKI and JCI reflect that both produce negative returns
in almost all years. However, those results are only significant in 2010 and 2014 at the ten percent level. It is also noted that SKI posted lower negative returns than the JCI, except in 2011 and 2014. Positive returns for the JCI are only observed in 2011 and 2013, but both are insignificant. The outcome from the over-all period of 2009 to 2014 concludes that the value of Sortino’s Ratio of the SKI experi-ences a slightly lower negative return than the JCI. Therefore, the hypothesis that the SKI presents higher risk-adjusted return perfor-mance than the Jakarta Composite Index (JCI) cannot be accepted.
Year Sortino's Ratio
SRI
Sortino's Ratio JCI
Sig. (2-tailed)
2009 -0.00183 -0.00194 0.7824
2010 -0.00102 -0.00141 0.0808*
2011 -0.00013 3.37E-05 0.2343
2012 -0.00043 -0.00046 0.9589
2013 0.00039 0.00051 0.6534
2014 -0.00087 -0.00071 0.0949*
2009-2014 -0.00064 -0.00065 0.9329
Table 8. Sortino’s Ratio Index of the SKI and the Jakarta Composite Index - Annually
*Significant at 10%
Index Sharpe ASI Treynor Jensen's
Alpha AJI Sortino
SKI 0.06138 0.05922 0.000510 0.000972 0.000804 -0.000638
JCI 0.07980 0.07697 0.000438 - - -0.000646
Sig. (2-tailed) 0.0181** 0.0182** 0.549091 0.0743* 0.167697 0.93291
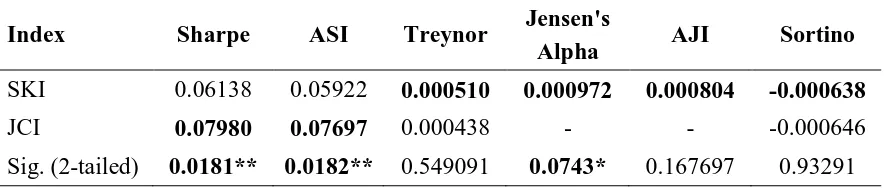
Table 9. Summary of the Risk Adjusted Returns of the SKI and the Jakarta Composite Index for the Overall Period from 2009-2014
Summary of Risk-Adjusted
Return Performance
The performance evaluation is an im-portant aspect of any portfolio’s selection. From the earlier section, the risk-adjusted return performance measures namely Sharpe, Adjusted Sharpe, Treynor, Jensen’s Alpha, Adjusted Jensen’s Alpha and Sortino’s Ratios are observed and evaluated. Table 9 presents the summary of the various performance measures for both SKI and the JCI.
The table displays the findings of the adjusted performance measures for both the SKI and Jakarta Composite Indices. Sharpe’s Ratio index and Adjusted Sharpe’s Ratio in-dex show SKI’s lower performance, compared to the JCI and it is significant at the five per-cent level. However, different results can be observed from Treynor, Jensen’s Alpha, Ad-justed Jensen’s Alpha and Sortino’s Ratios where the SKI has a better performance (outperform) than the JCI. However, only Jensen’s Alpha is significant at the ten per-cent level.
Conclusion
The findings of this study generally in-dicate that, except for Sharpe and Adjusted Sharpe’s Ratios, the risk-adjusted return of the SKI’s performance (Treynor’s Ratio, Jensen’s Alpha and Sortino’s Ratios) is better than that of the JCI, as a conventional bench-mark index, over the period from 2009 to 2014. However, only Sharpe’s Ratio, Adjusted Sharpe’s Ratio and Jensen’s Alpha are found to be significant. The outcome of this study can be associated with the restrictions on in-vestment that affect the opportunities for the investment to perform. If the investors want to utilize their maximizing return, they must hold in their portfolio a combination of the
market’s risky assets and risk-free assets. However, social screening for SRI is incom-patible with the modern portfolio theory. Modern portfolio theories suggest that any restrictions imposed on a portfolio’s selection results in inferior performance (Das and Rao 2013; Jones et al. 2008; Reyes and Grieb 1998). The underperformance of the SRI fund might be causing a smaller diversifica-tion effect. The ethical concept of SRI through its screening criteria restricts the po-tential for portfolio diversification. This could be the reason for the underperformance of the SKI.
underperformed. This is also supported by Lean and Nguyen (2014) who examined SRI indices from three major regions (Asia Pacific, Europe and North America) and noted they also underperformed during the crisis of 2008 and 2009.
Socially responsible investment, which is also known as ethical investment in Indo-nesia, is still in its infancy. Therefore, the empirical evidence from the area of SRI in Indonesia is very limited. This study was con-ducted from the inception of SKI for a pe-riod of six years, from 2009 to 2014. Unde-niably, the findings of this study may not be as significant as those from a study over a longer time period and with a greater number of observations. To capture the real impact of SRI’s performance, future studies into this should be conducted in an expanded time frame. It is also noted that the coverage of
socially responsible investment is very wide, as it affects the environment, society and governance. However, this study was con-ducted based on an index consisting of 25 companies in different industries that met the selection criteria of SKI. Therefore, future studies into SRI should also be conducted on other SRI’s funds in Indonesia. The fact that Indonesia is highlighted as the country with the largest Muslim population in the world make it very pertinent for any future research to explore the performance of Islamic or Shariah funds/indices, which are also identi-fied as another kind of SRI. As this study concludes that SRI’s performance in Indone-sia through SKI generally yielded an inferior result, it is also interesting to explore the pos-sible link between SRI’s performance with behavioral finance, in order to shed more light onto this area.
References
Adam, A. A., and E. Shauki. 2012. Socially responsible investment in Malaysia: Behavioural framework in evaluating investors’ decision making [rocess. Journal of Cleaner Production 80: 224-240.
Ahmad, Z., and H. Ibrahim. 2002. A study of performance of the KLSE syariah index. Malaysian Man-agement Journal 6(1 and 2): pp. 25-34.
de Souza Cunha, F. A. F., and C. Samanez. 2013. Performance analysis of sustainable investments in the Brazilian Stock Market: A study about the corporate sustainability index (ISE). Journal of Business Ethics 117 (1): 19-36. doi: 10.1007/s10551-012-1484-2
Bauer, R., R. Otten, and A. T. Rad. 2006. Ethical investing in Australia: Is there a financial penalty? Pacific-Basin Finance Journal 14 (1): 33-48. doi: 10.1016/j.pacfin.2004.12.004
Beer, F. M., J. P. Estes, and H. J. Munte. 2011. The performance of faith and ethical investment products: An empirical investigation of the last decade. Journal of the Academy of Business and Economics 30: 101-124.
Black, F., and R. Litterman. 1992. Global portfolio optimization. Financial Analysts Journal 48 (5): 28-43. doi: http://www.jstor.org/stable/4479577
Bollen, N. P. 2007. Mutual fund attributes and investor behavior. Journal of Financial and Quantitative Analysis 42 (3): 683.
Budde, S. J. 2008. Compelling Returns: A Practical Guide to Socially Responsible Investing: John Wiley & Sons. Charlo, M. J., I. Moya, and A. M. Muñoz. 2013. Sustainable development and corporate financial
perfor-mance: A study based on the FTSE4Good IBEX Index. Business Strategy and the Environment, n/a-n/a. doi: 10.1002/bse.1824
Collison, D. J., G. Cobb, D. M. Power, and L. A. Stevenson. 2008. The financial performance of the FTSE4Good indices. Corporate Social Responsibility and Environmental Management 15 (1), 14-28. doi: 10.1002/csr.144
Cortez, M. C., F. Silva, and N. Areal. 2009. The performance of European Socially Responsible Funds. Journal of Business Ethics 87 (4): 573-588. doi: 10.1007/s10551-008-9959-x
Cummings, L. 2000. The financial performance of ethical investment trusts: An Australian perspective. Journal of Business Ethics 25 (1): 79-92. doi: 10.1023/a:1006102802904
Das, P. K., and S. P. U. Rao. 2013. Performance evaluation of socially responsible mutual funds using style analysis. Social Responsibility Journal 9(Iss: 1):109 - 123. doi: DOI 10.1108/17471111311307840 Derwall, J., N. Guenster, R. Bauer, and K. Koedijk. 2005. The eco-efficiency premium puzzle. Financial
Analysts Journal: 51-63.
DiBartolomeo, D., and L. Kurtz. 1999. Managing Risk Exposures of Socially Screened Portfolios. Northfield Information Services, Boston. http://www.northinfo.com.
Dunfee, T. 2003. Social investing: Mainstream or backwater? Journal of Business Ethics 43 (3): 247-252. doi: 10.1023/a:1022914831479.
Elkington, J. 1994. Towards the sustainable corporation: Win-win-win business strategies for sustainable development. California Management Review 36 (2): 90–100.
Fabozzi, F. J., F. Gupta, and H. M. Markowitz. 2002. The legacy of modern portfolio theory. The Journal of Investing 11 (3): 7-22.
Fama, E. F. 1968. Risk, return and equilibrium: Some clarifying comments. The Journal of Finance 23 (1): 29-40. doi: 10.1111/j.1540-6261.1968.tb02996.x
Ferruz, L., F. Gómez-Bezares, and M. Vargas. 2009. Performance measures: Advantages of linear risk penalization. Applied Financial Economics 19 (1): 73-85. doi: 10.1080/09603100701477283
Ferruz, L., F. Gómez-Bezares, and M. Vargas. 2010. Portfolio theory, CAPM and performance measures. In C.-F. Lee, A. Lee and J. Lee (Eds.), Handbook of Quantitative Finance and Risk Management: 267-281. Springer US.
Galema, R., A. Plantinga, B. Scholtens. 2008. The stocks at stake: Return and risk in socially responsible investment. Journal of Banking and Finance 32 (12): 2646-2654. doi: 10.1016/j.jbankfin.2008.06.002 Goldreyer, E. F., and D. J. Diltz. 1999. The performance of socially responsible mutual funds: Incorpo-rating sociopolitical information in portfolio selection. Managerial Finance 25 (1): 23 - 36. doi: 10.1108/ 0307435991076583
Hamzah, A. H., M. B. Rozali, and I. M. Tahir. 2009. Empirical investigation on the performance of the Malaysian Real Estate Investment Trusts in pre-crisis, during crisis and post-crisis period. Interna-tional Journal of Economics and Finance 2 (2): p. 62.
Hickman, K. A., W. R. Teets, and J. J. Kohls. 1999. Social investing and modern portfolio theory. American Business Review 17 (1): 72-78.
Jansson, M., A. Biel, M. Andersson, and T. Gärling. 2011. Investment style and perceived drivers of adoption of socially responsible investment among Swedish institutional investors. The Journal of Investing 20 (3): 118-123.
Jobson, J. D., and B. M. Korkie. 1981. Performance hypothesis testing with the Sharpe and Treynor measures. The Journal of Finance 36 (4): 889-908. doi: 10.1111/j.1540-6261.1981.tb04891.x Jones, S., S. van der Laan, G. Frost, and J. Loftus. 2008. The investment performance of socially
respon-sible investment funds in Australia. Journal of Business Ethics 80 (2): 181-203. doi: http://dx.doi.org/ 10.1007/s10551-007-9412-6
Khotim, A. 2014. Analisis pembentukan portofolio optimal dengan menggunakan model indeks tunggal dan Stochastic Dominance dalam pengambilan keputusan investasi (Studi pada saham-saham indeks SRI KEHATI yang listing di Bursa Efek Indonesia periode 2010–2013. Jurnal Administrasi Bisnis 11 (1).
Kinder, P. D. 2005. Socially Responsible Investing: An Evolving Concept in a Changing World. Boston, Mass.: KLD Research & Analytics, Inc.
Kreander, N., R. H. Gray, D. M. Power, and C. D. Sinclair. 2005. Evaluating the performance of ethical and non-ethical funds: A matched pair analysis. Journal of Business Finance and Accounting 32 (7-8): 1465-1493. doi: 10.1111/j.0306-686X.2005.00636.x
Larsen, G. A. 2013. Enhancing the returns of SRI portfolios using a minimum variance small-basket strategy. Journal of Financial Planning 26 (5): 46 - 53. doi: http://dx.doi.org/10.2139/ssrn.2279115 Layungasri, G. R. 2010. Challenges for sustainability index: Is being ‘green’ economically viable for
Indo-nesian mining companies? SSRN. doi: http://dx.doi.org/10.2139/ssrn.1589120
Le Maux, J., and E. Le Saout. 2004. The performance of sustainability indexes. Finance India 18: 737-750. Lean, H. H., and D. K. Nguyen. 2014. Policy uncertainty and performance characteristics of sustainable investments across regions around the global financial crisis. Applied Financial Economics 24 (21): 1367-1373. doi: 10.1080/09603107.2014.925063
Lyn, E. O., and E. J. Zychowicz. 2010. The impact of faith-based screens on investment performance. The Journal of Investing 19 (3): 136-143.
Markowitz, H. 1952. Portfolio selection. The Journal of Finance 7 (1): 77-91. doi: 10.1111/j.1540-6261.1952.tb01525.x
McGuire, J. B., A. Sundgren, and T. Schneeweis. 1988. Corporate social responsibility and firm financial performance. Academy of Management Journal 31 (4): 854-872.
Miniaoui, H., H. Sayani, and A. Chaibi. 2015. The impact of financial crisis on Islamic and conventional indices of the GCC countries. Journal of Applied Business Research (JABR) 31 (2): 357-370.
Moskowitz, M. 1972. Choosing socially responsible stocks. Business and Society Review 1 (1): 71-75. Ortas, E., J. M. Moneva, M. Salvador. 2012. Does socially responsible investment equity indexes in emerging
markets pay off? Evidence from Brazil. Emerging Markets Review 13 (4): 581-597. doi: http:// dx.doi.org/10.1016/j.ememar.2012.09.004
Renneboog, L., J. Ter Horst, and C. Zhang. 2008a. The price of ethics and stakeholder governance: The performance of socially responsible mutual funds. Journal of Banking and Finance 14: 302-322 Renneboog, L., J. Ter Horst, and D. Zhang. 2008b. Socially responsible investments: Institutional aspects,
performance, and investor behavior. Journal of Banking and Finance 32 (9); 1723-1742. doi: 10.1016/ j.jbankfin.2007.12.039
Renneboog, L., J. Ter Horst, and C. Zhang. 2008). Socially responsible investments: Institutional aspects, performance, and investor behavior. Journal of Banking and Finance 32 (9): 1723-1742. doi: 10.1016/ j.jbankfin.2007.12.039
Reyes, M. G., and T. Grieb. 1998. The external performance of socially-responsible mutual funds. Ameri-can Business Review 16 (1): 1-7.
Sandberg, J. 2007. Should I invest with my conscience? Business Ethics: A European Review 16 (1): 71-86. doi: 10.1111/j.1467-8608.2006.00470.x
Sandberg, J. 2008. The Ethics of Investing. Making Money or Making a Difference? Go¨teborg: University of Gothenburg, Acta Universitatis Gothoburgensis.
Sauer, D. A. 1997. The impact of social-responsibility screens on investment performance: Evidence from the domini 400 social index and domini equity mutual fund. Review of Financial Economics 6 (2): 137-149. doi: 10.1016/s1058-3300(97)90002-1
Schröder, M. 2004. The performance of socially responsible investments: Investment funds and indices.
Financial Markets and Portfolio Management 18 (2): 122-142. doi: 10.1007/s11408-004-0202-1 Schueth, S. 2003. Socially responsible investing in the United States. Journal of Business Ethics 43 (3): 189-194.
doi: 10.1023/a:1022981828869
Sparkes, R. 2002. Socially Responsible Investment, A Global Revolution. The Athrium, Southern Gate, Chichester, West Sussex, England: John Wiley & Sons.
Statman, M. 2000. Socially responsible mutual funds. Financial Analysts Journal 56 (3): 30-39.
Tambunan, T. T. 2010. The Indonesian experience with two big economic crises. Modern Economy 1 (03):156. The European Sustainable Investment Forum. 2010. Emerging Market Theme Report -5th in A Series. from
http://www.eurosif.org
The Forum for Sustainable and Responsible Investment 2012. Sustainable and Responsible Investing Facts. from http://www.ussif.org.
Vives, A., and B.Wadhwa. 2012. Sustainability indices in emerging markets: Impact on responsible prac-tices and financial market development. Journal of Sustainable Finance and Investment 2 (3-4):318-337. doi: 10.1080/20430795.2012.715578
Viviers, S., J. Bosch, E. Smit, and A. Buijs. 2008. The risk-adjusted performance of responsible investment funds in South Africa. Investment Analysts Journal 68.
Viviers, S., J. Bosch, E. Smit, and A. Buijs. 2009. Responsible investing in South Africa. Investment Analysts Journal 69: 3-16.
Waring, P., and J. Lewer. 2004. The impact of socially responsible investment on human resource man-agement: A conceptual framework. Journal of Business Ethics 52 (1): 99-108. doi: 10.1023/ B:BUSI.0000033110.21900.da